wheat - FAR
wheat - FAR
wheat - FAR

You also want an ePaper? Increase the reach of your titles
YUMPU automatically turns print PDFs into web optimized ePapers that Google loves.
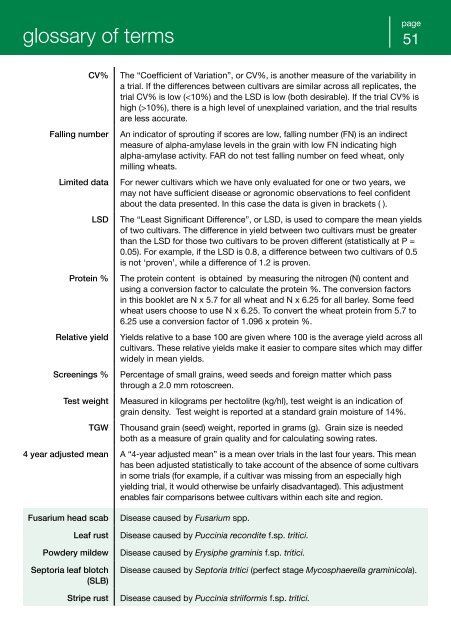
glossary of terms<br />
page<br />
51<br />
CV%<br />
Falling number<br />
Limited data<br />
LSD<br />
Protein %<br />
Relative yield<br />
Screenings %<br />
Test weight<br />
TGW<br />
The “Coefficient of Variation”, or CV%, is another measure of the variability in<br />
a trial. If the differences between cultivars are similar across all replicates, the<br />
trial CV% is low (10%), there is a high level of unexplained variation, and the trial results<br />
are less accurate.<br />
An indicator of sprouting if scores are low, falling number (FN) is an indirect<br />
measure of alpha-amylase levels in the grain with low FN indicating high<br />
alpha-amylase activity. <strong>FAR</strong> do not test falling number on feed <strong>wheat</strong>, only<br />
milling <strong>wheat</strong>s.<br />
For newer cultivars which we have only evaluated for one or two years, we<br />
may not have sufficient disease or agronomic observations to feel confident<br />
about the data presented. In this case the data is given in brackets ( ).<br />
The “Least Significant Difference”, or LSD, is used to compare the mean yields<br />
of two cultivars. The difference in yield between two cultivars must be greater<br />
than the LSD for those two cultivars to be proven different (statistically at P =<br />
0.05). For example, if the LSD is 0.8, a difference between two cultivars of 0.5<br />
is not ‘proven’, while a difference of 1.2 is proven.<br />
The protein content is obtained by measuring the nitrogen (N) content and<br />
using a conversion factor to calculate the protein %. The conversion factors<br />
in this booklet are N x 5.7 for all <strong>wheat</strong> and N x 6.25 for all barley. Some feed<br />
<strong>wheat</strong> users choose to use N x 6.25. To convert the <strong>wheat</strong> protein from 5.7 to<br />
6.25 use a conversion factor of 1.096 x protein %.<br />
Yields relative to a base 100 are given where 100 is the average yield across all<br />
cultivars. These relative yields make it easier to compare sites which may differ<br />
widely in mean yields.<br />
Percentage of small grains, weed seeds and foreign matter which pass<br />
through a 2.0 mm rotoscreen.<br />
Measured in kilograms per hectolitre (kg/hl), test weight is an indication of<br />
grain density. Test weight is reported at a standard grain moisture of 14%.<br />
Thousand grain (seed) weight, reported in grams (g). Grain size is needed<br />
both as a measure of grain quality and for calculating sowing rates.<br />
4 year adjusted mean A “4-year adjusted mean” is a mean over trials in the last four years. This mean<br />
has been adjusted statistically to take account of the absence of some cultivars<br />
in some trials (for example, if a cultivar was missing from an especially high<br />
yielding trial, it would otherwise be unfairly disadvantaged). This adjustment<br />
enables fair comparisons betwee cultivars within each site and region.<br />
Fusarium head scab<br />
Leaf rust<br />
Powdery mildew<br />
Septoria leaf blotch<br />
(SLB)<br />
Stripe rust<br />
Disease caused by Fusarium spp.<br />
Disease caused by Puccinia recondite f.sp. tritici.<br />
Disease caused by Erysiphe graminis f.sp. tritici.<br />
Disease caused by Septoria tritici (perfect stage Mycosphaerella graminicola).<br />
Disease caused by Puccinia striiformis f.sp. tritici.