2.1: Anthropometric Indicators Measurement Guide - Linkages Project
2.1: Anthropometric Indicators Measurement Guide - Linkages Project
2.1: Anthropometric Indicators Measurement Guide - Linkages Project

Create successful ePaper yourself
Turn your PDF publications into a flip-book with our unique Google optimized e-Paper software.
FOOD AND<br />
NUTRITION<br />
TECHNICAL<br />
ASSISTANCE<br />
SERIES<br />
TITLE 2<br />
INDICATOR GUIDES<br />
Bruce Cogill<br />
<strong>Anthropometric</strong><br />
<strong>Indicators</strong><br />
<strong>Measurement</strong><br />
<strong>Guide</strong>
FOOD AND<br />
NUTRITION<br />
TECHNICAL<br />
ASSISTANCE<br />
<strong>Anthropometric</strong><br />
<strong>Indicators</strong><br />
<strong>Measurement</strong><br />
<strong>Guide</strong><br />
Bruce Cogill
This publication was made possible<br />
through support provided by the Office of<br />
Health and Nutrition, Bureau for Global<br />
Programs, US Agency for International<br />
Development, under the terms of Award<br />
No. HRN-A-00-98-00046-00, the Food<br />
and Nutrition Technical Assistance<br />
<strong>Project</strong> (FANTA). Additional support was<br />
provided by the Office of Food for Peace,<br />
Bureau for Humanitarian Response.<br />
Earlier drafts of the guide were developed<br />
with funding from the Food and Nutrition<br />
Monitoring <strong>Project</strong> (IMPACT) (Contract<br />
No. DAN-5110-Q-00-0014-00, Delivery<br />
Order 16), managed by the International<br />
Science and Technology Institute, Inc.<br />
and the Food Security Unit of the<br />
LINKAGES <strong>Project</strong> (Cooperative<br />
Agreement: HRN-A-00-97-00007-00),<br />
managed by the Academy for Educational<br />
Development. The opinions expressed<br />
herein are those of the author and do not<br />
necessarily reflect the views of the<br />
US Agency for International Development.<br />
It may be reproduced, if credit is given to<br />
the FANTA <strong>Project</strong>.<br />
Copies of the <strong>Guide</strong> can<br />
be obtained from:<br />
Food and Nutrition Technical<br />
Assistance <strong>Project</strong>,<br />
Academy for Educational Development,<br />
1825 Connecticut Ave., NW,<br />
Washington D.C., 20009-5721<br />
Tel: 202-884 8700.<br />
Fax: 202-884 8432.<br />
E-mail: fanta@aed.org<br />
Website: www.fantaproject.org<br />
Recommended citation: Cogill, Bruce.<br />
<strong>Anthropometric</strong> <strong>Indicators</strong> <strong>Measurement</strong><br />
<strong>Guide</strong>. Food and Nutrition Technical<br />
Assistance <strong>Project</strong>, Academy for<br />
Educational Development, Washington<br />
DC, 2001.<br />
Published June 2001
Contents<br />
Page number Part 1.<br />
8 Introduction<br />
1.<br />
10<br />
10<br />
10<br />
11<br />
12<br />
Part 2.<br />
<strong>Anthropometric</strong> and annual monitoring indicators<br />
<strong>2.1</strong> <strong>Anthropometric</strong> <strong>Indicators</strong><br />
<strong>2.1</strong>.1 Building blocks of anthropometry: indices<br />
<strong>2.1</strong>.2 What the indices reflect about the nutritional status of<br />
infants and children<br />
2.2 Annual monitoring indicators<br />
2.<br />
3.<br />
4.<br />
14<br />
14<br />
Part 3.<br />
Collecting anthropometric data through surveys<br />
3.1 Steps for conducting a survey<br />
17<br />
17<br />
20<br />
22<br />
Part 4.<br />
Weighing and measuring equipment<br />
4.1 Scales<br />
4.2 Length/height boards<br />
4.3 Mid-upper arm circumference measure
Contents - continued<br />
5.<br />
23<br />
23<br />
24<br />
24<br />
24<br />
26<br />
28<br />
30<br />
34<br />
36<br />
36<br />
37<br />
37<br />
38<br />
38<br />
Part 5.<br />
Taking measurements<br />
5.1 Interviewer field materials<br />
5.2 Procedures before measuring<br />
5.3 How to measure age, height, length, weight and MUAC<br />
5.3.1 Age<br />
5.3.2 Height<br />
5.3.3 Length<br />
5.3.4 Weight<br />
5.3.5 MUAC<br />
5.4 Assessing the accuracy of measurements<br />
5.5 Entering the data<br />
5.6 Training field staff<br />
5.6.1 Planning the training<br />
5.6.2 Field exercises and standardization<br />
5.6.3 Survey training manual<br />
6.<br />
39<br />
39<br />
39<br />
40<br />
40<br />
41<br />
Part 6.<br />
Comparison of anthropometric data to reference standards<br />
6.1 NCHS/WHO reference standards<br />
6.2 Comparisons to the reference standard<br />
6.3 Standard deviation units or z-scores<br />
6.4 Percentage of the median and percentiles<br />
6.5 Cut-offs
43<br />
44<br />
44<br />
45<br />
48<br />
Part 7.<br />
Data analysis<br />
7.1 Source of Epi Info software<br />
7.2 Recommendations for analysis and presentation of height data<br />
7.3 Examples of data analysis<br />
7.4 Additional data analysis information<br />
49<br />
49<br />
49<br />
50<br />
Part 8.<br />
Annual monitoring indicators<br />
8.1 Introduction<br />
8.2 Routine data collection<br />
8.3 Data on growth monitoring and promotion (GMP)<br />
51<br />
55<br />
63<br />
64<br />
67<br />
69<br />
74<br />
79<br />
82<br />
93<br />
95<br />
Part 9.<br />
References<br />
Glossary<br />
Acronyms<br />
Appendix 1. Calculating Z-scores<br />
Appendix 2. Uses of anthropometric data<br />
Appendix 3. Selecting a sample<br />
Appendix 4. Measuring adults<br />
Appendix 5. Adolescent anthropometric indicators<br />
Appendix 6. Standardization of anthropometric measurements<br />
Appendix 7. <strong>Guide</strong>lines for supervising surveys<br />
Appendix 8. Title II generic indicators<br />
7.<br />
8.<br />
9.
Acknowledgements<br />
This guide draws extensively from materials from the Anthropometry<br />
Resource Center, funded by the FAO/SADC project GCP/RAF/284/NET,<br />
Development of a Regional Food Security and Nutrition Information System,<br />
particularly the UN publication, How to Weigh and Measure Children:<br />
Assessing the Nutritional Status of Young Children in Household Surveys; and<br />
the WHO publication, Physical Status: The Use and Interpretation of<br />
Anthropometry. The training tool was developed by Bill Bender and Sandy<br />
Remancus.<br />
We thank the reviewers for their thoughtful comments during the<br />
development of this guide. The Cooperating Sponsors were essential to the<br />
development of the guide and this guide is dedicated to them. Eunyong<br />
Chung of the Global Bureau’s Office of Health and Nutrition has provided<br />
insight and support for the guides and her efforts are appreciated. USAID<br />
Food for Peace officers encouraged and supported the development of the<br />
guides. A number of people assisted in the development of the guide and the<br />
writing of sections. Phil Harvey and Matthew Saaks rewrote and revised<br />
sections of the guide and their input is greatly appreciated. Sumathi<br />
Subramaniam and Laura Caulfield of Johns Hopkins University also<br />
contributed sections to the guide — Irwin Shorr, Penny Nestel, Anne<br />
Swindale, Patrick Diskin and Anne Ralte provided extensive comments and<br />
support for the guide.
This series<br />
This series of Title II Generic Indicator <strong>Guide</strong>s has been developed by the<br />
Food and Nutrition Technical Assistance (FANTA) <strong>Project</strong>, and its<br />
predecessor projects (LINKAGES and IMPACT), as part of USAID’s support<br />
to develop monitoring and evaluation systems for use in Title II programs.<br />
These guides are intended to provide the technical basis for the indicators<br />
and the recommended method for collecting, analyzing and reporting on the<br />
indicators. A list of Title II Generic <strong>Indicators</strong> that were developed in<br />
consultation with the cooperating sponsors in 1995/1996 is included in<br />
Appendix 8. The guides are available on the project website<br />
www.fantaproject.org.<br />
Below is the list of available guides:<br />
Agricultural Productivity <strong>Indicators</strong> <strong>Measurement</strong> <strong>Guide</strong><br />
Food Security <strong>Indicators</strong> and Framework for Use in the Monitoring and<br />
Evaluation of Food Aid Programs<br />
Infant and Child Feeding <strong>Indicators</strong> <strong>Measurement</strong> <strong>Guide</strong><br />
Measuring Household Food Consumption: A Technical <strong>Guide</strong><br />
Sampling <strong>Guide</strong><br />
Water and Sanitation <strong>Indicators</strong> <strong>Measurement</strong> <strong>Guide</strong>.
P ART<br />
1.Introduction<br />
1.<br />
This guide provides information on the <strong>Anthropometric</strong> Impact<br />
<strong>Indicators</strong> and the Annual Monitoring <strong>Indicators</strong> for Maternal and<br />
Child Health/Child Survival (MCH/CS) and income-related Title II<br />
activities, a subset of the P.L. 480 Title II Generic Performance <strong>Indicators</strong> for<br />
Development Activities. The impact indicators are:<br />
• decreased percent of stunted children (presented for ages 24-60<br />
months and by gender), where stunting is defined as percent of children<br />
falling below -2 standard deviations for height-for-age;<br />
• decreased percent of underweight children (in specified age<br />
groupings such as 12-24 months 36-59 months and by gender) where<br />
underweight is defined as percent of children falling below -2 standard<br />
deviations for weight-for-age.<br />
These indicators are required for the reports of projects with specific<br />
nutrition components and are collected at baseline, mid-term and final-year<br />
evaluations. Stunting, reflected by deficits in height-for-age would not be<br />
expected to change in a short time period. It is recommended, therefore, not<br />
to report stunting figures annually. Underweight (or weight for age), reported<br />
for specific age groupings, would change more quickly as it is influenced by<br />
short-term effects such as a recent outbreak of diarrheal diseases.<br />
Some programs report stunting for children under 24 months of age<br />
rather than the recommended 24-60 months age grouping. Restricting the<br />
age grouping to children under 24 months has the disadvantage of not<br />
capturing the lagged effects of the program and reducing the numbers of<br />
potential participants in a survey. The advantage of using children under 24<br />
months is that the data are more useful to determine the factors related to<br />
stunting for program design or redesign.<br />
The monitoring indicators are:<br />
• increased percent of eligible children in growth<br />
monitoring/promotion (usually presented for children
INTRODUCTION PART 1.<br />
• increased percent of children in growth promotion program<br />
gaining weight in past 3 months (by gender and age group, will depend<br />
upon the target group of the program).<br />
The choice of indicators for annual monitoring and reporting should<br />
be based upon a review of available sources of data and the information<br />
needs of the Cooperating Sponsor and USAID. Reporting the annual<br />
monitoring indicators is recommended rather than required as in the case<br />
for reporting on impact. The primary purpose of collecting and reporting<br />
the monitoring indicators is to improve program management but these<br />
indicators can also provide valuable insights into the interpretation of the<br />
anthropometric indicators of program impact. In addition, reporting the<br />
annual indicators may provide Cooperating Sponsors a further opportunity<br />
to demonstrate progress towards the achievement of results.<br />
While the focus of this guide is on the consistent collection and<br />
reporting of nutritional anthropometry indicators and annual<br />
monitoring indicators, suggestions are provided for additional<br />
information related to monitoring and evaluation. This information will<br />
help Cooperating Sponsors to track and improve child nutrition activities<br />
and performance. The focus is on anthropometric assessment of infants and<br />
young children. The guide is a programming tool and is not meant to<br />
substitute for adequate technical and academic training needed to conduct<br />
problem analysis, design programs and for implementation. Cooperating<br />
Sponsors are encouraged to seek technical expertise in nutritional<br />
assessment and related topics needed to ensure appropriate use<br />
anthropometric indicators.<br />
The assessment of children over 5 years of age, adolescents, adults and<br />
the elderly is not the primary focus of the guide. Appendices 4 and 5, however,<br />
provide information on the nutritional assessments of adults and adolescents.<br />
1.<br />
9
P ART<br />
Evaluation and Annual<br />
2.<strong>Anthropometric</strong><br />
Monitoring <strong>Indicators</strong><br />
2.<br />
<strong>2.1</strong>. <strong>Anthropometric</strong> <strong>Indicators</strong><br />
Changes in body dimensions reflect the<br />
overall health and welfare of individuals<br />
and populations. Anthropometry is used to<br />
assess and predict performance, health<br />
and survival of individuals and reflect the<br />
economic and social well being of populations.<br />
Anthropometry is a widely used,<br />
inexpensive and non-invasive measure of<br />
the general nutritional status of an<br />
individual or a population group. Recent<br />
studies have demonstrated the applications<br />
of anthropometry to include the prediction<br />
of who will benefit from interventions,<br />
identifying social and economic inequity<br />
and evaluating responses to interventions.<br />
For more information on the application of<br />
anthropometric data, refer to Appendix 2.<br />
Anthropometry can be used for various<br />
purposes, depending on the anthropometric<br />
indicators selected. For example,<br />
weight-for-height (wasting) is useful for<br />
screening children at risk and for measuring<br />
short-term changes in nutritional<br />
status. However, weight-for-height is not<br />
appropriate for evaluating changes in a<br />
population over longer time periods. A<br />
clear understanding of the different uses<br />
and interpretations of each anthropometric<br />
indicator will help to determine the<br />
most appropriate indicator(s) for program<br />
evaluation. For more detailed explanations<br />
of age and sex specific appropriate<br />
anthropometric uses, refer to Appendices<br />
4 and 5. Key terms are defined in the<br />
glossary.<br />
<strong>2.1</strong>.1.The Building Blocks of Anthropometry: Indices<br />
The four building blocks or measures used to undertake anthropometric assessment are:<br />
1 2 3 4<br />
AGE<br />
SEX<br />
LENGTH<br />
(or height)<br />
WEIGHT<br />
10
IMPACT INDICATORS FOR IMPROVED HOUSEHOLD NUTRITION PART 2.<br />
Each of these variables provides one piece<br />
of information about a person. When they<br />
are used together they can provide<br />
important information about a person’s<br />
nutritional status. The actual measurement<br />
of age, weight and height of children<br />
requires specific equipment and<br />
techniques which are described later.<br />
When two of these variables are used<br />
together they are called an index. Three<br />
indices are commonly used in assessing<br />
the nutritional status of children:<br />
Weight-for-age;<br />
Length-for-age or Height-for-age;<br />
• Weight-for-length or Weight-for-height.<br />
There are many other anthropometric<br />
measures including mid-upper-armcircumference<br />
(MUAC), sitting height to<br />
standing height ratio (Cormic Index),<br />
and many skinfold measures. This guide<br />
will concentrate on the measurements<br />
and interpretation of weight and height<br />
in children.<br />
<strong>2.1</strong>.2.What the Indices Reflect About the Nutritional Status of Infants and Children<br />
The advantages and disadvantages of the<br />
three indices and the information they<br />
can provide is summarized below:<br />
Weight-for-age: Low weight-for-age<br />
index identifies the condition of being<br />
underweight, for a specific age. The<br />
advantages of this index are that it may<br />
reflect both past (chronic) and/or present<br />
(acute) undernutrition (although it is<br />
unable to distinguish between the two).<br />
Height-for-age: This index is an<br />
indicator of past undernutrition or<br />
chronic malnutrition. It cannot measure<br />
short term changes in malnutrition. For<br />
children below 2 years of age, the term is<br />
length-for-age; above 2 years of age, the<br />
index is referred to as height-for-age.<br />
Deficits in length-for-age or height-forage<br />
are signs of stunting.<br />
Weight-for-height: This index helps to<br />
identify children suffering from current<br />
or acute undernutrition or wasting and is<br />
useful when exact ages are difficult to<br />
determine. Weight-for-length (in<br />
children under 2 years of age) or weightfor-height<br />
(in children over 2 years of age)<br />
is appropriate for examining short-term<br />
effects such as seasonal changes in food<br />
supply or short-term nutritional stress<br />
brought about by illness.<br />
The three indices are used to identify<br />
three nutritional conditions: underweight,<br />
stunting and wasting.<br />
Underweight: Underweight, based on<br />
weight-for-age, is a composite measure of<br />
stunting and wasting and is<br />
recommended as the indicator to assess<br />
changes in the magnitude of malnutrition<br />
over time.<br />
Stunting: Low length-for-age, stemming<br />
from a slowing in the growth of the fetus<br />
and the child and resulting in a failure to<br />
achieve expected length as compared to a<br />
healthy, well nourished child of the same<br />
age, is a sign of stunting. Stunting is an<br />
indicator of past growth failure. It is<br />
associated with a number of long-term<br />
factors including chronic insufficient<br />
protein and energy intake, frequent<br />
infection, sustained inappro-priate<br />
feeding practices and poverty. In<br />
children over 2 years of age, the effects of<br />
these long-term factors may not be<br />
reversible. For evaluation purposes, it is<br />
preferable to use children under 2 years<br />
of age because the prevalence of stunting<br />
in children of this age is likely to be more<br />
responsive to the impact of interventions<br />
than in older children. Data on<br />
prevalence of stunting in a community<br />
may be used in problem analysis in<br />
designing interventions. Information on<br />
stunting for individual children is useful<br />
clinically as an aid to diagnosis.<br />
Stunting, based on height-for-age can be<br />
used for evaluation purposes but is not<br />
recommended for monitoring as it does<br />
not change in the short term such as 6 -<br />
12 months.<br />
2.<br />
11
2.<br />
Wasting: Wasting is the result of a weight<br />
falling significantly below the weight<br />
expected of a child of the same length or<br />
height. Wasting indicates current or<br />
acute malnutrition resulting from failure<br />
to gain weight or actual weight loss.<br />
Causes include inadequate food intake,<br />
incorrect feeding practices, disease, and<br />
infection or, more frequently, a combination<br />
of these factors. Wasting in<br />
individual children and population groups<br />
can change rapidly and shows marked<br />
seasonal patterns associated with changes<br />
in food availability or disease prevalence<br />
to which it is very sensitive. Because of its<br />
response to short-term influences, wasting<br />
is not used to evaluate Title II programs<br />
but may be used for screening or targeting<br />
purposes in emergency settings and is<br />
sometimes used for annual reporting.<br />
Weight-for-height is not advised for<br />
evaluation of change in a population since<br />
it is highly susceptible to seasonality.<br />
• Edema Edema is the presence of<br />
excessive amounts of fluid in the<br />
intracellular tissue. Edema can be<br />
diagnosed by applying moderate thumb<br />
pressure to the back of the foot or ankle.<br />
The impression of the thumb will remain<br />
for some time when edema is present.<br />
Edema is diagnosed only if both feet show<br />
the impression for some time. As a<br />
clinical sign of severe malnutrition, the<br />
presence of edema should be recognized<br />
when using short term indicators such as<br />
wasting. The presence of edema in<br />
individuals should be recorded when<br />
using weight-for-height for surveillance or<br />
screening purposes. When a child has<br />
edema, it is automatically included with<br />
children counted as severely malnourished,<br />
independently of its wasting,<br />
stunting, or underweight status. This is<br />
due to the strong association between<br />
edema and mortality. Edema is a rare<br />
event and its diagnosis is used only for<br />
screening and surveillance and not for<br />
evaluation purposes.<br />
• Mid — Upper Arm Circumference<br />
(MUAC) MUAC is relatively easy to<br />
measure and a good predictor of immediate<br />
risk of death. It is used for rapid screening<br />
of acute malnutrition from the 6-59 month<br />
age range (MUAC overestimates rates of<br />
malnutrition in the 6-12 month age group).<br />
MUAC can be used for screening in<br />
emergency situations but is not typically<br />
used for evaluation purposes. (MSF, 1995)<br />
MUAC is recommended for assessing acute<br />
adult undernutrition and for estimating<br />
prevalence of undernutrition at the<br />
population level.<br />
2.2. Annual Monitoring <strong>Indicators</strong><br />
Well chosen and reported monitoring<br />
indicators will enhance program<br />
management and can provide valuable<br />
insights into trends of anthropometric<br />
indicators used for determining impact.<br />
Part 8 of this <strong>Guide</strong> describes how annual<br />
monitoring indicators that are based upon<br />
data from growth monitoring and<br />
promotion programs (GMP) may be<br />
collected and reported in a standard<br />
format. This is intended to make the<br />
indicators more useful for management of<br />
programs at all levels within countries,<br />
and also for reporting to USAID.<br />
The two recommended annual monitoring<br />
indicators serve several purposes.<br />
1. Percent of eligible children in Growth<br />
Monitoring and Promotion programs<br />
a. supports program management --<br />
providing information on coverage,<br />
targeting, and may provide a useful basis<br />
for supervision of field staff;<br />
b. provides information on context, or<br />
some explanation, in the reporting of<br />
anthropometric impact indicators; and<br />
c. provides an indication of patterns of, or<br />
trends in, service delivery and use and<br />
thus has potential to demonstrate<br />
successes of efforts to achieve specified<br />
project results.<br />
12
COLLECTING AND ANALYZING THE DATA PART 3.<br />
2. percent of children in Growth<br />
Monitoring and Promotion (GMP) programs<br />
gaining weight in past 3 months<br />
(by gender)<br />
a. As a management tool, this<br />
information is a trigger to increase growth<br />
promotion and health education<br />
counseling. The information can be a<br />
positive communication between the<br />
health worker and caregiver concerning<br />
the health of the child. This information is<br />
most effective when provided with other<br />
information such as food availability and<br />
presence or history of infection.<br />
b. As a surveillance tool, the indicator<br />
may be useful as a lagged indicator of a<br />
community facing severe food or healthrelated<br />
stress. The usefulness of this<br />
indicator for surveillance is reduced when<br />
small numbers are being monitored and<br />
aggregations over ages tend to even out .<br />
A major advantage for an organization in<br />
reporting on the two monitoring<br />
indicators is that it provides national level<br />
staff with a framework to think about,<br />
interpret, and act upon data that are<br />
currently being reported to them. A<br />
barrier to “institutionalizing” the reporting<br />
of monitoring data is that often no<br />
action is taken on information reported<br />
and sometimes no meaningful feedback is<br />
provided to the staff who collect and report<br />
them. Reporting on monitoring indicators<br />
at a national level will provide some<br />
evidence that GMP data have been<br />
collected and used as intended.<br />
Growth monitoring and promotion<br />
programs are key components of many<br />
food assisted health and nutrition<br />
activities of Title II programs. The<br />
development of the guidelines presented<br />
here was based upon four assumptions:<br />
a) growth monitoring without growth<br />
promotion will not benefit the health of<br />
participating children;<br />
b) it is not useful to report village-level<br />
activities of GMPs to regional and national<br />
levels unless some action is taken, or some<br />
decision is based upon the information<br />
reported;<br />
c) the reporting system will not be<br />
sustainable without some meaningful<br />
action or feedback; and<br />
d) continuing effort will be required to<br />
improve the quality of data reported from<br />
GMP activities, but reporting GMP data<br />
can be useful when it is interpreted within<br />
an appropriate context.<br />
2.<br />
13
P ART<br />
3.Collecting<br />
<strong>Anthropometric</strong> Data<br />
Through Surveys<br />
3.<br />
The type of anthropometric data collected<br />
will depend on the reason for the survey.<br />
When the survey results will be used for<br />
long-term planning the information<br />
needed might be different than information<br />
for program management. The<br />
evaluation of Title II programs is a<br />
situation in which long-term changes in<br />
stunting or undernutrition need to be<br />
reflected. Monitoring of growth promotion<br />
programs will require different types of<br />
information.<br />
The collection of anthropometric data may<br />
be the main purpose of a survey or it may be<br />
part of a larger more comprehensive survey<br />
such as the KPC (Knowledge, Practice,<br />
Coverage). Information on individuals and<br />
households should be collected to interpret<br />
anthropometric data. Deciding what<br />
information will be collected, how it will be<br />
collected and from whom it will be<br />
collected is all part of planning the survey.<br />
The steps that should be taken to conduct a<br />
survey are outlined below.<br />
3.1. Steps for Conducting a Survey<br />
The following checklist outlines the steps<br />
necessary for conducting a survey. All of<br />
these steps should be clearly thought out<br />
before the survey begins.<br />
• Define survey objectives.<br />
The first<br />
step is to determine the specific purpose of<br />
the survey. Make a detailed list of what is<br />
expected to be achieved and what<br />
information is needed.<br />
• Budget for the survey. Develop<br />
a<br />
detailed item-by-item budget for all the<br />
costs and expenses of the survey,<br />
including personnel, supplies, materials,<br />
transportation, accommodation and<br />
meals. Determine the costs associated<br />
with data entry, cleaning, analysis,<br />
reporting and testing of all steps to ensure<br />
smooth implementation.<br />
• Choose the survey design. Depending<br />
on the goal of the survey, the survey<br />
planning team should review different<br />
design possibilities such as a case-control<br />
or reflexive design before choosing the<br />
final design. Having a clear idea of the<br />
survey goals will help to determine which<br />
people or which groups of people to<br />
include in the survey and the best method<br />
for collecting the information.<br />
• Plan for personnel, facilities, and<br />
equipment. Conducting a survey within a<br />
limited time-frame (usually less than six<br />
months) requires early planning for<br />
materials and staff. During this stage the<br />
survey planning team decides how many<br />
field staff and how many office personnel<br />
they will need and how they will recruit<br />
them. Any advance work needed to find<br />
14
COLLECTING AND ANALYZING THE DATA PART 3.<br />
and hire staff is planned at this point.<br />
Other needs such as office space and<br />
equipment are also considered and<br />
planned. Specific equipment is needed to<br />
do anthropometric assessments as part of<br />
a survey and is discussed in Part 4.<br />
• Select the sample.<br />
Once the survey<br />
goals and methods of collecting the<br />
information have been decided, the groups<br />
and numbers of people to be interviewed<br />
are selected. A sample is a small part of<br />
the group being studied that has been<br />
chosen to represent the whole group.<br />
There are special considerations when<br />
choosing a sample for anthropometric<br />
assessment. Sampling is discussed in<br />
Appendix 3 and the reader is referred<br />
to the FANTA Sampling <strong>Guide</strong>.<br />
(www.fantaproject.org/publications)<br />
• Develop the questionnaire. The list of<br />
essential information needed to meet the<br />
survey objectives forms the basis of the<br />
survey questionnaire. A standard, printed<br />
questionnaire ensures that all the<br />
respondents are asked the same questions<br />
and enables the survey responses to be<br />
tabulated easily and quickly. The<br />
questionnaire may need to be translated<br />
into local languages. Translated<br />
questionnaires should be translated back<br />
to the original language by another<br />
translator and compared to the original<br />
questionnaire. Enumerators need to be<br />
trained in the appropriate use of the<br />
translation. See Figure 5.4 for a sample<br />
questionnaire.<br />
• Pre-test the questionnaire. Before the<br />
questionnaire is finalized it should be<br />
tested for content and length; the<br />
questions should gather the needed<br />
information and should be easily<br />
understood by both interviewers and<br />
respondents. In the pre-test a small<br />
number of interviews are conducted and<br />
the questionnaire is revised on the basis of<br />
these results and comments from the<br />
interviewers.<br />
• Train personnel. Training of field staff<br />
is a vital step in the survey process;<br />
accurate, meaningful information can be<br />
collected only if interviewers thoroughly<br />
understand all their field instructions and<br />
procedures. When all the field materials<br />
have been prepared and finalized, and the<br />
field staff has been hired, all interviewers<br />
and supervisors should be brought to a<br />
central location to be taught survey<br />
procedures, how to collect the data and<br />
how to use the questionnaire. When<br />
anthropometric assessment will be part of<br />
the survey, correct methods for taking<br />
measurements should also be part of the<br />
training schedule. If the actual survey is<br />
delayed for more than three weeks<br />
following training, it will be necessary to<br />
retrain personnel.<br />
• Standardize the anthropometric<br />
technique. The training of personnel on<br />
specific measurement and recording<br />
techniques should include not only<br />
theoretical explanations and demonstrations,<br />
but also provide an opportunity<br />
for participants to practice the measurement<br />
techniques, as well as reading and<br />
recording the results. Once all personnel<br />
have adequately practiced the measurement<br />
and recording techniques, and feel<br />
comfortable with their performance,<br />
standardization exercises should be<br />
carried out to ensure that all interviewers<br />
acquire the skills necessary to collect high<br />
quality data. Details of these exercises are<br />
presented in Appendix 6.<br />
• Interview. The success of a survey<br />
depends on the quality of the field<br />
procedures, supervision and interviewing.<br />
Interviewers should follow sampling and<br />
interviewing instructions precisely and<br />
accurately. They need to keep in touch<br />
with their field supervisor and bring any<br />
problems or difficulties to their attention.<br />
• Supervise the data collection. Once<br />
the interviewing begins, field supervisors<br />
should be present to assist interviewers<br />
with problems that may arise in finding<br />
the correct households, conducting the<br />
interviews or completing the work on<br />
time. Field supervisors, in addition to<br />
solving field problems, are responsible for<br />
distributing materials, reviewing and<br />
checking completed questionnaires and<br />
3.<br />
15
3.<br />
making progress reports to the central<br />
office. Detailed guidelines for supervisors<br />
are presented in Appendix 7.<br />
• Edit and code the interviews.<br />
Completed interviews should be reviewed<br />
to make sure all the questions have been<br />
asked and the answers have been<br />
recorded clearly. Someone from the<br />
survey planning team should check all<br />
numerical codes on the questionnaire and<br />
assign codes to any responses written in<br />
respondents’ own words. Some surveys<br />
directly enter data into the computer at the<br />
time of the measurement. This improves<br />
quality and speed but requires functioning<br />
equipment in often difficult conditions.<br />
• Tabulate the data.<br />
Whether the<br />
survey results are to be compiled by hand<br />
or by computer, the responses for each<br />
questionnaire will have to be assigned<br />
numerical codes. This process is usually<br />
simplified by including numerical codes<br />
for each of the response categories on to<br />
the printed questionnaire form. When the<br />
interviews are completed, these codes are<br />
then transferred by hand to tabulation<br />
sheets or the codes can be entered into a<br />
computer. Both of these methods allow<br />
the survey results to be read and<br />
interpreted by means of statistical tables<br />
and percentages. As field computers and<br />
satellite communication become more<br />
common, it will be possible to enter data<br />
directly by the interviewer with<br />
immediate feedback for possible errors in<br />
measurement and recording.<br />
• Analyze and report the survey results.<br />
On the basis of the tables prepared, the<br />
survey data are studied and interpreted<br />
and conclusions are drawn about the<br />
nutritional and socio-economic conditions<br />
of the households in the project area. The<br />
report on the survey contains the most<br />
important findings and conclusions,<br />
statistical tables and a description of the<br />
procedures used in conducting the survey.<br />
The survey results should be presented in<br />
a clear and straightforward manner.<br />
16
Weighing and<br />
Measuring Equipment<br />
4.<br />
P ART<br />
Equipment is required to do anthropometric<br />
assessment. The most common types of<br />
equipment used are scales and measuring<br />
boards. Sources for obtaining equipment<br />
and tips on what to look for in equipment<br />
are listed below. Whatever equipment is<br />
chosen, staff need training to ensure its<br />
proper use and care. For Title II<br />
Cooperating Sponsors, electronic weighing<br />
scales and locally adapted height measuring<br />
boards are recommended. Check with<br />
the local UNICEF office for their<br />
specifications and availability. UNICEF<br />
equipment specifications can be found at:<br />
www.supply.unicef.dk/catalogue/index.htm<br />
in the 03 Nutrition Section.<br />
4.1. Scales<br />
4.<br />
Scales used in the field should be portable,<br />
durable and capable of reading up to 25 kg<br />
for children and have 100 gram<br />
increments. There are several different<br />
attachments that can be used to help<br />
weigh children with spring scales. The<br />
size of the child will determine which<br />
attachment should be used. For weighing<br />
infants, a sling or basket is usually<br />
attached to the spring scale. For children,<br />
weighing trousers are used to suspend<br />
them. These are small pants with straps<br />
that the child steps into. The trousers are<br />
then hung from the scale by the straps.<br />
There are other alternatives than the<br />
trousers, but they can be difficult to use for<br />
infants and small children. For infants, a<br />
cloth folded to hang from the scale with<br />
the infant is preferred. For children who<br />
are old enough to grasp firmly onto<br />
something, a handle is sometimes<br />
attached to the scale and the child hangs<br />
from it by their hands until their weight is<br />
read. Whatever is used to suspend the<br />
child, the scale should be zeroed to ensure<br />
that the weight of the trousers, sling or<br />
basket is not added to the child’s weight.<br />
Oxfam <strong>Anthropometric</strong> Kit 1 (UNICEF<br />
Item No. 0000824) (Survey, screening,<br />
monitoring). The <strong>Anthropometric</strong> Kit<br />
contains equipment for measuring the<br />
weight and height of children to assess<br />
their nutritional status, along with other<br />
materials for nutritional surveys. The kit<br />
weighs 26 kgs and contains measuring<br />
and survey materials for two survey<br />
teams, or measuring equipment for 2<br />
feeding centers, and contains:<br />
Oxfam <strong>Anthropometric</strong> Kit 1<br />
Code Qty Description<br />
NK3 2 Backpacks - nylon<br />
NK6 2 Board - height/length & head block<br />
NK7 4 Book - exercise<br />
NK20 2 Calculator - solar and battery<br />
17
4.<br />
Code Qty Description<br />
NK26 4 Clipboard - A4, folding, spring clip<br />
NK29 1 Roll cord 10M x 6mm, polypropylene,<br />
endless fibres<br />
NK30 2 Counter - manual/hand held, metal<br />
NK31 4 Eraser<br />
NK32 2 Forms - evaluation<br />
NK33A 1 Notes on the revised Oxfam Feeding<br />
Kits - English<br />
NK33B 1 Notes on the revised Oxfam Feeding<br />
Kits - French<br />
NK34 40 Forms - survey<br />
NK39 2 Pads, paper, four colors of paper,100<br />
pages per pad, 90 x 90mm<br />
NK40 1 Pad, paper, graph,A4 in mm<br />
NK41 10 Pens - BIC ballpoint, black, medium<br />
NK42 4 Pen - large, indelible, black marker<br />
NK44 12 Pencil- HB<br />
NK45 4 Pencil sharpener - metal, single hole<br />
NK51 4 Ruler, 30cm, transparent, flat, plastic,<br />
shatterproof<br />
NK53 2 Scales, 25kg hanging scale, with bar, 3<br />
pants and sling, 100gm graduation<br />
NK55 1 Scissors - 17cm, blended<br />
NK63 4 Tables - random number A4, plasticized<br />
NK64 4 Tables - %Weight-for-height<br />
NCHS/CDC/WHO Sex combined,<br />
elasticized<br />
NK65 4 Tables,Weight-for-height Z-score<br />
NCHS/CDC/WHO Sex combined,<br />
plasticized<br />
NK66 2 Tape measure - fiberglass<br />
NK67 50 Tapes, MUAC: red (13.5cm)<br />
NK68 2 Rolls, tape - metric adhesive<br />
NK77 10 Wallets - A4 transparent plastic, open on<br />
2-sides<br />
Publications - Books<br />
NK80 2 Food Scarcity and Famine - Oxfam<br />
Practical <strong>Guide</strong> No. 7<br />
NK83 1 MSF Nutrition <strong>Guide</strong>lines - English<br />
NK84 1 MSF Nutrition <strong>Guide</strong>lines - French<br />
NK85A 1 Refugee Health Care - Oxfam Practical<br />
<strong>Guide</strong> No. 9 - English<br />
NK85B 1 Refugee Health Care - Oxfam Practical<br />
<strong>Guide</strong> No. 9 - French<br />
NK86 1 Selective Feeding Program - Oxfam<br />
Practical <strong>Guide</strong> 1 - English<br />
NK87 1 Selective Feeding Program - Oxfam<br />
Practical <strong>Guide</strong> 1 - French<br />
Unless weighing and measuring<br />
equipment is available locally, the<br />
<strong>Anthropometric</strong> Kit should be bought<br />
together with the Therapeutic Kit (Kit 4)<br />
or supplementary Kit (Kit 2 or Kit 3) for<br />
the initial establishment of feeding<br />
programs.<br />
Electronic Scales: UNICEF and others<br />
have found electronic scales to be durable<br />
and flexible especially given the option of<br />
weighing the mother with the child. The<br />
mother can be weighed with the child.<br />
The mother is then weighed without the<br />
child. The difference between the two<br />
measures is the child’s weight. This<br />
technique is useful in situations where the<br />
child struggles and use of a sling or<br />
weighing pants causes stress for the child.<br />
An additional advantage is that the weight<br />
of the mother is also available.<br />
Each member of the field staff should have<br />
their own scale if possible, otherwise it<br />
might take longer to do measurements and<br />
complete the survey. Several scales that are<br />
available for purchase are listed below:<br />
UNICEF Electronic Scale (Item No.<br />
0141015 Scale mother/child, electronic)<br />
The scale is manufactured by SECA and is<br />
a floor scale for weighing children as well<br />
as adults (capacity 150 kg). Weighing<br />
capacity from 1 kg to 150 kg in 100 g<br />
divisions, accuracy +/- 100 g. Weight of<br />
adult on scale can be stored (tared) in<br />
memory, allowing weight of baby or small<br />
child held by adult to show on scale<br />
indicator. Solar cell on-switch (light<br />
sensitivity 15 lux). Powered by long-life<br />
lithium battery, good for one million<br />
weighing cycles. Portable, weight 4 kg.<br />
Instructions in English, French and Spanish.<br />
The major advantage of this scale is the<br />
micro-computer chip so that it can adjust<br />
to zero and weigh people quickly and<br />
accurately. The child may be weighed<br />
directly. If a child is frightened, the<br />
mother can first be weighed alone and<br />
then weighed while holding the child in<br />
her arms, and the scale will automatically<br />
compute the child’s weight by subtraction.<br />
Recent experience in surveys suggests that<br />
the scale is appropriate for Cooperating<br />
18
WEIGHING AND MEASURING EQUIPMENT PART 4.<br />
Sponsor use although there have been<br />
some difficulties with heat adversely<br />
affecting the scale. The price of this scale<br />
is US$90. For more information contact:<br />
UNICEF Supply Division, Customer<br />
Services and Support Center, UNICEF<br />
Plads, Freeport, DK-2000 Copenhagen,<br />
Denmark; Email:supply@unicef.dk;<br />
Website: www.supply.unicef.dk. or contact<br />
UNICEF field office: www.unicef.org/<br />
uwwide/fo.htm.<br />
UNICEF Hanging Scale (Item No.<br />
0145555 Scale, infant, spring, 25kgx100g<br />
with No. 0189000 Weighing trousers/pack<br />
of 5) This is a Salter type spring scale with<br />
a capacity of 25 kg and 100 gram<br />
increments. Using this scale requires that<br />
the child be dressed in a set of plastic or<br />
nylon trousers before being weighed. The<br />
interviewers will need several pairs of<br />
these special trousers if they are going to<br />
use hanging scales. A hook for hanging<br />
the scale from a door or a ceiling beam<br />
may also be necessary. The scale should<br />
be checked periodically with standard 5 or<br />
10 kg weights. Beam-and-spring or dial<br />
type scale, with two suspension hooks.<br />
With adjustment screw on top. Provided<br />
WITHOUT weighing trousers. Weighing<br />
trousers must be ordered separately, in the<br />
proportion of 1 scale per 1 pack of 5<br />
trousers, item no. S0189000, in pack of 5.<br />
The scale weighs about 1 kg. For weight<br />
monitoring. Practical to use, easy to<br />
transport. Suspend the scale from a solid<br />
support. The price of this scale is about<br />
US$30. For more information contact:<br />
UNICEF Supply Division, Customer<br />
Services and Support Center, UNICEF<br />
Plads, Freeport, DK-2000 Copenhagen,<br />
Denmark;<br />
Email:supply@unicef.dk;<br />
Website: www.supply.unicef.dk. or contact<br />
UNICEF field office: www.unicef.org/<br />
uwwide/fo.htm.<br />
TALC Weighing Scale The TALC scale<br />
can be used like any other hanging scale,<br />
with the advantage that a growth chart can<br />
be put in it, and the child’s weight is<br />
marked directly from the pointer on the<br />
spring. The TALC scale can be made<br />
locally from a TALC starter kit. This<br />
includes three springs, instructions and<br />
three specimen growth charts. The scale<br />
can also be made from local materials with<br />
the purchase of the TALC scale spring and<br />
instructions. A TALC sample pack includes<br />
spring, hook, nylon cord, wood pieces,<br />
screws and instructions. These can be<br />
ordered from: Teaching Aids at Low Cost,<br />
P.O. Box 49, St. Albans, Herts. AL1 4AX,<br />
England. Payments from overseas must be<br />
made by: (1) International Money Order,<br />
National Giro or U.K. Postal Order; (2)<br />
Sterling check drawn on a U.K. bank; (3)<br />
Eurocheque made out in Sterling; (4) US<br />
dollar check drawn on US bank using the<br />
correct rate of exchange; or (5) UNESCO<br />
Coupons.<br />
Suspended Infant Weighing Pack -<br />
(Model No. PE-HS-25) This scale was<br />
developed in conjunction with the US<br />
Centers for Disease Control. It is a dial<br />
scale made of durable plastic with an easy<br />
to read face. It is capable of weighing up<br />
to 25 kg in 100 gram increments. The<br />
pack includes a sling, weighing trousers,<br />
a detachable handle for weighing larger<br />
children and a vinyl shoulder bag. The<br />
price is US$150. Additional slings,<br />
trousers and handles are available for<br />
US$12. For information on this pack<br />
contact: Perspective Enterprises, 7829<br />
Sprinkle Road, Kalamazoo, MI 49001,<br />
USA; Telephone: 800-323-7452; Fax: 616-<br />
327-0837.<br />
Chasmors Ltd. Model MP25 This is a<br />
lightweight scale with a stainless steel<br />
case and an unbreakable plastic cover. It<br />
is easy to read and can weigh up to 25kg in<br />
100 gram gradations. The scale comes<br />
with two weighing trousers and one sling<br />
(for newborns). The price is US$75.<br />
Chasmors also carries a variety of arm<br />
circumference measuring tapes ranging<br />
from $US10 to US$30. For more<br />
information on their products contact:<br />
CMS Weighing Equipment, Ltd., 18<br />
Camden High School, London NW1 OJH,<br />
U.K.; Telephone: 01-387-2060 (international)<br />
+44 171 387 2060.<br />
4.<br />
19
Salter Model 235-6S This is a lightweight<br />
scale in a durable non-rust metal case with<br />
an unbreakable plastic face. Its capacity is<br />
25 kgs with 100g increments. The price is<br />
US$77. For more information contact:<br />
Salter Industrial <strong>Measurement</strong>, Ltd.,<br />
George Street, West Bromwich,<br />
West Midlands, B70 6AD, U.K.<br />
Telephone: +44 121 553 1855.<br />
In the US - Salter Weighing Products 3620<br />
Central Avenue, N.E., MN 55418.<br />
Telephone: 1-800-637-0529.<br />
Email: rdhal@salter<br />
weighing.com. www.salterbrecknell.com.<br />
Medecins sans Frontieres Nutrition<br />
Survey Kit (MSF code: KMEDKNUT1--)<br />
This kit includes standard equipment for<br />
surveys. It comes in one box and weighs<br />
21 kgs. The price is approximately<br />
US$600. The kit can be bought at either<br />
OXFAM or TRANSFER (formerly associated<br />
with MSF-Belgium). TRANSFER can<br />
be contacted by email at zoom@msfbrussels.ccmail.compuserve.com<br />
(state that<br />
the message is for TRANSFER).<br />
4.<br />
4.2. Length/Height Boards<br />
Length/height boards should be designed<br />
to measure children under 2 years of age<br />
lying down (recumbent), and older<br />
children standing up. The board should<br />
measure up to 120 cm (1.2 meters) for<br />
children and be readable to 0.1 of a<br />
centimeter. A measuring board should be<br />
lightweight, durable and have few moving<br />
parts. The metal part on the boards<br />
absorbs heat easily so care must be taken<br />
in field conditions. Another concern with<br />
length/height boards is that they resemble<br />
coffins and this can be disconcerting to the<br />
caregiver. Check with the survey<br />
personnel and adjust the design. Provide<br />
adequate training both in using the<br />
equipment and in providing appropriate<br />
information for the caregiver. Ideally,<br />
each field staff should have their own<br />
board. This makes the survey process<br />
more efficient than when boards have to<br />
be shared. Several types of length and<br />
height boards are available and are listed<br />
below. The Dutch infant-child-adult<br />
measuring board is recommended but<br />
local adaptations are possible to reduce<br />
the cost.<br />
UNICEF Model (Item No. 0114500 Infant<br />
length/height measuring board) An<br />
infant/child height measuring board<br />
measuring both recumbent length and<br />
standing height. This board is made of<br />
wood, smooth-finish, all parts glued and<br />
screwed; height is 130 cm (collapses to 75<br />
cm); and width 30 cm. Supplied with a<br />
shoulder strap. Illustrated instructions for<br />
assembly and use are included, also<br />
guidelines and plans for local<br />
construction. Estimated weight: 10 kg.<br />
The price of the board is about US$350.<br />
For more information contact:<br />
UNICEF Supply Division, Customer<br />
Services and Support Center,<br />
UNICEF Plads, Freeport,<br />
DK-2000 Copenhagen, Denmark;<br />
Email:supply@unicef.dk;<br />
Website: www.supply.unicef.dk. or contact<br />
UNICEF field office: www.unicef.org/<br />
uwwide/fo.htm.<br />
Infant/Child Height/Length Measuring<br />
Board This board has 130 cm capacity<br />
(collapses to 75cm) and has 0.1 cm<br />
increments. The board weighs 6 kg, is<br />
portable, water-resistant and has an<br />
adjustable, removable nylon shoulder<br />
strap. It is easy to assemble and dismantle,<br />
with the sliding head-footpiece stored in the<br />
base of the board for transport or storage.<br />
This board has a lifetime warranty and<br />
costs $285. For more information contact:<br />
Shorr Productions,<br />
17802 Shotley Bridge Place,<br />
Olney, Maryland 20832, USA;<br />
Telephone: 301-774-9006<br />
(toll free 877-900-9007);<br />
Fax: 301-774-0436;<br />
Email: ijshorr@shorrproductions.com.<br />
Infant Recumbent Length Board (Model<br />
No. PE-RILB-122-PC) This board is<br />
20
WEIGHING AND MEASURING EQUIPMENT PART 4.<br />
lightweight, durable and capable of<br />
measuring recumbent length up to 100<br />
cm. The price of this board is US$215.<br />
For more information contact:<br />
Perspective Enterprises,<br />
7829 Sprinkle Road, Kalamazoo,<br />
MI 49001, USA;<br />
Telephone: 800-323-7452;<br />
Fax: 616-327-0837.<br />
Recumbent Length Measuring Board<br />
This board has 106 cm capacity in 0.1<br />
cm increments and costs $185. For<br />
more information contact:<br />
Shorr Productions,<br />
17802 Shotley Bridge Place,<br />
Olney, Maryland 20832, USA;<br />
Telephone: 301-774-9006<br />
(toll free 877-900-9007);<br />
Fax: 301-774-0436;<br />
Email: ijshorr@shorrproductions.com.<br />
Infant Measuring Board (Model No. PE-<br />
RILB-LTWT) This measuring board is<br />
designed to be especially lightweight and<br />
extremely portable. It can measure up to<br />
100 cm, is collapsible and comes with a<br />
vinyl plastic tote bag. The price of this<br />
board is US$250. For more information<br />
contact:<br />
Perspective Enterprises,<br />
7829 Sprinkle Road, Kalamazoo,<br />
MI 49001, USA;<br />
Telephone: 800-323-7452;<br />
Fax: 616-327-0837.<br />
Portable Adult/Infant Measuring Board<br />
(Model No. PE-AIM-101) This is an<br />
adjustable measuring board which has<br />
been extensively used by WHO and CDC,<br />
with a vertical aluminum post. It can<br />
measure the height of adults and then by<br />
taking off its vertical extension it can be<br />
adapted to measuring infants. When<br />
collapsed it is approximately the length of<br />
two briefcases laid end to end. It also has<br />
an optional vinyl carrying case. The price<br />
of this board is US$385. For more<br />
information contact:<br />
Perspective Enterprises,<br />
7829 Sprinkle Road, Kalamazoo,<br />
MI 49001, USA.;<br />
Telephone: 800-323-7452;<br />
Fax: 616-327-0837.<br />
Infant/Child/Adult Height/Length<br />
Measuring Board This measuring board<br />
has a 200 cm capacity (collapses to 85 cm)<br />
and has 0.1 cm increments. The board<br />
weighs 6 kg, is portable, water-resistant<br />
and has an adjustable, removable nylon<br />
shoulder strap. It is easy to assemble and<br />
dismantle and costs $285. For more<br />
information contact:<br />
Shorr Productions,<br />
17802 Shotley Bridge Place,<br />
Olney, Maryland 20832, USA;<br />
Telephone: 301-774-9006<br />
(toll free 877-900-9007);<br />
Fax: 301-774-0436;<br />
Email: ijshorr@shorrproductions.com.<br />
Adult Measuring Device (Microtoise)<br />
(UNICEF No. 0114400 Height measuring<br />
instrument (0-2 m)) This lightweight<br />
portable tape is wall mounted and fits<br />
easily into the package needed for field<br />
measurements. Made of plastic, the<br />
Microtoise measures up to 2 meters and is<br />
available at a price of approximately<br />
$US20. For more information contact:<br />
UNICEF Supply Division, Customer<br />
Services and Support Center,<br />
UNICEF Plads, Freeport,<br />
DK-2000 Copenhagen, Denmark;<br />
Email:supply@unicef.dk;<br />
Website: www.supply.unicef.dk. or contact<br />
UNICEF field office: www.unicef.org/<br />
uwwide/fo.htm.<br />
Adult Measuring Device (Harpenden<br />
Pocket Stadiometer) An inexpensive height<br />
measuring device useful for children over<br />
24 months and adults (range 0-2000mm).<br />
The price is approximately $US100.<br />
CMS Weighing Equipment, Ltd.,<br />
18 Camden High School,<br />
London NW1 OJH, UK;<br />
Telephone: 01-387-2060 +44 171 387 2060.<br />
Local Construction Various plans exist<br />
for the local construction of foldable<br />
height/length boards and they can be<br />
made for around $US20. It is important<br />
that the materials are durable, lightweight<br />
and the wood should be well seasoned to<br />
guard against warping. Sealing the wood<br />
with water repellant and ensuring the<br />
measuring tape is protected from wear<br />
4.<br />
21
will improve the durability of the board.<br />
The tape measure should be durable with<br />
0.1 cm increments and the numbers of the<br />
tape measure must be next to the markings<br />
on the board when the measure is glued to<br />
the side of the board. The boards should<br />
be long enough to measure children up to<br />
5 years and a “correction” factor is needed<br />
to convert recumbent length to standing<br />
height for children over 24 months in<br />
order to use the WHO/NCHS growth<br />
reference standards. Designs can be found<br />
in Annex 4 of the FAO field manual.<br />
Blueprints for the construction of portable<br />
measuring boards are available from the<br />
Nutrition Division of Cornell University as<br />
well as from the Center for Health<br />
Promotion and Education:<br />
Centers for Disease Control and Prevention,<br />
1600 Clifton Road, N.E., Atlanta,<br />
GA 30333,<br />
USA.<br />
4.3. Mid-Upper Arm Circumference Measure<br />
MUAC Tape (UNICEF Item No. 145600<br />
Arm circumference insertion tape/pack of<br />
50) Arm circumference insertion tape: to<br />
measure mid-upper arm circumference of<br />
children, up to 25 cm. Color-coded in<br />
red/yellow/green, non-tear, stretchresistant<br />
plasticized paper. Supplied in<br />
pack of tapes together with written and<br />
pictorial instructions for use. Refer to<br />
UNICEF's Supply Division in Copenhagen<br />
through any UNICEF field office. For more<br />
information contact:<br />
UNICEF Supply Division, Customer<br />
Services and Support Center,<br />
UNICEF Plads, Freeport,<br />
DK-2000 Copenhagen, Denmark;<br />
Email:supply@unicef.dk;<br />
Website: www.supply.unicef.dk.<br />
or contact UNICEF field office:<br />
www.unicef.org/uwwide/fo.htm.<br />
4.<br />
22
Taking <strong>Measurement</strong>s<br />
5.<br />
P ART<br />
Accurate anthropometric measurement is a<br />
skill requiring specific training. A number<br />
of tools are available and additional<br />
references and sources are provided in<br />
Appendix 6. Training requires step-by-step<br />
procedures to follow when taking<br />
measurements. Standardizing methods<br />
helps ensure that the measurements will be<br />
correct and makes comparisons possible.<br />
Comparisons may be done between data<br />
collected from different areas of a country,<br />
between different surveys or between<br />
measurements and the reference standards.<br />
None of these comparisons will be possible<br />
without a standard method for taking<br />
measurements. This section will cover the<br />
necessary field equipment and methods for<br />
taking measurements.<br />
5.1. Interviewer field materials<br />
The checklist below includes the equipment<br />
and materials interviewers should have with<br />
them in the field. All of these items may not<br />
be necessary for every survey.<br />
Equipment bag<br />
• Map of the area<br />
Log book<br />
• • Weighing scale<br />
Scale hooks<br />
•<br />
List of assigned households and their<br />
addresses (or location)<br />
Pre-numbered questionnaires for<br />
assigned households<br />
Spare questionnaires<br />
Waterproof envelopes for blank and<br />
completed questionnaires<br />
•<br />
Weighing pants or hanging swing<br />
Storage bag for pants<br />
Piece of rope for scales<br />
Storage box for scales<br />
Height/length measuring board<br />
Sliding head/foot pieces<br />
Clipboard<br />
Stapler and box of staples<br />
Pencils and pencil sharpener<br />
Eraser<br />
• Pens<br />
Spare paper<br />
5.<br />
23
5.<br />
5.2. Procedures Before Measuring<br />
There are a few preparatory procedures<br />
and decisions that should be addressed<br />
prior to obtaining measurements.<br />
<strong>Guide</strong>lines to make the field experience<br />
easier are:<br />
• Initial preparation. Ensure that the<br />
mother or caretaker understands what is<br />
happening to the child. The measurement<br />
of weight and length can be traumatic.<br />
Participants need to be comfortable with<br />
the process. The equipment should be<br />
cool, clean and safely secured. Work out<br />
of direct sunlight since it can interfere<br />
with reading scales and other equipment<br />
and it is more comfortable for the<br />
measurer and child.<br />
• Two trained people required.<br />
When possible, two trained people should<br />
measure a child’s height and length. The<br />
measurer holds the child and takes the<br />
measurements. The assistant helps hold<br />
the child and records the measurements<br />
on the questionnaire. If only one trained<br />
person is available to take the<br />
measurements, then the child’s mother<br />
can help. The measurer would also<br />
record the measurements on the<br />
questionnaire.<br />
• Measuring board and scale<br />
placement. There will usually be several<br />
choices on where to place the measuring<br />
board or scale, but the choice should be<br />
made carefully. Be sure that you have a<br />
sturdy, flat surface for measuring boards,<br />
a strong place to hang scales from and<br />
adequate light so the measurements can<br />
be read with precision.<br />
• When to weigh and measure.<br />
Weighing and measuring should not be<br />
the first thing you do when you start an<br />
interview. It is better to begin with<br />
questions that need to be answered. This<br />
helps make the mother and child feel<br />
more comfortable before the measurements<br />
begin.<br />
• Weigh and measure one child at a<br />
time. You should complete the questions<br />
and measurements for one child at a time.<br />
This avoids potential problems with mixups<br />
that might occur if you have several<br />
children to measure.<br />
• Control the child.<br />
When you are<br />
taking weight and length/height<br />
measurements the child needs to be as<br />
calm as possible. A child who is excited<br />
or scared can make it difficult to get an<br />
accurate measurement.<br />
• Recording measurements. All<br />
measurements should be recorded in<br />
pencil. If a mistake is made when recording<br />
a measurement, it can be corrected.<br />
5.3. How to Measure Age, Height, Length,Weight and MUAC<br />
The following suggestions are adapted<br />
from How to Weigh and Measure Children:<br />
Assessing the Nutritional Status of Young<br />
Children in Household Surveys, UN<br />
Department of Technical Cooperation for<br />
Development and Statistical Office, 1986.<br />
5.3.1 Age<br />
The child’s accurate age is required for<br />
sampling, deciding on whether the child is<br />
measured standing or reclining for height<br />
or length, and for converting height and<br />
weight into the standard indices. At the<br />
time of measurement, an age estimate is<br />
needed for decisions on sampling and for<br />
the position on the measuring board. It is<br />
recommended the enumerators use simple<br />
methods to approximate the age and that<br />
the data analyst calculates the age using a<br />
computer program which will require the<br />
date of birth and date of measurement.<br />
To complete the determination, the<br />
enumerator needs to examine documentary<br />
evidence of the birth date (such as<br />
birth, baptismal certificate, clinic care or<br />
horoscope). Cross checking is necessary<br />
even if the mother knows the birth date or<br />
age of the child as errors in recall are<br />
common. Where there is a general<br />
registration of births and where ages are<br />
24
TAKING MEASUREMENTS PART 5.<br />
generally known, the recording of age is a<br />
straightforward procedure, with age<br />
measured to the nearest month or year as<br />
the case may be. For example, an infant<br />
whose date of birth is 13 July, 1996 could<br />
be recorded as being 6 months if seen<br />
between 13 December, 1996 and 12<br />
January, 1997 (both dates inclusive).<br />
Similarly, a child born on 13 July, 1995<br />
could be recorded as 6 years old if seen<br />
between 13 July 2001 and 12 July, 2002<br />
(both dates inclusive). If dates cannot be<br />
recalled, use of a local calendar will assist<br />
mothers in recalling the date of birth.<br />
Construction of the local calendar should<br />
be done prior to the survey and tested<br />
using the enumerators.<br />
5.<br />
25
5.3.2. Height for children 24 months and<br />
older (Figure 5.1)<br />
1. Measurer or assistant: Place the<br />
measuring board on a hard flat surface<br />
against a wall, table, tree, staircase, etc.<br />
Make sure the board is not moving.<br />
2. Measurer or assistant: Ask the<br />
mother to remove the child’s shoes and<br />
unbraid any hair that would interfere<br />
with the height measurement. Ask her to<br />
walk the child to the board and to kneel in<br />
front of the child. If a Microtoise measure<br />
is used, stand the child vertically in the<br />
middle of the platform.<br />
3. Assistant: Place the questionnaire and<br />
pencil on the ground (Arrow 1). Kneel<br />
with both knees on the right side of the<br />
child (Arrow 2).<br />
7. Measurer and assistant: Check the<br />
child’s position (Arrows 1-15). Repeat any<br />
steps as necessary.<br />
8. Measurer: When the child’s position<br />
is correct, read and call out the<br />
measurement to the nearest 0.1 cm.<br />
Remove the headpiece from the child’s<br />
head and your left hand from the child’s<br />
chin.<br />
9. Assistant: Immediately record the<br />
measurement and show it to the<br />
measurer.<br />
10. Measurer: Check the recorded<br />
measurement on the questionnaire for<br />
accuracy and legibility. Instruct the<br />
assistant to erase and correct any errors.<br />
4. Measurer: Kneel on your right knee<br />
on the child’s left side (Arrow 3). This will<br />
give you maximum mobility.<br />
5.<br />
5. Assistant: Place the child’s feet flat and<br />
together in the center of and against the<br />
back and base of the board/wall. Place your<br />
right hand just above the child’s ankles on<br />
the shins (Arrow 4), your left hand on the<br />
child’s knees (Arrow 5) and push against<br />
the board/wall. Make sure the child’s legs<br />
are straight and the heels and calves are<br />
against the board/wall (Arrows 6 and 7).<br />
Tell the measurer when you have<br />
completed positioning the feet and legs.<br />
6. Measurer: Tell the child to look<br />
straight ahead at the mother who should<br />
stand in front of the child. Make sure the<br />
child’s line of sight is level with the<br />
ground (Arrow 8). Place your open left<br />
hand under the child’s chin. Gradually<br />
close your hand (Arrow 9). Do not cover<br />
the child’s mouth or ears. Make sure the<br />
shoulders are level (Arrow 10), the hands<br />
are at the child’s side (Arrow 11), and the<br />
head, shoulder blades and buttocks are<br />
against the board/wall (Arrows 12, 13,<br />
and 14). With your right hand, lower the<br />
headpiece on top of the child’s head.<br />
Make sure you push through the child’s<br />
hair (Arrow 15).<br />
26
TAKING MEASUREMENTS PART 5.<br />
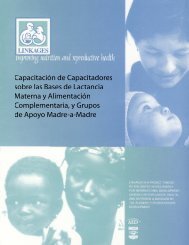
Figure 5.1. Child Height <strong>Measurement</strong> - Height for Children 24 Months and Older<br />
Headpiece firmly on head<br />
15<br />
Measurer on knees<br />
3<br />
Hand on chin<br />
Shoulders level<br />
Child's hands<br />
and arms at side<br />
9<br />
10<br />
11<br />
Left hand on<br />
knees; knees<br />
together<br />
against board<br />
5<br />
2<br />
4<br />
Right hand on shins;<br />
heels against back and<br />
base of board<br />
5.<br />
Assistant on knees<br />
12<br />
13<br />
8<br />
Line<br />
of sight<br />
1<br />
Questionaire and pencil on<br />
clipboard on floor or ground<br />
14<br />
7<br />
6<br />
Source: How to Weigh and Measure Children: Assessing the Nutritional Status of Young Children, UN 1986.<br />
27
5.3.3. Length for infants and children<br />
0-23 months (Figure 5.2)<br />
1. Measurer or assistant: Place the<br />
measuring board on a hard flat surface,<br />
i.e., ground, floor, or steady table.<br />
2. Assistant: Place the questionnaire and<br />
pencil on the ground, floor, or table<br />
(Arrow 1). Kneel with both knees behind<br />
the base of the board if it is on the ground<br />
or floor (Arrow 2).<br />
3. Measurer: Kneel on the right side of<br />
the child so that you can hold the foot<br />
piece with your right hand (Arrow 3).<br />
9. Measurer: When the child’s position<br />
is correct, read and call out the<br />
measurement to the nearest 0.1 cm.<br />
Remove the foot piece and release your left<br />
hand from the child’s shins or knees.<br />
10. Assistant: Immediately release the<br />
child’s head, record the measurement, and<br />
show it to the measurer.<br />
11. Measurer: Check the recorded<br />
measurement on the questionnaire for<br />
accuracy and legibility. Instruct the<br />
assistant to erase and correct any errors.<br />
4. Measurer and assistant: With the<br />
mother’s help, lay the child on the board<br />
by supporting the back of the child’s head<br />
with one hand and the trunk of the body<br />
with the other hand. Gradually lower the<br />
child onto the board.<br />
5. Measurer or assistant: Ask the<br />
mother to kneel close on the opposite side<br />
of the board facing the measurer as this<br />
will help to keep the child calm.<br />
5.<br />
6. Assistant: Cup your hands over the<br />
child’s ears (Arrow 4). With your arms<br />
comfortably straight (Arrow 5), place the<br />
child’s head against the base of the board<br />
so that the child is looking straight up.<br />
The child’s line of sight should be<br />
perpendicular to the ground (Arrow 6).<br />
Your head should be straight over the<br />
child’s head. Look directly into the child’s<br />
eyes.<br />
7. Measurer: Make sure the child is<br />
lying flat and in the center of the board<br />
(Arrows 7). Place your left hand on the<br />
child’s shins (above the ankles) or on the<br />
knees (Arrow 8). Press them firmly<br />
against the board. With your right hand,<br />
place the foot piece firmly against the<br />
child’s heels (Arrow 9).<br />
8. Measurer and assistant: Check the<br />
child’s position (Arrows 1-9). Repeat any<br />
steps as necessary.<br />
28
TAKING MEASUREMENTS PART 5.<br />
Figure 5.2. Child length measurement - length for infants andchildren 0-23 months<br />
Measurer on knees<br />
3<br />
Assistant on knees<br />
2<br />
Arms comfortably straight<br />
5<br />
8<br />
Hand on knees or<br />
shins; legs straight<br />
9<br />
Child's feet flat<br />
against footpiece<br />
7<br />
Child flat on board<br />
4<br />
Hands cupped over ears;<br />
head against base of board<br />
1<br />
5.<br />
Questionaire and pencil on<br />
clipboard on floor or ground<br />
Line of sight perpendicular to base of board<br />
6<br />
90 o<br />
Source: How to Weigh and Measure Children: Assessing the Nutritional Status of Young Children, UN 1986.<br />
29
5.3.4. Weight Using Salter-like Hanging<br />
Scale (Figure 5.3)<br />
1. Measurer or assistant: Hang the<br />
scale from a secure place like the ceiling<br />
beam. You may need a piece of rope to<br />
hang the scale at eye level. Ask the mother<br />
to undress the child as much as possible.<br />
STRAP OF THE WEIGHING PANTS.<br />
Release the strap from the hook of the<br />
scale.<br />
10. Measurer: Check the recorded<br />
measurement on the questionnaire for<br />
accuracy and legibility. Instruct the<br />
assistant to erase and correct any errors.<br />
2. Measurer: Attach a pair of the empty<br />
weighing pants to the hook of the scale<br />
and adjust the scale to zero, then remove<br />
from the scale.<br />
3. Measurer: Have the mother hold the<br />
child. Put your arms through the leg holes<br />
of the pants (Arrow 1). Grasp the child’s<br />
feet and pull the legs through the leg holes<br />
(Arrow 2). Make certain the strap of the<br />
pants is in front of the child.<br />
4. Measurer: Attach the strap of the<br />
pants to the hook of the scale. DO NOT<br />
CARRY THE CHILD BY THE STRAP<br />
ONLY. Gently lower the child and allow<br />
the child to hang freely (Arrow 3).<br />
5. Assistant: Stand behind and to one<br />
side of the measurer ready to record the<br />
measurement. Have the questionnaire<br />
ready (Arrow 4).<br />
5.<br />
6. Measurer and assistant: Check the<br />
child’s position. Make sure the child is<br />
hanging freely and not touching anything.<br />
Repeat any steps as necessary.<br />
7. Measurer: Hold the scale and read the<br />
weight to the nearest 0.1 kg. (Arrow 5).<br />
Call out the measurement when the child<br />
is still and the scale needle is stationary.<br />
Even children who are very active, which<br />
causes the needle to wobble greatly, will<br />
become still long enough to take a<br />
reading. WAIT FOR THE NEEDLE TO<br />
STOP MOVING.<br />
8. Assistant: Immediately record the<br />
measurement and show it to the<br />
measurer.<br />
9. Measurer: As the assistant records the<br />
measurement, gently lift the child by the<br />
body. DO NOT LIFT THE CHILD BY THE<br />
30
TAKING MEASUREMENTS PART 5.<br />
Figure 5.3. Child Weight<br />
Put hands through<br />
legholes<br />
1<br />
Grasp feet<br />
2<br />
Measurer reads scale at eye level<br />
5<br />
Assistant with<br />
questionaire<br />
4<br />
5.<br />
3 Child hangs<br />
freely<br />
Source: How to Weigh and Measure Children: Assessing the Nutritional Status of Young Children, UN 1986.<br />
31
5.3.4. Child Weight Using UNICEF<br />
UNISCALE (Figure 5.4)<br />
The UNICEF electronic scale requires the<br />
mother and child to be weighed<br />
simultaneously. Minimize the clothing on<br />
the child. Ensure the scale is not overheated<br />
in the sun and is on an even<br />
surface enabling the reading to be clear.<br />
Ask the mother to stand on the scale.<br />
Record the weight and include the reading<br />
with one decimal point (e.g. 65.5 kgs).<br />
Pass the child to a person nearby. Record<br />
the second reading with just the mother<br />
(e.g. 58.3 kgs). The difference (e.g. 7.2 kgs)<br />
is the weight of the child. Refer to the<br />
UNICEF document “How to Use the<br />
UNISCALE” (June, 2000) prepared by the<br />
Nutrition Section<br />
Program Division/UNICEF New York.<br />
Contact:<br />
Esther Liestyowati, Nutrition Section,<br />
UNICEF New York,<br />
fax: 212.824.6465,<br />
e-mail: eliestyowati@unicef.org<br />
5.<br />
32
TAKING MEASUREMENTS PART 5.<br />
Figure 5.4. Child Weight <strong>Measurement</strong><br />
5.<br />
Source: "How to use the UNISCALE" UNICEF, 2000<br />
33
5.3.5. Child Mid-Upper Arm Circumference<br />
(MUAC) Procedure (Figure 5.5)<br />
1. Measurer: Keep your work at eye level.<br />
Sit down when possible. Very young<br />
children can be held by their mother<br />
during this procedure. Ask the mother to<br />
remove clothing that may cover the child’s<br />
left arm.<br />
2. Measurer: Calculate the midpoint of<br />
the child’s left upper arm by first locating<br />
the tip of the child’s shoulder (Arrows 1<br />
and 2) with your finger tips. Bend the<br />
child’s elbow to make a right angle (Arrow<br />
3). Place the tape at zero, which is<br />
indicated by two arrows, on the tip of the<br />
shoulder (Arrow 4) and pull the tape<br />
straight down past the tip of the elbow<br />
(Arrow 5). Read the number at the tip of<br />
the elbow to the nearest centimeter.<br />
Divide this number by two to estimate the<br />
midpoint. As an alternative, bend the tape<br />
up to the middle length to estimate the<br />
midpoint. A piece of string can also be<br />
used for this purpose. Either you or an<br />
assistant can mark the midpoint with a<br />
pen on the arm (Arrow 6).<br />
7. Assistant: Immediately record the<br />
measurement on the questionnaire and<br />
show it to the measurer.<br />
8. Measurer: While the assistant records<br />
the measurement, loosen the tape on the<br />
child’s arm.<br />
9. Measurer: Check the recorded<br />
measurement on the questionnaire for<br />
accuracy and legibility. Instruct the<br />
assistant to erase and correct any errors.<br />
10. Measurer: Remove the tape from the<br />
child’s arm.<br />
5.<br />
3. Measurer: Straighten the child’s arm<br />
and wrap the tape around the arm at<br />
midpoint. Make sure the numbers are<br />
right side up. Make sure the tape is flat<br />
around the skin (Arrow7).<br />
4. Measurer and assistant: Inspect the<br />
tension of the tape on the child’s arm.<br />
Make sure the tape has the proper tension<br />
(Arrow 7) and is not too tight or too loose<br />
(Arrows 8-9). Repeat any steps as<br />
necessary.<br />
5. Assistant: Have the questionnaire<br />
ready.<br />
6. Measurer: When the tape is in the<br />
correct position on the arm with the<br />
correct tension, read and call out the<br />
measurement to the nearest 0.1cm.<br />
(Arrow 10).<br />
34
TAKING MEASUREMENTS PART 5.<br />
Figure 5.5. Child Mid-Upper Arm Circumference <strong>Measurement</strong><br />
Arm circumference “insertion” tape<br />
0. cm<br />
cm<br />
6 7 8 9 10 11 12 13 14 15 16 18<br />
19 20 21 22 23 24 25<br />
0. cm<br />
1<br />
2 4<br />
6<br />
3<br />
5<br />
1. Locate tip of<br />
shoulder<br />
2. Tip of shoulder<br />
3. Tip of elbow<br />
4. Place tape at tip of<br />
shoulder<br />
5. Pull tape past tip of<br />
bent elbow<br />
6. Mark midpoint<br />
7<br />
7. Correct tape tension<br />
5.<br />
10<br />
9 10<br />
8<br />
8. Tape too tight<br />
9<br />
9. Tape too loose 10. Correct tape position for arm circumference<br />
How to weigh and measure children: assessing the nutritional status of young children in UN (1986)<br />
35
5.4.Assessing the Accuracy of <strong>Measurement</strong>s<br />
Accuracy is achieved through good<br />
training and supervision. There are<br />
techniques for measuring the accuracy of<br />
the measurements. When taking more<br />
than one height or weight measurement<br />
on the same person, the two<br />
measurements can be averaged. If they<br />
are vastly different from each other, the<br />
measurements should be disregarded and<br />
the measuring should start again (Table<br />
5.1 provides specific parameters).<br />
Table 5.1. Largest acceptable differences<br />
between repeated measurements<br />
<strong>Anthropometric</strong><br />
measurement<br />
Weight<br />
Height<br />
MUAC<br />
Largest acceptable<br />
difference<br />
0.5kg<br />
1.0cm<br />
0.5cm<br />
The field supervisor is usually responsible<br />
for assessing the accuracy of<br />
measurements. There are a few practices<br />
a supervisor should employ to make sure<br />
that the data collected is of high quality.<br />
These are:<br />
• Checking the measurements recorded<br />
and submitted by field staff, to see whether<br />
they look reasonable.<br />
• Accompanying field staff on interviews<br />
to watch how measurements are taken.<br />
• Conducting repeat visits to some<br />
households that have already been interviewed<br />
by the field staff. <strong>Measurement</strong>s<br />
should be repeated to determine if the<br />
previous measurements are supported by<br />
the repeat measurements.<br />
Appendix 6 has a section on <strong>Anthropometric</strong><br />
Standardization tests. These tests can be<br />
used during training or at any point during<br />
the survey process to check how accurately<br />
field staff take measurements. These tests<br />
can be especially useful during training to<br />
determine who needs more training or who<br />
might need a little extra supervision once in<br />
the field.<br />
5.<br />
5.5. Entering the data<br />
A survey questionnaire usually contains a<br />
wide range of information to be collected.<br />
A questionnaire should be adapted to the<br />
needs for measuring anthropometry.<br />
Some information will carry over from<br />
one module or section to another. The<br />
following is an example of one format<br />
used for survey work for children under<br />
five years of age.<br />
Anthropometry - basic information:<br />
Enter the children’s names and<br />
identification code numbers, enter the sex<br />
and their ages (see Figure 5.6). Be careful<br />
not to mix up children when moving from<br />
one section of a questionnaire to another.<br />
Child weight: Record the child’s weight<br />
in kilograms to one decimal. Read the<br />
supporting notes carefully as they should<br />
be known to all interviewers and<br />
supervisors. In the example of Mary<br />
(Figure 5.6), her weight was 10.2<br />
kilograms. Had her weight been 9.5 kgs,<br />
the entry would be |0|9:5|. Always note the<br />
zeros and the decimals.<br />
Child length: Record the child’s length<br />
in centimeters to one decimal. In the<br />
example of Mary (Figure 5.6), her length<br />
was 67.3 centimeters. The entry is made<br />
as |0|6|7:3|. Always note the zeros and the<br />
decimals. Make sure the information is<br />
entered accurately and fully on each child.<br />
36
TAKING MEASUREMENTS PART 5.<br />
Figure 5.6. Child anthropometry questionnaire (partial)<br />
Section 1: Health and Nutrition<br />
Household ID<br />
0 1<br />
1.1 Anthropometry<br />
Date of interview<br />
dd mm yy<br />
Name<br />
Child<br />
ID<br />
Date of birth<br />
(dd/mm/yy)<br />
Sex<br />
Age 1 = Male<br />
(months) 2 = Female<br />
Weight<br />
(kg 0.1)<br />
Length<br />
(cms 0.1)<br />
0 1<br />
0 2<br />
dd mm yy<br />
dd mm yy<br />
: :<br />
: :<br />
To the nearest<br />
0.1kg and 0.1cm<br />
For Example:<br />
Mary, a girl, born on 7 August 1996, is approximately 11 months old and weighed 10.2 kilograms and<br />
was 67.3 centimetres long<br />
Mary<br />
0 2 0 7 0 8 9 6 1 1 2 1 0 : 2 0 6 7 : 3<br />
dd mm yy<br />
5.6.Training field staff<br />
Training field staff to collect anthropometric<br />
data through surveys usually<br />
involves learning: to take anthropometric<br />
measurements; and other skills such as<br />
household selection, interviewing<br />
techniques and recording requirements.<br />
All of these skills are important for<br />
conducting surveys that yield valid results.<br />
This section will cover what should be<br />
expected from field staff training.<br />
5.6.1 Planning the training<br />
It is recommended that you always select<br />
more candidates than you need. This will<br />
allow you to pick the candidates with the<br />
best performance when training is over<br />
and will give you some extra trainees in<br />
case of dropouts.<br />
The length of the training will vary<br />
depending on the resources available and<br />
the complexity of the survey. As a<br />
guideline, training is generally scheduled<br />
for two to five days. Usually, the first day<br />
of training is spent explaining the purpose<br />
of the survey and outlining the survey<br />
procedures; the second and third days<br />
focus more closely on survey procedures<br />
and the questionnaire; and the last couple<br />
of days should be used for field exercises<br />
and tests. Field exercises will be covered<br />
in more detail later in this section.<br />
The checklist below lists the topics that<br />
should be covered during training:<br />
Purpose and background of the survey<br />
•<br />
division of responsibilities<br />
•<br />
household selection procedures<br />
•<br />
questionnaire<br />
•<br />
Organization of the survey team and<br />
Explanation of sampling and<br />
Question-by-question review of the<br />
Instruction in techniques of interviewing,<br />
recording answers and checking<br />
5.<br />
37
out questionnaires<br />
• Explanation of specific nutrition<br />
indicators<br />
• Instructions on how to take and record<br />
anthropometric measurements and<br />
standardization tests<br />
• Administrative details (timetable, logbook,<br />
supplies, reports).<br />
5.<br />
5.6.2. Field exercises and standardization<br />
Survey staff should have ample<br />
opportunity to practice the skills taught<br />
during training. This is especially true<br />
with training on taking anthropometric<br />
measurements. Trainees practical skills<br />
need to be developed. During practice<br />
sessions a supervisor can determine who<br />
needs more training. Practice sessions<br />
might begin by taking trainees to a school,<br />
maternal and child health clinic, hospital<br />
or orphanage and letting them practice<br />
taking children’s measurements. The<br />
standardization exercises described in<br />
Appendix 6 ensure the trainees have<br />
acquired the necessary skills.<br />
By the end of training, all trainees<br />
should also have had a chance to practice<br />
what they have learned. Choose a village<br />
that is close to the training center. The<br />
trainees should go through an entire<br />
survey with a few households and the<br />
supervisor should watch how each trainee<br />
performs. This will provide trainees with<br />
hands-on experience, make them feel<br />
more confident when they go into the field<br />
and will give the supervisor a chance to<br />
correct any mistakes.<br />
5.6.3. Survey training manual<br />
A training manual should give an overview<br />
of the purpose of the survey, an outline of<br />
the whole survey process and clearly<br />
define what is expected of the field staff. It<br />
can also include useful tips and answers to<br />
common questions that come up in the<br />
field. All field staff should be provided with<br />
their own copy of the training manual.<br />
38
Comparison of<br />
<strong>Anthropometric</strong> Data to<br />
Reference Standards<br />
6.<br />
P ART<br />
Comparing the measurements of children to<br />
reference standards is an easy procedure<br />
because of readily available public-domain<br />
computer software. This section describes<br />
some underlying principles for efficient use<br />
of the available software beginning with<br />
how individual measurements are<br />
compared to the reference standard.<br />
6.1. NCHS/WHO Reference Standards<br />
The reference standards most commonly<br />
used to standardize measurements were<br />
developed by the US National Center for<br />
Health Statistics (NCHS) and are<br />
recommended for international use by the<br />
World Health Organization. The reference<br />
population chosen by NCHS was a<br />
statistically valid random population of<br />
healthy infants and children. Questions<br />
have frequently been raised about the<br />
validity of the US-based NCHS reference<br />
standards for populations from other ethnic<br />
backgrounds. Available evidence suggests<br />
that until the age of approximately 10 years,<br />
children from well-nourished and healthy<br />
families throughout the world grow at<br />
approximately the same rate and attain the<br />
same height and weight as children from<br />
industrialized countries. The NCHS/WHO<br />
reference standards are available for<br />
children up to 18 years old but are most<br />
accurate when limited to use with children<br />
up to the age of 10 years. The international<br />
reference standards can be used for<br />
standardizing anthropometric data from<br />
around the world.<br />
6.<br />
6.2. Comparisons to the Reference Standard<br />
References are used to standardize a child’s<br />
measurement by comparing the child’s<br />
measurement with the median or average<br />
measure for children at the same age and<br />
sex. For example, if the length of a 3 month<br />
old boy is 57 cm, it would be difficult to know<br />
if that was reflective of a healthy 3 month old<br />
boy without comparison to a reference<br />
standard. The reference or median length<br />
for a population of 3 month old boys is 61.1<br />
cm and the simple comparison of lengths<br />
would conclude that the child was almost 4<br />
cm shorter than could be expected.<br />
When describing the differences from<br />
the reference, a numeric value can be<br />
standardized to enable children of different<br />
ages and sexes to be compared. Using the<br />
example above, the boy is 4 cm shorter than<br />
the reference child but this does not take the<br />
age or the sex of the child into consideration.<br />
Comparing a 4 cm difference from the<br />
reference for a child 3 months old is not the<br />
39
same as a 4 cm difference from the To standardize reporting, USAID<br />
reference for a 9 year old child, because of recommends that Cooperating Sponsors<br />
their relatively different body sizes.<br />
calculate percentages of children below cutoffs<br />
as well as other statistics using Z-scores.<br />
Taking age and sex into consideration, If Z-scores cannot be used, percentage of the<br />
differences in measurements can be median should be used.<br />
expressed a number of ways:<br />
standard deviation units, or Z-scores<br />
percentage of the median<br />
• percentiles.<br />
6.3. Standard Deviation Units or Z-Scores<br />
6.<br />
Z-scores are more commonly used by the<br />
international nutrition community because<br />
they offer two major advantages. First,<br />
using Z-scores allows us to identify a fixed<br />
point in the distributions of different<br />
indices and across different ages, i.e., for all<br />
indices for all ages, 2.28% of the reference<br />
population lie below a cut-off of -2 Z-<br />
scores. The percent of the median does not<br />
have this characteristic. For example,<br />
because weight and height have different<br />
distributions (variances), -2 Z-scores on<br />
the weight-for-age distribution is about<br />
80% of the median, and -2 Z-scores on the<br />
height-for-age distribution is about 90% of<br />
the median. Further, the proportion of the<br />
population identified by a particular<br />
percentage of the median varies at different<br />
ages on the same index.<br />
The second major advantage of using Z-<br />
scores is that useful summary statistics can<br />
Z-score (or SD-score) =<br />
be calculated from them. The approach<br />
allows the mean and standard deviation to<br />
be calculated for the Z-scores for a group of<br />
children. This can not be done with<br />
percentages of the median or centiles.<br />
Thus, the Z-score application is considered<br />
the simplest way of describing the<br />
reference population and making<br />
comparisons to it. It is the statistic<br />
recommended for use when reporting<br />
results of nutritional assessments.<br />
Examples of Z-score calculations are<br />
presented in Appendix 1.<br />
The Z-score or standard deviation<br />
unit (SD) is defined as the difference<br />
between the value for an individual and the<br />
median value of the reference population<br />
for the same age or height, divided by the<br />
standard deviation of the reference<br />
population. This can be written in equation<br />
form as:<br />
(observed value) - (median reference value)<br />
standard deviation of reference population<br />
6.4. Percentage of the Median and Percentiles<br />
The percentage of the median is defined<br />
as the ratio of a measured or observed<br />
value in the individual to the median<br />
value of the reference data for the same<br />
age or height for the specific sex,<br />
expressed as a percentage. This can be<br />
written in equation form as:<br />
Percent of median =<br />
observed value<br />
median value of reference population<br />
100<br />
40
COMPARISON OF ANTHROPOMETRIC DATA TO REFERENCE STANDARDS PART 6.<br />
The median is the value at exactly the<br />
mid-point between the largest and<br />
smallest. If a child’s measurements are<br />
exactly the same as the median of the<br />
reference population we say that they are<br />
“100% of the median”. Examples of<br />
calculations for percent of median can be<br />
found in Appendix 1.<br />
The percentile is the rank position of<br />
an individual on a given reference<br />
distribution, stated in terms of what<br />
percentage of the group the individual<br />
equals or exceeds. Percentiles will not be<br />
presented in this guide. The distribution<br />
of Z-scores follows a normal (bell-shaped<br />
or Gaussian) distribution. The commonly<br />
used -3, -2, and -1 Z-scores are, respectively<br />
the 0.13th, 2.28th, and 15.8th<br />
percentiles. The percentiles can be<br />
thought of as the percentage of children in<br />
the reference population below the<br />
equivalent cut-off. Approximately 0.13<br />
percent of children would be expected to<br />
be below -3 Z-score in a normally<br />
distributed population.<br />
Z-score<br />
-3 0.13<br />
-2 2.28<br />
-1 15.8<br />
Percentile<br />
6.5. Cut-offs<br />
The use of a cut-off enables the different<br />
individual measurements to be converted<br />
into prevalence statistics. Cut-offs are also<br />
used for identifying those children<br />
suffering from or at a higher risk of<br />
adverse outcomes. The children screened<br />
under such circumstances may be<br />
identified as eligible for special care.<br />
The most commonly-used cut-off with<br />
Z-scores is -2 standard deviations,<br />
irrespective of the indicator used. This<br />
means children with a Z-score for<br />
underweight, stunting or wasting, below<br />
-2 SD are considered moderately or<br />
severely malnourished. For example, a<br />
child with a Z-score for height-for-age of<br />
-2.56 is considered stunted, whereas a<br />
child with a Z-score of -1.78 is not<br />
classified as stunted.<br />
In the reference population, by<br />
definition, 2.28% of the children would be<br />
below -2 SD and 0.13% would be below -3<br />
SD (a cut-off reflective of a severe<br />
condition). In some cases, the cut-off for<br />
defining malnutrition used is -1 SD (e.g. in<br />
Latin America). In the reference or<br />
healthy population, 15.8% would be below<br />
a cut-off of -1 SD. The use of -1 SD is<br />
generally discouraged as a cut-off due to<br />
the large percentage of healthy children<br />
normally falling below this cut-off. For<br />
example, the 1995 DHS survey using a –2<br />
SD cut-off for stunting in Uganda found a<br />
36% prevalence of stunting in under-three<br />
year olds. This level of stunting is about 16<br />
times the level of the reference population.<br />
A comparison of cutoffs for percent of<br />
median and Z-scores illustrates the<br />
following<br />
90% = -1 Z-score<br />
80% = -2 Z-score<br />
70% = -3 Z-score (approx.)<br />
60% = -4 Z-score (approx.)<br />
Cut-off Points for MUAC for the 6 - 59<br />
Month Age Group<br />
MUAC cut-offs are somewhat arbitrary<br />
due to its lack of precision as a measure of<br />
malnutrition. A cut-off of 11.0cm can be<br />
used for screening severely malnourished<br />
children. Those children with MUAC<br />
below 13.5cm should be selected to have<br />
their weight-for-height measured.<br />
Global Malnutrition is a term generally<br />
used in emergency settings. The global<br />
malnutrition rate refers to the percent of<br />
children with weight-for-height below -2 Z-<br />
scores and/or edema. This refers to all<br />
moderate and severe malnutrition<br />
combined. The combination of a low<br />
weight-for-height and any child with edema<br />
contributes to those children counted as in<br />
the global malnutrition statistic.<br />
6.<br />
41
Malnutrition Classification Systems<br />
The cut-off points for different<br />
malnutrition classification systems are<br />
listed below. The most widely used system<br />
is WHO classification (Z-scores). The<br />
Road-to-Health (RTH) system is typically<br />
seen in clinic-based growth-monitoring<br />
systems. The Gomez system was widely<br />
used in the 1960s and 1970s, but is only<br />
used in a few countries now. An analysis<br />
of prevalence elicits different results from<br />
different systems. These results would not<br />
be directly comparable. The difference is<br />
especially broad at the severe malnutrition<br />
cut-off between the WHO method (Zscores)<br />
and percent of median methods. At<br />
60% of the median the closest<br />
corresponding Z-score is –4. The WHO<br />
method is recommended for analysis and<br />
presentation of data (see Part 6.2).<br />
Mild, moderate and severe are different<br />
in each of the classification systems listed<br />
below. It is important to use the same<br />
system to analyze and present data. The<br />
RTH and Gomez classification systems<br />
typically use weight-for-age.<br />
System Cut-off Malnutrition classification<br />
WHO < -1 Z-score mild<br />
< -2 Z-score moderate<br />
< -3 Z-score severe<br />
RTH ≥ 80% of median normal<br />
60% - < 80% of median mild-to-moderate<br />
< 60% of median severe<br />
Gomez ≥ 90% of median normal<br />
75% - < 90% of median mild<br />
60% - < 75% of median moderate<br />
≤ 60% of median<br />
severe<br />
6.<br />
42
Data Analysis<br />
7.<br />
P ART<br />
Computer software can be used to make<br />
comparisons to the reference standards. The<br />
Centers for Disease Control and Prevention<br />
(CDC) has developed a free software<br />
package called Epi Info that can handle all of<br />
these anthropometric calculations.<br />
Cooperating Sponsors are strongly<br />
encouraged to use available software to<br />
analyze nutrition data. Not only will the<br />
software enable raw anthropometric survey<br />
data to be transformed into the indices and<br />
scores described in Part 6, the software will<br />
flag outliers which are usually the result of<br />
incorrect measurements, coding errors or<br />
incorrect ages. Once the anthropometric<br />
indices have been calculated, they can be<br />
presented in simple tables using specified<br />
cut-offs and age categories consistent with<br />
the Title II Generic Indicator list.<br />
When using computer software for<br />
anthropometry, there are three separate<br />
procedures that should be performed.<br />
First, the raw measurement data should be<br />
entered into the computer. Second, the<br />
program should combine the raw data on<br />
the variables (age, sex, length, weight) to<br />
compute a nutritional status index such as<br />
weight-for-age, height-for-age or weightfor-height.<br />
Third, the program should<br />
transform these data into Z-scores so that<br />
the prevalence of nutritional conditions<br />
such as being underweight and stunted can<br />
be calculated.<br />
Another software called ANTHRO<br />
analyzes anthropometric data and can be<br />
downloaded from the WHO Global Database<br />
on Child Growth and Malnutrition<br />
(www.who.int/nutgrowthdb).<br />
There is another Windows based<br />
software available from: www.nutrisurvey.de.<br />
This software program was designed<br />
specifically for nutrition surveys by the Work<br />
Group on International Nutrition of the<br />
University of Hohenheim/Stuttgart in<br />
cooperation with the German Agency for<br />
Technical Cooperation (GTZ). The<br />
software is based on the <strong>Guide</strong>lines for<br />
Nutrition Baseline Surveys in Communities<br />
published by GTZ. The purpose of the<br />
program is to integrate all steps of a<br />
Nutrition Baseline Survey into a single<br />
program. The program contains a<br />
standard Nutrition Baseline questionnaire<br />
which can be easily customized for the<br />
specific site, a function for printing out the<br />
questionnaire, a data entry unit which<br />
controls the data being entered, a specially<br />
adapted plausibility check, a report<br />
function and a graphics section. The report<br />
function produces the full set of descriptive<br />
statistics of a baseline survey. The graphics<br />
section contains standard graphs and<br />
additional graphics for the anthropometric<br />
indices with comparison to the NCHS<br />
standard. The anthropometric indices (Zscores<br />
of height-for-age, weight-for-height,<br />
weight-for-age) and the prevalence of<br />
stunting, wasting, underweight and<br />
overweight of children are calculated<br />
automatically. For further statistical<br />
evaluation, the data can be exported to<br />
SPSS or other statistical programs.<br />
7.<br />
43
7.1. Sources of Epi Info Software<br />
Public domain sources of Epi Info<br />
software and supporting materials<br />
Epi Info is available from the Centers<br />
for Disease Control and Prevention (CDC),<br />
1600 Clifton Road,<br />
Atlanta, GA 30333, USA<br />
or downloaded from:<br />
www.cdc.gov/epiinfo/<br />
The Epi Info 2000 package comes with<br />
a manual and tutorials to help the user to<br />
become familiar with data analysis using<br />
Epi Info.<br />
7.2. Recommendation for Analysis and Presentation of Height Data<br />
For evaluation purposes, the presentation of<br />
stunting data for children less than 24<br />
months is useful. An intervention among<br />
children under 24 months is likely to be<br />
more effective than among children 24-59<br />
months. This is because 1) the determinants<br />
of stunting in the older children<br />
are more varied, and 2) stunting in older<br />
children may reflect historical nutritional or<br />
health stress and be ‘permanent,’ i.e. not<br />
responsive to any intervention. A further<br />
consideration in the presentation of data on<br />
stunting by age groups is the change in<br />
measurement technique at 24 months of<br />
age. Data on length for children less than<br />
24 months should not be grouped together<br />
with data on height for children more<br />
than 24 months of age.<br />
Prevalence - For use in Title II programs,<br />
the prevalence of nutritional status<br />
conditions can be calculated using cut-off<br />
points for height-for-age and weight-forage.<br />
The cut-off points can be set using Z-<br />
scores, percentiles or percentage of the<br />
median. For Title II programs, a cut-off of<br />
-2 Z-score is recommended and results<br />
should be presented for both males and<br />
females. An example of a prevalence table<br />
for low height-for-age as established by -2<br />
SD for groups of children aged 6 - 59.99<br />
months is given below:<br />
Table 7.1. Prevalence of low height-for-age (stunting) in a sample of 97 children,<br />
by sex and age group<br />
7.<br />
Age Group<br />
(months)<br />
< 6<br />
6-11.99<br />
12-23.99<br />
24-35.99<br />
36-47.99<br />
48-59.99<br />
Total<br />
Sex<br />
Boys<br />
Girls<br />
Combined<br />
Boys<br />
Girls<br />
Combined<br />
Boys<br />
Girls<br />
Combined<br />
Boys<br />
Girls<br />
Combined<br />
Boys<br />
Girls<br />
Combined<br />
Boys<br />
Girls<br />
Combined<br />
Boys<br />
Girls<br />
Combined<br />
Number below<br />
cut-off (-2 SD)<br />
0<br />
0<br />
0<br />
0<br />
0<br />
0<br />
1<br />
2<br />
3<br />
0<br />
4<br />
4<br />
6<br />
3<br />
9<br />
6<br />
5<br />
11<br />
13<br />
14<br />
27<br />
Number in age<br />
group<br />
6<br />
4<br />
10<br />
6<br />
3<br />
9<br />
6<br />
10<br />
16<br />
7<br />
13<br />
20<br />
10<br />
10<br />
20<br />
15<br />
7<br />
22<br />
50<br />
47<br />
97<br />
Percentage below<br />
cut-off<br />
0.0<br />
0.0<br />
0.0<br />
0.0<br />
0.0<br />
0.0<br />
16.7<br />
20.0<br />
18.8<br />
0.0<br />
30.8<br />
20.0<br />
60.0<br />
30.0<br />
45.0<br />
40.0<br />
71.4<br />
50.0<br />
26.0<br />
29.8<br />
27.8<br />
Overall, this table shows that 26.0 percent of the boys had a low height-for-age or were stunted, while 29.8 percent<br />
of girls were stunted. Interpretations can also be made about the various age groups or with boys and girls<br />
grouped together.<br />
44
DATA ANALYSIS PART 7.<br />
7.3. Examples of Data Analysis<br />
This section covers an analysis of data<br />
pertaining to maternal and child nutrition<br />
programs using food aimed at vulnerable<br />
groups in two populations (countries A and<br />
B), simulating situations often encountered<br />
in Title II operations. These examples<br />
illustrate an analysis that would allow one to<br />
reach, at a minimum cost, statistically valid<br />
conclusions concerning the nutritional<br />
impact of a supplementary feeding program.<br />
The analysis compares the “before<br />
intervention” and “after intervention” data<br />
according to the following plan going from<br />
the general to the specific.<br />
For all ages and sexes combined:<br />
• all ages, both sexes comparison of<br />
change in the indicators;<br />
• calculation of general prevalence of<br />
malnutrition (stunting and underweight);<br />
• calculation of changes in prevalence;<br />
Examination of data separated by sex<br />
(ages combined):<br />
• calculation of general prevalence of<br />
malnutrition for each sex;<br />
• calculation of changes in prevalence;<br />
Examination of data by age categories<br />
(sexes combined):<br />
• calculation of prevalence of malnutrition<br />
by age category;<br />
• calculation of changes in prevalence.<br />
With reference to this plan of analysis, the<br />
following assumptions should be noted:<br />
• the final year evaluation measurements<br />
were taken after an interval<br />
sufficiently long for the program to have<br />
produced a nutritional impact (e.g. five<br />
years);<br />
• data were collected from a crosssectional<br />
sample representative of the program<br />
population; and<br />
• baseline data had been collected.<br />
The first example is a comparison of<br />
percentage or prevalence changes.<br />
Cooperating Sponsors are encouraged to<br />
compare changes in the mean Z-scores<br />
for statistical and epidemiological rigor.<br />
Example 1<br />
In 1995, a US-supported Cooperating Sponsor in cooperation with the Government of Country A,<br />
introduced a community-based health and nutrition program with a supplementary feeding scheme<br />
aimed at vulnerable groups. The scheme covered 6 of the 14 administrative districts of the country.<br />
Food supplements were distributed through community centers on a year-round basis to infants over<br />
six months of age and children up to the age of 3 years and to pregnant women and lactating mothers<br />
over an 18-month period (last 6 months of pregnancy and the first 12 months postpartum). In all,<br />
86,000 individuals (21,000 women and 65,000 children) were covered by the program.<br />
In agreement with the USAID Mission and Food for Peace (FFP), the Cooperating Sponsor decided to<br />
evaluate the nutritional changes at three intervals (baseline, mid-term and final year). The first<br />
collection of data began in the second year following the initiation of operations. By adopting a prepost<br />
or reflexive design, data on sex, age, weight and height were collected from three representative<br />
cross-sectional sample surveys of the infant and child beneficiaries in 1996, 1998 and 2000.<br />
7.<br />
Ages of the sample children ranged from 3 months to 5 years. Due to some problems in age<br />
estimations and incomplete data, sample sizes of the children varied between 3700 and 2500. No data<br />
were collected from the 8 districts in which the program had not been implemented.The population<br />
of the 8 districts was not comparable, from the nutritional and socioeconomic standpoints, with the<br />
population of the 6 districts covered by the program.<br />
45
Calculation of Nutrition Levels<br />
The measurement of nutritional impact<br />
was based on a comparison of data<br />
collected in 1996 and 2000 so that the<br />
figures would include the largest possible<br />
proportion of children who had<br />
participated in the program for one year or<br />
more. It was felt that this time interval<br />
was necessary to allow for any anticipated<br />
impact to manifest itself. The collected<br />
data are summarized in Table 7.5.<br />
The results for weight-for-height are<br />
presented to illustrate that this indicator<br />
is inappropriate to evaluate the program<br />
since it reflects short-term changes. The<br />
tables also include age ranges that will<br />
not be used in the final presentation but<br />
Cooperating Sponsors are encouraged to<br />
examine the results for different age<br />
groups to better understand how the<br />
indicator responds.<br />
Table 7.2. Distribution of nutritional indicators (Z-scores) at baseline (all ages)<br />
No. examined<br />
No. below -2 S.D.<br />
% below -2 S.D.<br />
Height-for-age<br />
HAZ<br />
2695<br />
1294<br />
48.0<br />
Weight-for-age<br />
WAZ<br />
2695<br />
916<br />
34.0<br />
Height-for-height<br />
WHZ<br />
2695<br />
110<br />
4.1<br />
Table 7.3. Prevalence of low levels of nutritional indicators by sex at baseline (all ages)<br />
Girls<br />
Boys<br />
HAZ < -2<br />
49.5<br />
47.3<br />
WAZ < -2<br />
32.4<br />
35.6<br />
WHZ < -2<br />
3.6<br />
4.6<br />
Table 7.4. Prevalence of stunting or low levels of height-for-age by age<br />
categories at baseline<br />
7.<br />
HAZ < -2<br />
No. examined<br />
3-11 months<br />
34.5<br />
560<br />
12-23 months<br />
42.4<br />
523<br />
24-35 months<br />
48.5<br />
534<br />
36-59 months<br />
52.7<br />
1078<br />
Table 7.5. Prevalence of low levels of nutritional indicators by sex and stage of<br />
intervention (for specific age categories)<br />
HAZ < -2<br />
24-59 months<br />
WAZ < -2<br />
3-35 months<br />
WHZ < -2<br />
3-35 months<br />
Baseline<br />
Final year<br />
Baseline Final year Baseline Final year<br />
Girls<br />
Boys<br />
Sexes combined<br />
49.5<br />
47.3<br />
48.0<br />
35.5<br />
37.5<br />
36.6<br />
32.4<br />
35.6<br />
34.0<br />
23.1<br />
26.5<br />
25.0<br />
3.6<br />
4.6<br />
4.1<br />
3.2<br />
4.0<br />
3.8<br />
46
DATA ANALYSIS PART 7.<br />
Tables 7.4 and 7.5 show that over the four<br />
years of the intervention, stunting in girls<br />
and boys was substantially reduced along<br />
with underweight. For sexes combined,<br />
the reduction was 11.4 and 9.0 percentage<br />
points for stunting and underweight,<br />
respectively. The reduction for stunting<br />
was more dramatic while wasting (WHZ)<br />
was virtually unaffected. Wasting should<br />
not be used for evaluation purposes as it is<br />
a relatively rare event and very susceptible<br />
to seasonal influences.<br />
Note the different age groupings for<br />
stunting and wasting in Table 7.5. Some of<br />
the children measured for stunting were<br />
older than the children in the intervention.<br />
The reason for selecting the 24-59 month<br />
age group for evaluation was to capture<br />
the cumulative and lagged effect that the<br />
nutrition project would have on stunting.<br />
There is another reason for the<br />
different age groupings. It is not<br />
recommended to aggregate data for<br />
children under 24 months with those over<br />
24 months (see Part 7.2). Also, the Title II<br />
Generic <strong>Indicators</strong> recommend either<br />
stunting or underweight indices but<br />
require specific age groupings for<br />
underweight.<br />
Comparison of Mean Z-scores<br />
The alternative and preferred approach to<br />
evaluating the change in a percentage for<br />
a nutritional index is to compare mean Z-<br />
score change over the life of the program.<br />
Just as in the above calculation of change<br />
in prevalence of an index, the data are<br />
analyzed at baseline with the mean and<br />
standard deviation calculated and<br />
compared with the same project area in<br />
the final year of the program. The mean<br />
Z-score comparison has the advantage of<br />
describing the entire population directly,<br />
without resorting to a subset of individuals<br />
below a set cut-off. Comparing<br />
means over prevalences is desired as<br />
many of the Title II interventions target<br />
whole communities not just the severely<br />
malnourished.<br />
A community health and nutrition<br />
intervention would expect all children to<br />
benefit whereas a targeted feeding<br />
program for the severely malnourished<br />
would only benefit these children. Using a<br />
-2 SD cut-off and presenting a prevalence<br />
change would show a change in the<br />
prevalence of those below the cut-off.<br />
Therapeutic feeding programs would<br />
focus on changes in nutritional status<br />
among the severely malnourished but<br />
community based programs target all<br />
children and their caregivers. A<br />
presentation of the mean would reflect all<br />
the children and comparing means would<br />
reflect the community shift or improvement.<br />
The statistical comparison of mean<br />
Z-scores over time using the Student’s T-<br />
test for example, is a more powerful<br />
statistical test than comparing prevalences<br />
using the Chi-square statistical test. Using<br />
the same example from above, Table 7.6<br />
presents the results of the mean Z-scores<br />
for height-for-age and weight-for-age.<br />
Table 7.6. Mean Z-scores for stunting (HAZ) and underweight (WAZ) by sex and stage of<br />
intervention (for specific age groupings)<br />
7.<br />
HAZ 24-59 months<br />
WAZ 3-35 months<br />
Final year<br />
Baseline<br />
Final year<br />
Girls<br />
Boys<br />
Sexes combined<br />
Baseline<br />
-2.53<br />
-2.48<br />
-2.50<br />
-2.33<br />
-2.45<br />
-2.36<br />
-1.98<br />
-1.86<br />
-1.93<br />
-1.54<br />
-1.65<br />
-1.58<br />
The evaluation recommendation for Title<br />
II programs is to use a comparison of<br />
mean Z-scores for statistical testing but<br />
the results should be presented with both<br />
change in mean Z-score and change in<br />
prevalence as the latter is more easily<br />
understood by a general audience.<br />
47
Example 2<br />
A Cooperating Sponsor conducted a baseline and final-year survey collecting height and weight data on 24-59<br />
month old children. At both times the sample was randomly drawn from the target communities and did not include<br />
the same children in both surveys. The pre-post design enabled a comparison of change in nutritional status (as<br />
reflected by height-for-age) in the target communities.<br />
Baseline at time zero:<br />
(t 0 ): Mean Z-score = -2.05 (sd=1.26); Prevalence (-2SD cut-off) = 40%<br />
Sample size = 940<br />
Final year at time five:<br />
(t 5 ): Mean Z-score = -1.20 (sd=1.15); Prevalence (-2SD cut-off) = 23%<br />
Sample size = 1056<br />
Using statistical software to conduct the t-test (e.g. SPSS, or STATA; note that Epi Info 2000 or Epi Info 6 does not<br />
have this test), the testing of the significance of the change in the sample means is straightforward.<br />
t = (Mean t 0 - Mean t 5 ) / sq. root (Variance t 0 /n 0 + variance t 5 /n 5 )<br />
where n 0 and n 5 is sample size at baseline and final year.<br />
t = (-2.05 - (-1.20)) / [sq. root ((1.26x1.26)/940)) + ((1.15x1.15)/1056))]<br />
t = (-0.85) /[sq. root (0.0016889) + (0.0012523)]<br />
t = (-0.85) /[ 0.054233]<br />
t = 15.67<br />
This change in mean Z-scores is highly significant (i.e. well above the critical t-value of 1.96 at 0.05 level).<br />
7.4.Additional Data Analysis Information<br />
7.<br />
In cooperation with Food Aid Management,<br />
FANTA developed a workshop for the<br />
training of program managers in the<br />
calculation and analysis of basic<br />
anthropometric data using Epi Info and<br />
SPSS. The materials from the Data Analysis<br />
Workshop are available at:<br />
www.fantaproject.org/focus/index under<br />
Monitoring and Evaluation.<br />
Step by step instructions on data analysis<br />
can be found on the Practical Analysis of<br />
Nutritional Data (PANDA) website:<br />
www.tulane.edu/~panda2/. PANDA was<br />
designed for data analysis instruction using<br />
SPSS software.<br />
There are many statistical analysis software<br />
packages available, other than Epi Info. The<br />
packages listed below are only a few of the<br />
commonly used statistical analysis software<br />
programs. These packages vary in<br />
capability and cost. Information on<br />
capability and ordering the packages can be<br />
found on their web sites.<br />
SPSS (Statistical Package for Social<br />
Sciences) www.spss.com<br />
SAS (Statistical Analysis System)<br />
www.sas.com<br />
STATA (Statistics/Data Analysis)<br />
www.stata.com<br />
SUDAAN (Software for the Statistical<br />
Analysis of Correlated Data)<br />
www.rti.org/patents/sudaan/sudaan.html<br />
48
Annual<br />
Monitoring<br />
<strong>Indicators</strong><br />
8.<br />
P ART<br />
8.1. Introduction<br />
Information from regular reporting of<br />
activities from growth monitoring and<br />
promotion programs (GMP) will enhance<br />
program management and can provide<br />
valuable insights into the interpretation of<br />
anthropometric indicators of impact that<br />
are required by USAID. This section<br />
describes how annual monitoring<br />
indicators that are based upon data from<br />
monitoring may be collected and reported<br />
in a standard format. This will help make<br />
the indicators more useful for<br />
management of programs at all levels<br />
within countries and for reporting to<br />
USAID. Reporting information to USAID<br />
on annual monitoring indicators is<br />
recommended but not required.<br />
The recommended annual monitoring<br />
indicators for maternal and child health<br />
and nutrition programs are:<br />
• Percent of eligible children in growth<br />
monitoring/promotion (MP);<br />
• Percent of children in GMP program<br />
gaining weight in past 3 months (gender<br />
specific).<br />
8.2. Routine Data Collection<br />
These guidelines are designed to avoid any<br />
unnecessary burden of reporting on staff at<br />
all levels in program implementation and<br />
so information for the monitoring<br />
indicators should come from routinely<br />
collected data rather than special surveys.<br />
At this time, there is not a standard format<br />
for collecting data from GMP activity and,<br />
the indicators that are available will vary<br />
widely, among Cooperating Sponsors and<br />
countries, and in some cases within the<br />
same Cooperating Sponsor. It is<br />
appropriate to report whatever data are<br />
readily accessible and avoid investing<br />
scarce resources in attempts to generate or<br />
retrieve data that are not readily accessible.<br />
Data needed for the first index, GMP<br />
attendance rate:<br />
1. The denominator - the number of<br />
eligible children in the population, by<br />
gender and age (usually the most reliable<br />
estimates will be those the project has<br />
gathered as part of its baseline survey, or<br />
other data collection activities);<br />
2. The numerator - the number of<br />
children in growth monitoring/promotion.<br />
The classification of “in growth<br />
monitoring/promotion” is meant to reflect<br />
the total number of children whose weight<br />
has been monitored in clinic- and/or<br />
village-based activities. This number may<br />
be the total number of children weighed in<br />
the ‘round’ immediately before the<br />
reporting period, or it may be an estimate<br />
of the ‘usual’ total number of children<br />
attending weighing activities over the<br />
reporting period. How the number is<br />
8.<br />
49
8.<br />
derived is not necessarily important, but it<br />
is most important to report clearly how<br />
the estimate was made. Because<br />
attendance at GMP programs varies<br />
widely with age, this number will be more<br />
meaningful if it is age specific - e.g.,
References<br />
9.<br />
P ART<br />
Adair, L., Polhamus, B.,<br />
Testing <strong>Indicators</strong> for Use in Monitoring<br />
Interventions to Improve Women’s<br />
Nutritional Status. MEASURE Evaluation<br />
<strong>Project</strong>, The United Nations University<br />
Press, May 1998.<br />
Beaton, G., Kelly, A., Kevany, J.,<br />
Martorell, R., and Mason, J.<br />
Appropriate Uses of <strong>Anthropometric</strong><br />
Indices in Children. Geneva: UN<br />
ACC/SCN, 1990<br />
Bender, W., and Remancus, S.<br />
The Anthropometry Resource Center<br />
funded by the FAO/SADC project<br />
GCP/RAF/284/NET, Development of a<br />
Regional Food Security and Nutrition<br />
Information System.<br />
CDC. ANTHRO software analyzes<br />
anthropometric data can be downloaded<br />
at www.cdc.gov/epiinfo/ and from the<br />
WHO Global Database on Child Growth<br />
and Malnutrition at<br />
www.who.int/nutgrowthdb<br />
Collins, S., Duffield, A., and Myatt, M.<br />
Assessment of nutritional status in<br />
emergency-affected populations: Adults.<br />
ACC/SCN, Geneva, July, 2000<br />
Dean, A. G., Epi Info Version 6: A Word<br />
Processing Database and Statistics System<br />
for Epidemiology on Microcomputers,<br />
Atlanta, Georgia, 1994.<br />
Food and Nutrition Bulletin<br />
Surveillance for actions towards better<br />
nutrition, Volume 16, Number 2, The<br />
United Nations University Press, June<br />
1995. www.unu.edu/unupress/food/<br />
8F162e/8F162E00.htm#Contents<br />
FAO (Food and Agriculture<br />
Organization), Conducting small-scale<br />
nutrition surveys: A field manual, No. 5,<br />
FAO, Rome, 1990.<br />
Hennekens, C., Burring, J.<br />
Epidemiology in Medicine. Little, Brown<br />
and Company. 1987.<br />
Ismail, S., Manandhar, M., Better<br />
Nutrition for Older People, Assessment and<br />
Action. HelpAge International and<br />
London School of Hygiene & Tropical<br />
Medicine, London, UK, 1999.<br />
Médecins sans Frontèries (MSF),<br />
Nutrition <strong>Guide</strong>lines. Coordinated by M<br />
Boerlart, A Davis, B Lelin, M J Michelet,<br />
K Ritmeijer, Svan der Kam and F Vautier.<br />
MSF Holland, 1995.<br />
Médecins sans Frontèries (MSF),<br />
Refugee Health, An Approach to<br />
Emergency Situations, 1997.<br />
Norusis, M., Marketing Department,<br />
SPSS Inc. 1990.<br />
9.<br />
51
9.<br />
Pellitier, D., Frongillo Jr., E, Schroeder,<br />
D., Habicht, J. A Methodology for<br />
Estimating the Contribution of<br />
Malnutrition to Child Mortality in<br />
Developing Countries. The Journal of<br />
Nutrition. October 1994, Supplement.<br />
SCF Drought Relief in Ethiopia. Compiled<br />
by J Appleton with the SCF Ethiopian<br />
Team, London. 1987.<br />
Starr, C., McMillan, B., Human Biology,<br />
Third Edition. Brooks/Cole Publishing<br />
Company, 1999.<br />
United Nations Department of<br />
Technical Co-operation for<br />
Development and Statistical Office,<br />
How to Weigh and Measure Children:<br />
Assessing the Nutritional Status of Young<br />
Children in Household Surveys, UN, New<br />
York, 1986.<br />
UNICEF, 1995. Monitoring progress toward<br />
the goals of the World Summit for Children:<br />
A practical handbook for multipleindicator<br />
surveys, UNICEF, New York.<br />
UNICEF equipment specifications can be<br />
found at:<br />
www.supply.unicef.dk/catalogue/index.htm<br />
under 03 NUTRITION<br />
USAID/BHR, Commodities Reference<br />
<strong>Guide</strong> (CRG), 2000.<br />
www.usaid.gov/hum_response/crg.<br />
USAID/BHR/FFP. Title II <strong>Guide</strong>lines for<br />
Development Programs. January 2000.<br />
www.usaid.gov/hum_response/ffp/dappaa.htm<br />
USAID/CDIE. Performance Monitoring<br />
and Evaluation Tips. 1996.<br />
www.usaid.gov/pubs/usaid_eval/#02.<br />
Waterlow JC. Classification and<br />
definition of Protein Calorie malnutrition.<br />
British Medical Journal 3:566-569, 1972<br />
Waterlow JC, Buzina R, Keller W, Lane<br />
JM, Nichaman MZ, Tanner JM.<br />
The presentation and use of height and<br />
weight data for comparing the nutritional<br />
status of groups of children under the age<br />
of 10 years. Bulletin of the World Health<br />
Organization 55(4):489-498., 1977<br />
WHO (World Health Organization)<br />
Measuring Change in Nutritional Status.<br />
<strong>Guide</strong>lines for Assessing the Nutritional<br />
Impact of Supplementary Feeding<br />
Programs for Vulnerable Groups. World<br />
Health Organization, Geneva, 1983.<br />
WHO (World Health Organization)<br />
Management of Severe Malnutrition: A<br />
Manual for Physicians and Other Senior<br />
Health Workers. World Health<br />
Organization, Geneva, 1999.<br />
52
REFERENCES PART 9.<br />
WHO (World Health Organization)<br />
The Management of Nutrition in Major<br />
Emergencies. World Health Organization,<br />
Geneva, 2000.<br />
WHO (World Health Organization)<br />
Field <strong>Guide</strong> on rapid nutritional<br />
assessment in emergencies. WHO Regional<br />
Office for the Eastern Mediterranean,<br />
World Health Organization, Geneva,<br />
1995.<br />
WHO (World Health Organization)<br />
Physical Status: The use and interpretation<br />
of anthropometry. Report of a<br />
WHO Expert Committee. World Health<br />
Organization, Geneva, 1995.<br />
Woodruff, B.A. and Duffield, A.<br />
Assessment of nutritional status in<br />
emergency-affected populations:<br />
Adolescents. ACC/SCN, Geneva, July, 2000<br />
World Food Programme (WFP).<br />
Supplementary Feeding for Mothers and<br />
Children: Operational <strong>Guide</strong>lines also see<br />
UNHCR/WFP <strong>Guide</strong>lines For Selective<br />
Feeding Programmes In Emergency<br />
Situations, February 1999<br />
www.wfp.org/OP/guide/Pol<strong>Guide</strong>Select.html.<br />
Useful Websites<br />
ACC/SCN (Nutrition Sub-committee of<br />
the UN): acc.unsystem.org/scn/<br />
<strong>Anthropometric</strong> Desk Reference:<br />
www.odc.com/anthro/<br />
Center for Disease Control (CDC)<br />
Growth Charts:<br />
www.cdc.gov/growthcharts/<br />
Child Survival Technical Support<br />
<strong>Project</strong> (CSTS) for KPC Material and<br />
other useful information:<br />
www.childsurvival.com<br />
CORE: USAID/PVO Core Group:<br />
www.coregroup.org/<br />
Demographic Household Survey (DHS)<br />
Macro Inc. www.measuredhs.com/<br />
Food and Agriculture Organization<br />
(FAO) Nutrition Division:<br />
www.fao.org/WAICENT/FAOINFO/ECO<br />
NOMIC/ESN/NUTRI.HTM<br />
Food Aid Management (FAM) provides<br />
USAID documents related to Title II<br />
programs for PVOs: www.foodaid.org<br />
Food and Nutrition Technical<br />
Assistance <strong>Project</strong>: www.fantaproject.org<br />
International Life Sciences Institute<br />
(ILSI): www.ilsi.org/<br />
London School of Hygiene and Tropical<br />
Medicine, Public Health Nutrition Unit<br />
www.lshtm.ac.uk/eps/phnu/phnintro.htm<br />
9.<br />
53
LSMS World Bank Surveys:<br />
www.worldbank.org/html/prdph/lsms/in<br />
dex.htm<br />
MEASURE I (DHS):<br />
www.measuredhs.com/<br />
MEASURE II Evaluation USAID<br />
<strong>Project</strong>:<br />
www.cpc.unc.edu/measure/home.html<br />
Nutrition Surveys and Assessment:<br />
www.nutrisurvey.de/<br />
Practical Analysis of Nutrition Data<br />
(PANDA) Tulane University:<br />
www.tulane.edu/~panda2/<br />
USAID Commodity Reference <strong>Guide</strong>,<br />
Part Two:<br />
www.usaid.gov/hum_response/crg/<br />
WHO Global Database on Child<br />
Growth and Malnutrition:<br />
www.who.int/nutgrowthdb/<br />
9.<br />
54
REFERENCES PART 9.<br />
Glossary<br />
Acute undernutrition - Serious and usually<br />
current periods of inadequate food intake.<br />
Age chart - A chart that can be used<br />
quickly to determine a child’s current age<br />
by the month and year the child was born;<br />
a tool used to determine if reported birth<br />
dates match the age of a child given by<br />
parents or estimated from the child’s<br />
appearance. (FAO, 1990)<br />
Anthropometry - The study and<br />
technique of taking body measurements,<br />
especially for use on a comparison or<br />
classification basis.<br />
Arm circumference - A measurement<br />
done on the mid-upper arm; a<br />
measurement used to assess total body<br />
muscle mass and in some circumstances,<br />
protein-energy malnutrition.<br />
Asymmetrical - Being lopsided; not<br />
having a equal correspondence of form<br />
and arrangement of parts on opposite<br />
sides of a boundary; an asymmetrical<br />
distribution would not have two equal<br />
halves on each side of the median.<br />
Bar chart - A chart in which the length<br />
of the bars depends on the number of<br />
cases in that category and the number of<br />
bars depends on the number of<br />
categories.<br />
Batch processing - The processing of data<br />
for a large group of people at one time.<br />
Bias - A consistent, repeated difference of<br />
the sample from the population, in the<br />
same direction; sample values that do not<br />
center on the population values but are<br />
always off in one direction.<br />
Body Mass Index (BMI) - Also known as<br />
“Quetelet’s index”. An index that uses the<br />
variables weight and height to measure<br />
body fat stores, usually in adults rather<br />
than children (weight in kilograms<br />
divided by the square of height in meters).<br />
Case-control study - A study in which<br />
subjects are selected on the basis of<br />
whether they are (cases) or are not<br />
(controls) receiving benefits of a health<br />
and, or nutrition program.<br />
Chi-Squared test - The Chi-Squared Test<br />
of Association looks at the statistical<br />
significance of an association between a<br />
categorical outcome (such as wasted or<br />
not wasted) and a categorical determining<br />
variable (such as diarrhea in the last two<br />
weeks, no diarrhea).<br />
Chronic undernutrition - Extended<br />
periods of inadequate food intake.<br />
Circumference measuring tape<br />
(circumference insertion tape) - A tool<br />
used to assess arm circumference; a<br />
9.<br />
55
9.<br />
plastic, non-stretchable tape that is pulled<br />
taut around the mid-point of the upper<br />
arm to measure circumference of the arm.<br />
Classification system - A system that<br />
establishes cut-off points using<br />
percentiles, percentages of the median or<br />
standard deviations and identifies<br />
different levels of nutritional risk.<br />
Cluster sample - The selection of groups<br />
that are geographically close to one<br />
another for a sample; usually used in<br />
instances when lists of households or<br />
individuals are not readily available.<br />
Cohort studies - A study which focuses<br />
on the same group of people, but uses<br />
different individuals over time; a study<br />
that uses the same specific population<br />
each time but uses different samples.<br />
Confidence interval - An interval that has<br />
a specified probability of covering the true<br />
population value of a variable or<br />
condition.<br />
Cross-section plus over-sample survey -<br />
A survey in which data is collected from a<br />
random sample and then additional data<br />
is collected so that an in-depth view can<br />
be gained of a certain group or problem.<br />
Cut-off point - Predetermined risk levels<br />
used to differentiate between<br />
malnourished and adequately nourished<br />
segments of a population.<br />
Design effect - The loss of sampling<br />
efficiency resulting from the use of cluster<br />
sampling instead of random sampling (a<br />
design effect of 2.0 is commonly used for<br />
anthropometric and immunization surveys).<br />
Distribution - A display that shows the<br />
number of observations (or measurements)<br />
and how often they occur.<br />
Edema - The presence of excessive<br />
amounts of fluid in the intercellular tissue.<br />
It is the key clinical sign of a severe form<br />
of protein energy malnutrition.<br />
Epidemiology - The science of the<br />
occurrence and determinants of disease in<br />
a population.<br />
Epi Info software - A series of microcomputer<br />
programs produced by the CDC<br />
and WHO, for handling epidemiological<br />
data in questionnaire format and for organizing<br />
study designs and results into text and<br />
tables that may form part of written reports.<br />
External validity - Being able to<br />
generalize conclusions drawn from a<br />
sample or sub-set to a wider population.<br />
Gomez classification system - A<br />
classification system that uses percentage<br />
of the median weight-for-age to identify<br />
children as being normal or having mild<br />
malnutrition, moderate malnutrition or<br />
severe malnutrition.<br />
56
REFERENCES PART 9.<br />
Graph - A drawing that shows the<br />
relationship between two sets of numbers<br />
as a set of points having coordinates<br />
determined by their relationship; a display<br />
of numerical relationships.<br />
Growth chart - A graph that is usually<br />
used to record a child’s weight-for-age in<br />
months; a chart typically used by mothers<br />
and health workers to determine if a child<br />
is experiencing a normal gain in weight.<br />
Growth faltering - A condition identified<br />
by emphasizing the direction of growth<br />
obtained in serial recordings, rather than<br />
actual weight-for-age itself; signified by no<br />
change or an actual decrease in<br />
measurements. (ACC/SCN, 1990)<br />
Growth monitoring and promotion -<br />
The practice of following changes in a<br />
child’s physical development, by regular<br />
measurement of weight and sometimes of<br />
length with accompanying information to<br />
guide the care givers’ nutritional and<br />
related care.<br />
Histogram - A display that shows the<br />
number of observations and how often<br />
they occur, usually through the use of<br />
vertical bars and a horizontal base that is<br />
marked off in equal units.<br />
Household - One person who lives alone<br />
or a group of persons, related or<br />
unrelated, who share food or make<br />
common provisions for food and possibly<br />
other essentials for living; the smallest<br />
and most common unit of production,<br />
consumption and organization in<br />
societies.<br />
Index - An index is usually made up of<br />
two or more unrelated variables that<br />
are used together to measure an<br />
underlying characteristic.<br />
Indicator - A measure used at the<br />
population level to describe the proportion<br />
of a group below a cut-off point; example:<br />
30 percent of the region’s children are<br />
below -2 SD for height-for-age.<br />
Intrahousehold distribution - The<br />
distribution of food within a household;<br />
the act of determining what proportion of<br />
the total household food supply each<br />
member of the household receives.<br />
Length-for-age - An index of past or<br />
chronic nutritional status; an index<br />
which assesses the prevalence of<br />
stunting.<br />
Local events calendar - A calendar that<br />
reflects important local events and<br />
seasons that might help a parent pinpoint<br />
the birth date of their child.<br />
Longitudinal survey - A survey which<br />
follows people over time, to capture data<br />
on an evolving situation or problem.<br />
Different types of longitudinal surveys<br />
9.<br />
57
9.<br />
include: cohort studies, trend studies and<br />
panel studies.<br />
Malnutrition - A nutritional disorder or<br />
condition resulting from faulty or<br />
inadequate nutrition.<br />
Mean - The average value for a set of data;<br />
a measure of central location obtained by<br />
adding all the data items and dividing by<br />
the number of items.<br />
<strong>Measurement</strong> error - The error that can<br />
result in a survey from incorrect<br />
(anthropometric) measurements being<br />
taken.<br />
Median - A measure of central location<br />
for a set of data; the value that falls in the<br />
middle of a set of data when all the values<br />
are ordered from lowest to highest.<br />
Morbidity - A condition resulting from or<br />
pertaining to disease; illness.<br />
Mortality rate - Death rate; frequency of<br />
number of deaths in proportion to a<br />
population in a given period of time; death.<br />
NCHS reference standards - Growth<br />
percentiles developed by the National<br />
Center for Health Statistics in the US that<br />
provide standards for weight-for-age,<br />
length-for-age and weight-for-length.<br />
Normal distribution - A normal<br />
distribution takes a bell-shape and has the<br />
following characteristics: the highest point<br />
occurs at the mean; it is symmetric; the<br />
standard deviation determines the width<br />
of the distribution; and it can be described<br />
with only two numbers: the mean and the<br />
standard deviation.<br />
Numeric value - A value expressed as a<br />
number or numeral.<br />
Nutritional surveillance - A system of<br />
data collection and application; systems<br />
that are based on routinely compiled data<br />
and that monitor changes in variables over<br />
time, give warning of impending crisis or<br />
monitor the effectiveness/ineffectiveness<br />
of existing programs and policies; the<br />
continuous monitoring of the nutritional<br />
status of a specific group.<br />
One-tailed Test - A statistical test to detect<br />
a difference in means between two<br />
populations in a specified direction (i.e. to<br />
detect improved nutritional status).<br />
One time assessment - The practice of<br />
assessing nutritional status through the<br />
use of measurements taken on one<br />
occasion, usually used to screen<br />
participants for immediate interventions.<br />
Panel studies - A type of longitudinal survey<br />
that studies the same people over time.<br />
58
REFERENCES PART 9.<br />
Percentiles - A number that corresponds<br />
to one of 100 equal divisions in a range of<br />
values; a measure of relative location; a<br />
value such that at least p% of the items in<br />
the data set are less then or equal to its<br />
value and at least (100 - p)% of the items<br />
are greater than or equal to it; example:<br />
the 60th percentile means that 60% of<br />
values in the data set are less than or equal<br />
to it and (100 - 60) 40% are greater than or<br />
equal to it.<br />
Percentage of the median - A fraction or<br />
ratio based on a total of 100, where the<br />
median value of the data set equals 100; a<br />
value that equals a proportion or part of a<br />
distribution where the median represents<br />
100 percent.<br />
Population - The entire group of people<br />
that is the focus of the study (everyone in<br />
the country, or those in a particular<br />
location, or a special ethnic, economic or<br />
age group).<br />
Prevalence - The proportion of the<br />
population that has a condition of interest<br />
(i.e. wasting) at a specific point in time; a<br />
measure of a condition that is independent<br />
of the size of the population; a value that is<br />
always between 0 and 1.<br />
Protein-energy malnutrition - Undernutrition<br />
that results in an individual not<br />
receiving adequate protein or calories for<br />
normal growth, body maintenance, and the<br />
energy necessary for ordinary human<br />
activities.<br />
References or reference standards -<br />
<strong>Measurement</strong> data collected on representative,<br />
healthy populations through<br />
standardized methods; a data set that<br />
allows comparisons to be made between<br />
its values and individuals or populations<br />
being measured.<br />
Reflexive study design – One group pre-<br />
/post-test. A study in which one population<br />
group is studied on two different occasions<br />
to compare changes over time.<br />
Risk - The possibility of suffering harm;<br />
danger; “a continuous variable relating to<br />
the likelihood that a defined undesirable<br />
outcome will occur”.<br />
Sample - A part or subset of the<br />
population used to supply information<br />
about the whole population.<br />
Sample size - The number of households<br />
or persons selected to be included in a<br />
sample or survey.<br />
Sampling - The technique of selecting a<br />
representative part of the population for<br />
the purpose of determining characteristics<br />
of the whole population.<br />
9.<br />
59
9.<br />
Sampling error - The difference between<br />
the results obtained from a survey sample<br />
and those that would have been obtained<br />
if the entire population was surveyed. The<br />
size of sampling error varies both with the<br />
size of the sample and with the<br />
percentages giving a particular response.<br />
Screening - The practice of distinguishing<br />
between individuals who should be<br />
enrolled in a program/intervention and<br />
those who should not be enrolled; a tool<br />
for identifying individuals at risk; to<br />
examine carefully to determine suitability.<br />
Self-selection - The act whereby<br />
individuals determine their participation<br />
in some activity or event, because of<br />
underlying values, characteristics or<br />
circumstances.<br />
Simple cross-section survey - A survey<br />
that collects data using random sampling;<br />
a survey that gives all individuals or<br />
household in the study area an equal<br />
chance of being chosen for the survey.<br />
Simple random sample - The results of a<br />
method of sampling that gives everyone<br />
an equal chance of being selected; the<br />
simplest form of probability sampling; a<br />
sample in which an individual’s selection<br />
is independent of the selection of any<br />
other individual.<br />
Skewed distribution - A distribution in<br />
which one side is unequal to the other<br />
side; a distribution in which the two sides<br />
do not mirror each other across the center<br />
line of the mean.<br />
Skinfold calipers - A tool used to assess<br />
skinfold thickness by measuring the<br />
thickness of the skin pinched between its<br />
prongs.<br />
Skinfold thickness - A measurement that<br />
provides an estimate of subcutaneous fat<br />
deposits, which in turn provides<br />
information on total body fat.<br />
Specificity - Characteristic of a<br />
classification system that correctly<br />
identifies children who are not at risk; the<br />
probability that a healthy individual will<br />
be classified as healthy; a system with few<br />
false positives.<br />
Spring scale - A scale that measures<br />
weight by the amount a spring is pulled by<br />
the object being weighed; a hanging scale.<br />
Standard deviation - A statistical<br />
measure of dispersion away from the<br />
mean; the square root of the variance.<br />
Stratified sample - A method of sampling<br />
that ensures proportional representation<br />
from all sub-groups or strata.<br />
60
REFERENCES PART 9.<br />
Stratified survey - A survey that chooses<br />
participants randomly after they have<br />
been divided into the applicable strata or<br />
sub-groups.<br />
Student’s t-test - A statistical test to<br />
determine if there is a significant<br />
difference in means of a continuous<br />
variable between two groups.<br />
Stunting - A slowing of skeletal growth<br />
that results in reduced stature or length; a<br />
condition that usually results from<br />
extended periods of inadequate food<br />
intake, especially during the years of<br />
greatest growth for children.<br />
Subcutaneous fat - Fat located just<br />
underneath the skin; fat that is used as a<br />
measure of total body fat stores in skinfold<br />
thickness measurements.<br />
Subscapular area - The site just below<br />
the shoulder blade; situated below or on<br />
the underside of the scapula.<br />
Summary statistics - Statistics that are<br />
used to describe the center and spread of<br />
the distribution of a variable; statistics<br />
that usually make up such a summary<br />
include: the mean, standard deviation,<br />
median, variance, mode, total, standard<br />
error, and upper and lower quartiles.<br />
Survey - A method of gathering<br />
information about a large number of people<br />
by talking to a few of them; a way to collect<br />
information on people’s needs, behavior,<br />
attitudes, environment and opinions, as<br />
well as on such personal characteristics as<br />
age, income and occupation.<br />
Systematic sample - A modification of a<br />
simple random sample, that consists of<br />
picking individuals at regular intervals<br />
from a random list.<br />
Tolerated sampling error - The amount<br />
of difference permissible between the<br />
estimate (results from a survey sample)<br />
and the actual value in the population.<br />
Trend assessment - The process of<br />
tracking nutritional progress over time;<br />
examples of nutritional trend assessment<br />
include growth monitoring and<br />
nutritional surveillance.<br />
Trend studies - A type of longitudinal<br />
survey that uses different individuals for<br />
study over time; a study which uses<br />
different households in each survey, but<br />
in which each sample represents the<br />
same general population at different<br />
times.<br />
Triceps - The muscle at the back of the<br />
upper arm; a large three-headed muscle<br />
running along the back of the upper arm<br />
and functioning to extend the forearm.<br />
9.<br />
61
Two-tailed Test - A statistical test to detect<br />
a difference in means between two<br />
populations regardless of the direction of<br />
the difference.<br />
Underweight - A condition measured by<br />
weight-for-age; a condition that can also<br />
act as a composite measure of stunting and<br />
wasting.<br />
Variable - A quantity that may vary from<br />
object to object; a characteristic of a unit.<br />
Wasting - A condition measured by<br />
weight-for-height; a condition that results<br />
from the loss of both body tissue and fat, in<br />
a body; a condition that usually reflects<br />
severely inadequate food intake happening<br />
at present.<br />
Weight-for-height - An index of current<br />
nutritional status also referred to as<br />
wasting.<br />
Weighting - A data analysis process that<br />
involves adjusting key variables used for<br />
sample selection to their actual<br />
proportions in the population.<br />
Z-score - A statistical measure of the<br />
distance, in units of standard deviations, of<br />
a value from the mean; the standardized<br />
value for an item based on the mean and<br />
standard deviation of a data set; a<br />
standardized value computed by<br />
subtracting the mean from the data value x<br />
and then dividing the results by the<br />
standard deviation.<br />
Waterlow classification system - A<br />
nutritional classification system that uses<br />
percentage of the median of height-for-age<br />
and weight-for-height in combination to<br />
identify children who are wasted, stunted<br />
or both.<br />
9.<br />
Weighing trousers - A pair of little pants<br />
that a child can step into and be suspended<br />
by for weighing from a hanging scale.<br />
Weight-for-age - An index of acute<br />
malnutrition; a valuable index for use with<br />
very young children or when length<br />
measurements are difficult to do<br />
accurately.<br />
62
REFERENCES PART 9.<br />
Acronyms<br />
BHR<br />
BMI<br />
CDC<br />
Cm<br />
CS<br />
DHS<br />
DHS-III<br />
DOB<br />
DOM<br />
EBF<br />
FFP<br />
GMP<br />
HAZ<br />
HAM<br />
HAP<br />
Ht<br />
ID<br />
Kgs<br />
KPC<br />
MCH<br />
MUAC<br />
NGO<br />
PVO<br />
UNICEF<br />
USAID<br />
SPSS<br />
USAID<br />
WAZ<br />
WAM<br />
WAP<br />
WHZ<br />
WHM<br />
WHP<br />
WHO<br />
Wt<br />
Bureau of Humanitarian Response<br />
Body Mass Index<br />
Centers for Disease Control and Prevention<br />
Centimeters<br />
Cooperating Sponsor<br />
Demographic and Health Survey<br />
Demographic & Health Survey (third phase DHS surveys conducted in country)<br />
Date of birth<br />
Date of measurement<br />
Exclusive breastfeeding<br />
Food for Peace<br />
Growth monitoring and promotion<br />
Height for age Z-score<br />
Height for age % median<br />
Height for age percentile<br />
Height<br />
Identification<br />
Kilograms<br />
Knowledge Practice and Coverage<br />
Maternal and child health<br />
Mid-upper arm circumference<br />
Non-governmental organization<br />
Private voluntary organization<br />
United Nations Children’s Fund<br />
United States Agency for International Development<br />
Statistical Package for Social Sciences (software)<br />
United Stated Agency for International Development<br />
Weight for age Z-score<br />
Weight for age % median<br />
Weight for age Percentile<br />
Weight for height Z-score<br />
Weight for height for age % median<br />
Weight for height percentile<br />
World Health Organization<br />
Weight<br />
63
APPENDIX<br />
1.Calculating<br />
Z-scores<br />
9.<br />
Using Distributions by Standard Deviation<br />
The reference population data are<br />
available with the mean measurement<br />
values and the measurement values for up<br />
to +/- 3SD displayed, for the three<br />
nutritional status indices. These values<br />
are given for each month of age up to 119<br />
months, for both boys and girls. The data<br />
may be viewed in the following three<br />
formats: (1) table; (2) graph; and (3)<br />
spreadsheet. An example of how a table of<br />
weight-for-age values for boys can be used<br />
is as follows.<br />
Procedure<br />
A 19-month-old boy who weighs 9.8 kg is<br />
compared to the reference standards. Use a<br />
distribution of the reference standards that<br />
already has values for the standard<br />
deviations calculated. First, the appropriate<br />
distribution should be consulted.<br />
Example: Part of the table below is the<br />
weight-for-age by standard deviation for<br />
boys. Age in months is listed in the far left<br />
column. The mean or expected values for<br />
an “average” healthy boy of each age is<br />
located in the middle column. The<br />
measurement values range from -3 to +3<br />
SDs, with the standard deviation for the<br />
lower and upper halves of the distribution<br />
also shown. The correct line of the table<br />
should be found (lines vary by months of<br />
age or centimeters of length). The child’s<br />
measurement should then be pinpointed<br />
along this line.<br />
Example: In this case, we need to locate<br />
the line for the age 19 months and then<br />
find where 9.8 kg falls. The table shows<br />
that such a child falls between -2 and -1<br />
SD.<br />
Therefore, we would say that a 19 month<br />
old boy who weighed 9.8 kg is between -2<br />
and -1 SD from the mean. To obtain a<br />
more accurate statistic, a Z-score would<br />
have to be calculated.<br />
Calculating Z-scores<br />
When the mean and standard deviation<br />
for a set of data are available, as they are<br />
with the reference standards, a Z-score<br />
can be calculated. In this case, a Z-score<br />
calculated for an individual tells exactly<br />
how many standard deviation units his<br />
measurements are away from the mean of<br />
the reference distribution. A positive Z-<br />
score means that an individual’s<br />
measurements are higher than the<br />
reference mean and a negative Z-score<br />
means that the measurements are lower<br />
than the reference mean. The advantage<br />
of calculating a Z-score is that it provides<br />
more precision than just locating a<br />
position on a table, as we did above. Only<br />
the mean and standard deviation are<br />
needed.<br />
Procedure<br />
Assume we have the same 19 month old<br />
boy from the example above, who weighs<br />
9.8 kilograms. If we look at the reference<br />
64
REFERENCES PART 9.<br />
Weight (kg) for age distribution by standard deviation for boys<br />
Age Group<br />
(months)<br />
Lower<br />
S.D.<br />
-3<br />
S.D.<br />
-2<br />
S.D.<br />
-1<br />
S.D.<br />
Mean<br />
+1<br />
S.D.<br />
+2<br />
S.D.<br />
+3<br />
S.D.<br />
Upper<br />
S.D.<br />
12<br />
13<br />
14<br />
15<br />
16<br />
17<br />
18<br />
19<br />
20<br />
21<br />
22<br />
23<br />
24<br />
1.0<br />
1.0<br />
1.1<br />
1.1<br />
1.1<br />
1.1<br />
1.2<br />
1.2<br />
1.2<br />
1.3<br />
1.3<br />
1.3<br />
1.1<br />
7.1<br />
7.3<br />
7.5<br />
7.6<br />
7.7<br />
7.8<br />
7.9<br />
8.0<br />
8.1<br />
8.3<br />
8.4<br />
8.5<br />
9.0<br />
8.1<br />
8.3<br />
8.5<br />
8.7<br />
8.8<br />
9.0<br />
9.1<br />
9.2<br />
9.4<br />
9.5<br />
9.7<br />
9.8<br />
10.1<br />
9.1<br />
9.4<br />
9.6<br />
9.8<br />
10.0<br />
10.1<br />
10.3<br />
10.5<br />
10.6<br />
10.8<br />
10.9<br />
11.1<br />
11.2<br />
10.2<br />
10.4<br />
10.7<br />
10.9<br />
11.1<br />
11.3<br />
11.5<br />
11.7<br />
11.8<br />
12.0<br />
12.2<br />
12.4<br />
12.3<br />
11.3<br />
11.5<br />
11.8<br />
12.0<br />
12.3<br />
12.5<br />
12.7<br />
12.9<br />
13.1<br />
13.3<br />
13.5<br />
13.7<br />
14.0<br />
12.4<br />
12.7<br />
13.0<br />
13.2<br />
13.5<br />
13.7<br />
13.9<br />
14.1<br />
14.4<br />
14.6<br />
14.8<br />
15.0<br />
15.7<br />
13.5<br />
13.8<br />
14.1<br />
14.4<br />
14.7<br />
14.9<br />
15.2<br />
15.4<br />
15.6<br />
15.8<br />
16.0<br />
16.2<br />
17.4<br />
1.1<br />
1.1<br />
1.2<br />
1.2<br />
1.2<br />
1.2<br />
1.2<br />
1.2<br />
1.3<br />
1.3<br />
1.3<br />
1.3<br />
1.7<br />
standards for weight-for-age we see that<br />
the “average” healthy boy of 19 months<br />
should weigh 11.7 kilograms. Since this<br />
child is obviously under the mean of 11.7<br />
kilograms, we need to check the lower<br />
standard deviation value (remember: with<br />
weight-for-age the lower and upper<br />
standard deviations might differ!). It is 1.2<br />
kilograms. With these two pieces of<br />
information, we can calculate the Z-score<br />
of a child’s weight-for-age, using the<br />
following procedures:<br />
Subtract the mean weight from the actual<br />
weight of the child. The results in this case<br />
will be negative.<br />
Example: 9.8 kg - 11.7 kg = -1.9<br />
Divide the result by the standard deviation<br />
for the child’s age and gender.<br />
Example: -1.9 / 1.2 sd = -1.58 SD units<br />
The resulting number is the Z-score for<br />
that child.<br />
Example: The Z-score for a 19 month old<br />
boy who weighs 9.8 kg is -1.58 standard<br />
deviation units.<br />
This procedure can be repeated with the<br />
appropriate graphs or tables to calculate<br />
the Z-scores for length-for-age and<br />
weight-for-height.<br />
Percent of the Median<br />
Procedure<br />
For this example, we will assume we have<br />
just measured the length of a girl who is<br />
24 months old. This girl is 64.9 cm long.<br />
We want to use percentages of the median<br />
to compare her to the reference standards.<br />
Using the percentile distribution for the<br />
appropriate index (weight-for-age, lengthfor-age<br />
or weight-for-length) and sex, find<br />
the measurement that corresponds to the<br />
50th percentile (remember the 50th<br />
percentile is the same as the median).<br />
Example: From a table of reference<br />
values we learn that the 50th percentile<br />
length measurement for a 24 month old<br />
girl is 86.5 cm.<br />
Divide the measurement of the individual child<br />
by the appropriate median measurement.<br />
Example: Our girl is 64.9 cm.<br />
The median value for girls is 86.5 cm.<br />
64.9 cm / 86.5 cm = .75<br />
Multiply this fraction by 100, to convert it<br />
to a percentage.<br />
Example: 0.75 x 100 = 75%<br />
9.<br />
65
A 24 month old girl who is 64.9 cm long is<br />
75 percent of the median. The procedure<br />
would be the same for a child who has a<br />
measurement that is larger than the<br />
median. That child would, however, be<br />
over 100 percent of the median.<br />
The main disadvantage of this system is<br />
the lack of exact correspondence with a<br />
fixed point of the distribution across age or<br />
height status. For example, depending on<br />
the child’s age, 80% of the median weightfor-age<br />
might be above or below<br />
-2 Z-scores. In terms of health, being<br />
below or above -2 Z-scores this would<br />
result in a different classification of risk.<br />
In addition, typical cut-offs for percent of<br />
median are different for different<br />
anthropometric indices.<br />
To approximate a cut-off of -2 Z-scores,<br />
the usual cut-off for low height-for-age is<br />
90%, and for low weight-for-height and<br />
low weight-for-age 80% of the median.<br />
standard deviation unit (you should notice<br />
that the number of centimeters in one<br />
standard deviation unit generally<br />
increases as age goes up).<br />
In the example of a 3 month old boy,<br />
we can see under the mean column in the<br />
table, that 61.1 cm is the expectation for a<br />
healthy boy. If we had measured a 3<br />
month old boy who was 2.6 cm under this<br />
expectation (or 58.5 cm), we would find<br />
that this measurement falls exactly 1<br />
standard deviation unit under the mean.<br />
Therefore, we could state that this<br />
individual child is -1 standard deviation<br />
from the mean or average (expectation)<br />
for length-for-age. A 12 month old boy<br />
who measured 2.7 cm under the<br />
expectation for his age (or 73.4 cm), would<br />
also be 1 standard deviation unit under<br />
the mean length-for-age, for his age.<br />
Standard deviation provides an easy way<br />
to tell what measurements are of equal<br />
concern when we are measuring boys and<br />
girls of different ages.<br />
The table below is the reference for<br />
length-for-age for boys aged 0-12 months.<br />
The value given in the “Mean” column is<br />
the average length in centimeters that we<br />
would expect for a healthy boy at each age.<br />
Age in months is given in the far left-hand<br />
column. The column next to it shows the<br />
number of centimeters needed to equal 1<br />
Length (cm) for age (months) distribution by standard deviation for boys<br />
Age Group<br />
(months)<br />
Lower<br />
S.D.<br />
-3<br />
S.D.<br />
-2<br />
S.D.<br />
-1<br />
S.D.<br />
Mean<br />
+1<br />
S.D.<br />
+2<br />
S.D.<br />
+3<br />
S.D.<br />
Upper<br />
S.D.<br />
9.<br />
0<br />
1<br />
2<br />
3<br />
4<br />
5<br />
6<br />
7<br />
8<br />
9<br />
10<br />
11<br />
12<br />
2.3<br />
2.5<br />
2.6<br />
2.6<br />
2.7<br />
2.7<br />
2.7<br />
2.7<br />
2.7<br />
2.6<br />
2.6<br />
2.7<br />
2.7<br />
43.6<br />
47.2<br />
50.4<br />
53.2<br />
55.6<br />
57.8<br />
59.8<br />
61.5<br />
63.0<br />
64.4<br />
65.7<br />
66.9<br />
68.0<br />
45.9<br />
49.7<br />
52.9<br />
55.8<br />
58.3<br />
60.5<br />
62.4<br />
64.1<br />
65.7<br />
67.0<br />
68.3<br />
69.6<br />
70.7<br />
48.2<br />
5<strong>2.1</strong><br />
55.5<br />
58.5<br />
61.0<br />
63.2<br />
65.1<br />
66.8<br />
68.3<br />
69.7<br />
71.0<br />
72.2<br />
73.4<br />
50.5<br />
54.6<br />
58.1<br />
61.1<br />
63.7<br />
65.9<br />
67.8<br />
69.5<br />
71.0<br />
72.3<br />
73.6<br />
74.9<br />
76.1<br />
52.8<br />
57.0<br />
60.7<br />
63.7<br />
66.4<br />
68.6<br />
70.5<br />
72.2<br />
73.6<br />
75.0<br />
76.3<br />
77.5<br />
78.7<br />
55.1<br />
59.5<br />
63.2<br />
66.4<br />
69.1<br />
71.3<br />
73.2<br />
74.8<br />
76.3<br />
77.6<br />
78.9<br />
80.2<br />
81.5<br />
57.3<br />
61.9<br />
65.8<br />
69.0<br />
71.7<br />
74.0<br />
75.9<br />
77.5<br />
78.9<br />
80.3<br />
81.6<br />
82.9<br />
84.2<br />
2.3<br />
2.5<br />
2.6<br />
2.6<br />
2.7<br />
2.7<br />
2.7<br />
2.7<br />
2.7<br />
2.6<br />
2.6<br />
2.7<br />
2.7<br />
66
REFERENCES PART 9.<br />
Uses of<br />
<strong>Anthropometric</strong> Data<br />
2.<br />
APPENDIX<br />
<strong>Anthropometric</strong> indicators can be<br />
classified according to the objectives of<br />
their use, which include the following (the<br />
order of listing is dictated by various<br />
methodological considerations discussed<br />
later):<br />
Identification of individuals or<br />
populations at risk. In general, this<br />
requires data based upon indicators of<br />
impaired performance, health or survival.<br />
Depending on the specific objective, the<br />
anthropometric indicators should:<br />
reflect past or present risk, or<br />
• predict future risk<br />
An indicator may reflect both present and<br />
future risk; for instance, an indicator of<br />
present malnutrition may also be a<br />
predictor of an increased risk of mortality<br />
in the future. However, a reflective<br />
indicator of past problems may have no<br />
value as a predictor of future risk; for<br />
example, stunting of growth in early<br />
childhood as a result of malnutrition may<br />
persist throughout life, but with age<br />
probably becomes less reliably predictive<br />
of future risk.<br />
<strong>Indicators</strong> of this type might be used in<br />
the risk approach to identification of<br />
health problems and potential<br />
interventions, although, the risk approach<br />
may have little value in predicting or<br />
evaluating the benefit derived from<br />
interventions.<br />
Selection of individuals or populations<br />
for an intervention. In this application,<br />
indicators should predict the benefit to be<br />
derived from the intervention.<br />
The distinction between indicators of<br />
risk and indicators of benefit is not widely<br />
appreciated, yet it is paramount for<br />
developing and targeting interventions.<br />
Some indicators of present or future risk<br />
may also predict benefit, but this is not<br />
necessarily the case. Low maternal<br />
height, for example, predicts low birth<br />
weight, but, in contrast to low maternal<br />
weight in the same population, does not<br />
predict any benefit of providing an<br />
improved diet to pregnant women. By the<br />
same token, predictors of benefit may not<br />
be good predictors of risk.<br />
Anthropometry provides important<br />
indicators of overall socioeconomic<br />
development among the poorest members<br />
of a population. Data on stunting in<br />
children and adults reflects socioeconomic<br />
conditions that are not conducive to good<br />
health and nutrition. Thus stunting in<br />
young children may be used effectively to<br />
target development programs.<br />
Evaluation of the effects of changing<br />
nutritional, health, or socioeconomic<br />
influences, including interventions. For<br />
this purpose indicators should reflect<br />
responses to past and present<br />
interventions. This is the case with Title II<br />
program evaluations.<br />
9.<br />
67
Change in weight-for-height (wasting) is a<br />
good example of an indicator of shortterm<br />
response in a wasted child being<br />
treated for malnutrition, whereas a<br />
decrease in the prevalence of stunting at<br />
the population level is a long-term<br />
indicator that social development is<br />
benefiting the poor as well as the<br />
comparatively affluent. On the other<br />
hand, a decrease in the prevalence of low<br />
birth weight might be used to indicate<br />
success in such activities as controlling<br />
malaria during pregnancy.<br />
In describing an indicator of response,<br />
the possible lag between the start of an<br />
intervention and the time when a<br />
response becomes apparent is an<br />
important consideration. At the individual<br />
level, a wasted infant will respond to<br />
improved nutrition first by putting on<br />
weight and then by “catching up” in linear<br />
growth. At the population level, however,<br />
decades may elapse before improvements<br />
can be seen in adult height.<br />
Excluding individuals from high-risk<br />
treatments, from employment or from<br />
certain benefits. Decisions regarding an<br />
individual’s inclusion in, or exclusion<br />
from, a high-risk treatment protocol,<br />
consideration for employment in a<br />
particular setting (e.g. an occupation<br />
requiring appreciable physical strength),<br />
or admission to certain benefits (e.g. low<br />
life-insurance rates) depend on indicators<br />
that predict a lack of risk.<br />
<strong>Anthropometric</strong> indicators of lack of<br />
risk were once presumed to be the same<br />
as those that predict risk, but recent work<br />
has revealed that this is not invariably the<br />
case. Studies have found that indicators of<br />
poor growth were less effective in<br />
predicting adequate growth than other<br />
indicators.<br />
poor health or increased risk of mortality,<br />
and if this were true, advocacy for the<br />
need for weight control in this age group<br />
would be based solely on normative<br />
distributions.<br />
Research purposes that do not involve<br />
decisions affecting nutrition, health, or<br />
well-being. The indicator requirements<br />
for these objectives, whether they concern<br />
individuals or whole populations, are<br />
generally beyond the scope of this guide.<br />
There may be differences in the<br />
interpretation of anthropometric<br />
indicators when applied to individuals<br />
or to populations. For example, while a<br />
reflective indicator, such as the presence<br />
of marasmus, signifies malnutrition in a<br />
given child today, a sudden increase of<br />
marasmus in a population may be<br />
predictive of future famine.<br />
The appropriateness of indicators thus<br />
depends on the specific objectives of their<br />
use, and research is only just beginning to<br />
address this specificity and its<br />
implications. Little is known, for example,<br />
about how the use of different cut-offs for<br />
anthropometric indicators fulfills different<br />
objectives.<br />
9.<br />
Achieving normative standards.<br />
Assessing achievement of normative<br />
standards requires indicators that reflect<br />
“normality”.<br />
Some activities appear to have no<br />
objectives beyond encouraging individuals<br />
to attain some norm. For instance,<br />
some have argued that moderate obesity<br />
among the elderly is not associated with<br />
68
REFERENCES PART 9.<br />
Selecting<br />
a Sample<br />
3.<br />
APPENDIX<br />
Sampling is the process that is used to<br />
select a representative group of individuals<br />
whose characteristics can be described and<br />
used to represent the whole population.<br />
The following section outlines a few of the<br />
problems that can result from incorrect<br />
sampling.<br />
Sampling Error<br />
A lot of thought should go into how to<br />
select the sample, and the following<br />
examples illustrate this.<br />
Example: You are interested in doing a<br />
survey that will gather information on the<br />
prevalence of underweight children<br />
between 6 and 35 months and on the<br />
characteristics of their households. Each<br />
village that you will be conducting surveys<br />
in has a clinic where mothers and their<br />
children can be found on certain days of<br />
the week. The clinics already have scales,<br />
which would make them convenient. You<br />
decide to go to the clinics and measure all<br />
the children found there. Is this a good<br />
sampling plan for conducting your survey<br />
The answer is no. Mothers who go to<br />
the clinic are considered self-selecting.<br />
The mothers who decide to go to the clinic<br />
might have reasons for going that would<br />
make them different from mothers who do<br />
not go to the clinic. They might be more<br />
concerned with their child’s health. Or<br />
they might be mothers who have sicker<br />
children. Or they might be mothers who<br />
do not have to work everyday and<br />
therefore have the time to take their<br />
children to the clinic.<br />
Any characteristic that makes an<br />
individual do something may also make<br />
them different from the population as a<br />
whole and have an effect on their<br />
children’s nutritional status. When you<br />
have a sample that is made up of people<br />
who are not representative of the<br />
population for a certain reason, you have<br />
what is called sampling bias. This type of<br />
sampling error can happen when you<br />
select a sample from a group who all go to<br />
a specific place, but it can also happen if<br />
the sample is from one area of a village or<br />
a city or among people who are neighbors.<br />
These individuals may share some<br />
characteristic that makes them more<br />
similar to each other than to the larger<br />
population.<br />
Here are some tips for avoiding this type of<br />
sampling error:<br />
• Do not choose samples exclusively<br />
from particular groups, such as children<br />
coming to clinics.<br />
• Do not ask mothers to bring their<br />
children to a central point in the<br />
community, because some of them will<br />
not come; you will not be able to find out<br />
how many failed to appear and how<br />
different they may be from those who<br />
came.<br />
• Do not use samples chosen at will by<br />
the interviewer, field supervisor or field<br />
director.<br />
9.<br />
69
9.<br />
• Do not restrict your sample to families<br />
living in easily accessible households,<br />
such as those close to a main road or near<br />
a village center; families living in less<br />
accessible areas may be poorer and less<br />
healthy.<br />
• Do not omit households where no one<br />
is at home the first time you call.<br />
Sampling error can also happen if the<br />
sample size is not large enough.<br />
Sample Size<br />
Factors influencing sample size decisions<br />
The sample size required for a given<br />
survey is determined by its measurement<br />
objectives. For surveys designed to either<br />
measure changes in indicators over time<br />
or differences in indicators between<br />
project and control areas, the required<br />
sample size for a given indicator for each<br />
survey round and/or comparison group<br />
depends upon five factors:<br />
• how numerous the measurement units<br />
for the indicator are in the target<br />
population;<br />
• the initial or “baseline” level of the<br />
indicator;<br />
• the magnitude of change or<br />
comparison group differences on the<br />
indicator it is desired to be able to reliably<br />
measure;<br />
• the degree of confidence with which it<br />
is desired to be certain that an observed<br />
change or comparison-group difference of<br />
the magnitude specified above would not<br />
have occurred by chance (that is, the level<br />
of statistical significance); and<br />
• the degree of confidence with which it<br />
is desired to be certain of measuring an<br />
actual change or difference of the<br />
magnitude specified above will be<br />
detected (i.e., statistical power).<br />
Note that the first two of these parameters<br />
are population characteristics, while the<br />
last three are chosen by the evaluator/<br />
survey designer.<br />
An example using changes in<br />
nutritional status:<br />
To illustrate how these parameters enter<br />
into the determination of sample size<br />
requirements, consider an evaluation<br />
where changes in indicators for the<br />
project area are being measured over time<br />
(i.e., a one-group pretest-post-test or<br />
reflexive design). For such an evaluation,<br />
the objectives for sample size<br />
determination purposes might be stated in<br />
terms of a key indicator as follows: to be<br />
able to measure a decrease of 20<br />
percentage points in the proportion of<br />
children 6-59 months of age who are<br />
stunted with 95% confidence and 80%<br />
power. Thus, if the estimated proportion<br />
of children who were stunted at the time<br />
of the baseline survey was 40%, the<br />
objective would be to measure a change in<br />
the prevalence of stunted children from<br />
40% to 20% and be (1) 95% confident that<br />
a decline of this magnitude would not<br />
have occurred by chance and (2) 80%<br />
confident of detecting such a decline if one<br />
actually occurred. The sample size<br />
calculations would answer the questions<br />
(1) how many children ages 6-59 months<br />
would be required to accomplish the<br />
above objectives and (2) how many<br />
households would have to be chosen in<br />
order to find this number of children.<br />
For evaluation designs involving comparisons<br />
between project and control<br />
areas, the objectives are framed in terms<br />
of the magnitude of differences between<br />
the two groups it is desired to be able to<br />
reliably detect. For example, in a reflexive<br />
evaluation design, sample size requirements<br />
might be set to detect a difference<br />
between project and control areas of 20<br />
percentage points on a specified indicator.<br />
Similarly, when a pre- and post-test<br />
design with treatment and control areas is<br />
to be used, the sample size would be set to<br />
ensure that a difference in the degree of<br />
change on a key indicator between project<br />
and control areas of a specified magnitude<br />
(e.g., 20 percentage points) could be<br />
reliably detected.<br />
70
REFERENCES PART 9.<br />
Figure A3.1. Illustrative informational needs for determining sample size, generic<br />
Title II "health" indicators<br />
A. Information on population composition:<br />
1. Mean number of persons per household<br />
2. Proportion of total population that are:<br />
a. Children under 0-59 months of age.<br />
b. Children under 24 months of age.<br />
c. Infants under 6 months of age.<br />
d. Infants between the ages of 6 and 10 months.<br />
B. Information about "expected" levels or rates in the target population:<br />
1. Proportion of children aged 6-59 months who are stunted.<br />
2. Proportion of children aged 6-59 months who are underweight.<br />
Steps involved in determining survey sample size requirements for a given survey:<br />
• Calculating the number of sample elements required in order to satisfy the measurement requirements for<br />
a given indicator, and how many households would have to be contacted in order to find the number of<br />
elements needed in the first step.<br />
a. For indicators expressed as proportions:<br />
The following formula may be used to calculate the required sample size for indicators expressed as a<br />
percentage or proportion. Note that the sample sizes obtained are for each survey round or each comparison<br />
group:<br />
alpha = ∞ beta = ß<br />
n = D [(Z∞ + Zß) 2 * (P1 (1 - P1) + P2 (1 - P2)) /(P2 - P1) 2 ]<br />
or n = D [(Z alpha + Z beta) squared times (P one times (1 minus P one) plus P two times (1 minus P two))<br />
divided by (P two minus P one) squared]<br />
Where:<br />
n = required minimum sample size per survey round or comparison group;<br />
D = design effect;<br />
P1 = P one, the estimated level of an indicator measured as a proportion at the time of the first survey or for<br />
the control area;<br />
P2 = P two, the expected level of the indicator either at some future date or for the project area such that the<br />
quantity (P2 - P1) is the size of the magnitude of change it is desired to be able to detect;<br />
Z∞ = Z alpha, is the Z-score corresponding to the degree of confidence with which it is desired to be able to<br />
conclude that an observed change of size (P2 - P1) would not have occurred by chance; and<br />
Zß = Z beta, is the Z-score corresponding to the degree of confidence with which it is desired to be certain of<br />
detecting a change of size (P2 - P1) if one actually occurred.<br />
* refers to a multiplication.<br />
Standard values of Z alpha (Z∞ ) and Z beta (Zß ) are provided in Figure A5.2, and the use of the above formula<br />
is illustrated in Figure A5.3. The different parameters in the formula are discussed below.<br />
9.<br />
71
Figure A3.2. Values of Z alpha (Z∞) and Z beta (Zß)<br />
alpha ∞<br />
.90<br />
.95<br />
.975<br />
.99<br />
One-tailed test<br />
1.282<br />
1.645<br />
1.960<br />
2.326<br />
Two-tailed test<br />
1.645<br />
1.960<br />
2.240<br />
2.576<br />
beta ß<br />
.80<br />
.90<br />
.95<br />
.975<br />
.999<br />
Z beta Z ß<br />
0.840<br />
1.282<br />
1.645<br />
1.960<br />
2.320<br />
Figure A3.3. Illustrative sample size calculations for indicators expressed as proportions<br />
Example 1<br />
Suppose that it were desired to measure a decrease in the prevalence of underweight (weight-for-age) of 10<br />
percentage points. At the time of the first survey, it is thought that about 40 percent of children between 12<br />
and 36 months were underweight. Thus, P1 = .40 and P2 = .30. Using ‘standard’ parameters of 95 percent level<br />
of significance and 80 percent power, values from Figure A5.2 of alpha (∞) = 1.645 (for a one-tailed test - see<br />
below for further discussion) and beta (ß) = 0.840 are chosen. Inserting these values into the above formula,<br />
we obtain:<br />
n = 2 [(1.645 + 0.840) 2 * ((.3)(.7) + (.6)(.4))] / (.3 - .4) 2<br />
= 2 [(6.175 * 0.45)] / .01<br />
= 2 * [2.77875] / .01 = 2 (277.875) = 555.75<br />
or 556 households per survey round.<br />
Figure A3.4 provides a "lookup" table based upon the above formula to permit sample sizes to be chosen<br />
without having to perform calculations. The table provides sample sizes needed to measure changes/differences<br />
in a given indicator of specified magnitudes P two minus P one (P2 - P1) for different initial levels of the<br />
indicator (P1). The table is for values of alpha (∞) = 0.95 and beta (ß) = 0.80.<br />
Figure A3.4. Sample sizes required for selected combinations of P one (P1) and changes<br />
or comparison-group differences to be detected (for alpha (∞) = .95 and beta (ß) = .80)<br />
Change/difference to be detected (P2 - P1) (P two minus P one)<br />
P one<br />
P1<br />
.05<br />
.10<br />
.15<br />
.20<br />
.25<br />
.30<br />
.10<br />
.15<br />
.20<br />
.25<br />
.30<br />
.35<br />
.40<br />
.45<br />
.50<br />
1,075<br />
1,420<br />
1,176<br />
1,964<br />
2,161<br />
2,310<br />
2,408<br />
2,458<br />
2,458<br />
309<br />
389<br />
457<br />
513<br />
556<br />
587<br />
606<br />
611<br />
606<br />
152<br />
185<br />
213<br />
235<br />
251<br />
262<br />
268<br />
268<br />
262<br />
93<br />
110<br />
124<br />
134<br />
142<br />
147<br />
148<br />
147<br />
142<br />
63<br />
73<br />
81<br />
57<br />
90<br />
92<br />
92<br />
90<br />
87<br />
45<br />
52<br />
56<br />
60<br />
62<br />
62<br />
62<br />
60<br />
56<br />
9.<br />
Note: sample sizes shown assume a design effect of 2.0 and one-tailed tests. In a study of population-based cluster surveys to<br />
determine the design effects Katz (AJCN, 1995 Jan; 61(1):155-60) found the design effect range from 0.44 to 2.59. The use of<br />
D=2.0, therefore is conservative. For values of P one (P1) greater than .50, use the value in the table that differs from .50 by<br />
the same amount. For example, for P one (P1 ) = .60, use the value for P one (P1 ) = .40; for P one (P1 ) = .70, use the value for<br />
P one (P1 ) = .30.<br />
72
REFERENCES PART 9.<br />
For indicators expressed as means or totals<br />
For indicators that are means or totals, the following formula may be used to calculate sample size<br />
requirements for each survey round or comparison group:<br />
n = D [(Z∞ + Zß) 2 * (sd1 2 + sd2 2 ) / (X2 - X1) 2 ]<br />
(n equals D time [(Z alpha plus Z beta) squared times (sd one squared + sd two squared) divided<br />
(X two minus X minus) squared]<br />
Where:<br />
n = required minimum sample size per survey round or comparison group;<br />
D = design effect;<br />
Z∞ = Z alpha the Z-score corresponding to the degree of confidence with which it is desired to be able to<br />
conclude that an observed change of size (X2 - X1) would not have occurred by chance;<br />
Zß = Z beta the Z-score corresponding to the degree of confidence with which it is desired to be certain of<br />
detecting a change of size (X2 - X1) if one actually occurred;<br />
sd1 and sd2 = "expected" standard deviations for the indicators for the respective survey rounds or comparison<br />
groups being compared;<br />
X1 = X one is the estimated level of an indicator at the time of the first survey or for the control area; and<br />
X2 = X two is the expected level of the indicator either at some future date or for the project area such that<br />
the quantity (X2 - X1) is the size of the magnitude of change or comparison-group differences it is desired to be<br />
able to detect.<br />
The primary difficulty in using the above formula is that it requires information on the standard deviation of the<br />
indicator being used in the sample size computations. The preferred solution to this problem would be to use<br />
values from a prior survey that had been undertaken in the setting in which a program under evaluation is being<br />
carried out. If such data are not available, data from another part of the country or a neighboring country with<br />
similar characteristics may be used. Such data are often presented in survey reports.<br />
9.<br />
73
APPENDIX<br />
4.Measuring<br />
Adults<br />
9.<br />
The use of indicators of adult nutritional<br />
status for evaluating and monitoring<br />
USAID Title II development programs is<br />
limited. There is some experience with<br />
micronutrient status including anemia<br />
and Vitamin A and more with assessing<br />
body mass index for women. This section<br />
does not deal with obesity, micronutrient<br />
malnutrition or pregnancy. The information<br />
in this section refers to anthropometric<br />
assessment and is derived from<br />
various sources including FAO, WHO and<br />
the recent publication from the ACC/SCN<br />
available from their website:<br />
acc.unsystem.org/scn/.<br />
Adults are defined by WHO as those in<br />
the age range of 25-60 years although<br />
categories often extend from 20 years to 65<br />
years of age. Adult anthropometrics have<br />
not been standardized in terms of<br />
reference data or choice of indicators for<br />
risk and response assessment as they have<br />
been for children. As noted in various<br />
sources, there is no recommended<br />
indicator or assessment approach for adult<br />
nutritional status. The assessment of<br />
adults older than 60 years presents a<br />
number of specific challenges not covered<br />
here. The reader is referred to the work of<br />
Help Age to deal with these assessments<br />
(Ismail, S. and Manandhar, M. 1999).<br />
As with children, adult anthropometric<br />
assessment is used to reflect undernutrition.<br />
Anthropometry is also used to<br />
reflect over nutrition but this is not the<br />
focus of this guide. Undernutrition in<br />
adults is characterized by patterns of acute<br />
and chronic deficiency of energy, protein<br />
and micronutrients including vitamins<br />
and minerals. Often a person is affected<br />
by both acute and chronic deficiency in all<br />
or some of the key nutrients. The<br />
manifestation of the deficiency and the<br />
measurement is therefore, complicated to<br />
determine and the functional significance<br />
unclear. Undernutrition is characterized<br />
by a lack of food and while specific<br />
nutrient deficiencies occur, such as<br />
pellagra due to a lack of niacin, the<br />
primary cause is more general. We are<br />
learning more about specific nutrient<br />
requirements for diseases such as HIV/<br />
AIDS but the ability of anthropometrics to<br />
identify these conditions is limited.<br />
Adult anthropometric assessment is used<br />
for several purposes including:<br />
• screening or targeting individuals for<br />
some sort of intervention or action such as<br />
supplementary feeding during famine<br />
relief,<br />
• surveillance or monitoring of changes<br />
in prevalence and coverage in groups or<br />
populations to trigger a response<br />
including graduating from an intervention,<br />
• evaluating the impact of activities or<br />
interventions.<br />
Anthropometry is used to describe the<br />
nutritional situation in a population and<br />
this can be useful for problem analysis<br />
and for evaluation. Because the deter-<br />
74
REFERENCES PART 9.<br />
minants of nutrition are so many, it is<br />
important to examine other factors than<br />
just anthropometry such as the food<br />
security situation, levels of illness, care<br />
giving practices and so on.<br />
For assessing women’s nutrition status,<br />
usually, a combination of indicators is<br />
needed. Unlike children, reference data<br />
have not been standardized for women. For<br />
cross-sectional comparisons, reference<br />
data can be gathered from within the same<br />
population that the intervention group<br />
belongs to among healthy women, women<br />
with positive pregnancy outcomes.<br />
Construction of an adult nutrition reference<br />
has been done for some populations.<br />
Each anthropometric indicator listed for<br />
adults and especially for women has its<br />
own advantages and limitations. To<br />
determine the best indicator, one should<br />
consider the objectives of the nutrition<br />
program and its associated reporting<br />
requirements. Several possible uses of<br />
indicators are:<br />
4.1 Height<br />
Adults are not growing in stature. Height<br />
in adults is determined by a person’s<br />
genetic potential and the health and<br />
nutrition experiences dating back to the<br />
fetus. Most growth in height is completed<br />
by age 17 with some incremental growth<br />
for another 10 years. Height, therefore,<br />
may be useful for a reflection of past<br />
events and be used in some screening<br />
situations, but will not be able to reflect<br />
recent or current nutritional shocks or<br />
change. Women’s height is a useful<br />
predictor of pregnancy outcomes such as<br />
low birth weight and possible delivery<br />
complications; thus it is an indicator of<br />
risk. Because height will change very little<br />
among adult women, it is not useful for<br />
evaluating interventions (outcome).<br />
Height can not be used for monitoring and<br />
evaluation of programs.<br />
Adult Measuring Device (Microtoise) -<br />
(UNICEF No. 0114400 Height measuring<br />
instrument (0-2 m)) This lightweight<br />
portable tape is wall mounted and fits<br />
easily into the package needed for field<br />
measurements. Made of plastic, the<br />
Microtoise measures up to 2 meters and is<br />
available for approximately $US20. Refer<br />
to the local UNICEF office for<br />
procurement options.<br />
Adult Measuring Device - An<br />
inexpensive height measuring device<br />
useful for children over 24 months and<br />
adults is the Harpenden pocket<br />
stadiometer (range 0-2m) available from<br />
CMS weighing equipment. The cost is<br />
approximately $US100. CMS Weighing<br />
Equipment, Ltd., 18 Camden High School,<br />
London NW1 OJH, U.K.; Telephone: 01-<br />
387-2060 (international) +44 171 387 2060.<br />
4.2 Weight<br />
Weight does change reflecting recent<br />
events. For monitoring change in an<br />
individual, weight change is helpful as<br />
height would not be expected to change.<br />
For controlled studies where the same<br />
participants are being followed and height<br />
would not be changing, weight can be<br />
used for screening and evaluation<br />
purposes. More than one measurement is<br />
necessary for tracking changes.<br />
For women who are pregnant, weight<br />
gains of 1.5 kg/month during the last two<br />
trimesters are consistent with positive<br />
pregnancy outcomes in developing<br />
countries. Short maternal stature, low<br />
pregnant BMI and poor weight gain<br />
during pregnancy are all indicators of risk<br />
for low birth weight. As stated above, not<br />
all of these are indicators of outcome.<br />
For comparing within or across<br />
groups, an interpretation of weight change<br />
needs to be done controlling for the<br />
variation in height. The most common<br />
indicator used to control for height and to<br />
reflect body mass is referred to as the body<br />
mass index (BMI). There are limitations<br />
in the use of this indicator.<br />
Scales are used to weigh adults and can be<br />
obtained from various sources. Ensure<br />
the scale is sturdy, reliable and accurate.<br />
9.<br />
75
9.<br />
UNICEF Electronic Scale - (Item No.<br />
0141015 Scale mother/child, electronic)<br />
The scale is manufactured by SECA and is<br />
a floor scale for weighing children as well<br />
as adults (capacity 150 kg). Weighing<br />
capacity from 1 kg to 150 kg in 100 g<br />
divisions, accuracy +/- 100 g. Weight of<br />
adult on scale can be stored (tared) in<br />
memory, allowing weight of baby or small<br />
child held by adult to show on scale<br />
indicator. Solar cell on-switch (light<br />
sensitivity 15 lux). Powered by long-life<br />
lithium battery, good for one million<br />
weighing cycles. Portable, weight 4 kg.<br />
Instructions in English, French and<br />
Spanish.<br />
The major advantage is that it has a<br />
micro-computer chip so that it can adjust<br />
itself to zero and weighs people quickly<br />
and accurately. The child may be weighed<br />
directly, if possible. If a child is frightened,<br />
the mother can first be weighed alone and<br />
then weighed while holding the child in<br />
her arms, and the scale will automatically<br />
compute the child’s weight by subtraction.<br />
Recent experience in surveys suggests that<br />
the scale is appropriate for Cooperating<br />
Sponsor use although some difficulty has<br />
been experienced with heat adversely<br />
affecting the scale. The price of this scale<br />
is US$90 and it can be ordered from<br />
UNICEF's Supply Division in Copenhagen<br />
through any UNICEF field office.<br />
www.supply.unicef.dk/catalogue/index.htm<br />
BMI is based on a weight-to-height ratio<br />
that is considered a good index of body fat<br />
and protein stores. Body stores are of<br />
interest because they reflect the stores<br />
needed to cope with physiological stress<br />
due to reduced intake and increased<br />
demands due to increased activity,<br />
pregnancy and diseases. Adults who have<br />
a healthy nutritional status would be<br />
expected to have body stores or BMI<br />
within a certain range. BMI - also known<br />
as "Quetelet’s index” - is summarized<br />
below:<br />
Body mass index (BMI) = weight/(height) 2<br />
The formula for BMI is the weight (in<br />
kilograms) divided by the height (in<br />
meters) squared. A woman who weighs<br />
55.5 kgs and a height of 162.5 cm would<br />
have a BMI of ((55.5/(1.625 x 1.625)) =<br />
20.9.<br />
It is best used for individuals between the<br />
ages of 20 and 65 years.<br />
While no standard classification system<br />
exists, the following was recommended by<br />
Collins et al. (2000) for chronically<br />
undernourished populations.<br />
Table A4.1. Body Mass Index Categories<br />
of Chronic Undernutrition<br />
Normal >= 18.5<br />
Grade I 17.0 – 18.4<br />
Grade II 16.0 – 16.9<br />
Grade III
REFERENCES PART 9.<br />
The correction from Collins et al. (2000)<br />
for standardizing BMI using the Cormic<br />
Index (SH/S percentage) applies the<br />
following formula:<br />
Male BMI = 0.78 (SH/S) – 18.43<br />
Females BMI = 1.19 (SH/S) – 40.34<br />
The reader is referred to Collins et al.<br />
(2000) for the use of the Cormic Index for<br />
comparing across population groups<br />
where an average for the Cormic Index<br />
can be used. For individuals, their own<br />
Cormic Index should be used to correct<br />
the BMI.<br />
BMI changes during pregnancy. It will be<br />
necessary to separate pregnant women<br />
from non-pregnant women when comparing<br />
BMI.<br />
In summary:<br />
• For comparisons within populations<br />
over relative short times for evaluation<br />
purposes, BMI should not require a<br />
correction using the Cormic Index.<br />
• Assessing or screening individuals for<br />
targeting using BMI should correct the<br />
individuals BMI using the Cormic Index<br />
for that individual.<br />
The authors of the ACC/SCN review<br />
(Collins et al., 2000) conclude that in<br />
situations of emergency screening, the<br />
measurement of height and sitting height<br />
and the use of the Cormic Index correction<br />
is time consuming and mostly unrealistic.<br />
In situations of famine relief, they caution<br />
that without the standardization with the<br />
Cormic Index, the use of BMI alone for<br />
screening is inappropriate. BMI<br />
measured during emergency situations<br />
requires good equipment, well-trained<br />
personnel and an ability to convert the<br />
measures into the BMI. Challenges in<br />
measuring people who are very sick,<br />
elderly and disabled may make the use of<br />
BMI for screening even more difficult.<br />
In addition to a Cormic Index correction,<br />
the age distribution is important. As<br />
people grow older, the distribution of fat<br />
and fat free mass (water, bone and<br />
muscle) changes. For screening purposes,<br />
BMI may have to be adjusted for age.<br />
There is no guidance for this at the<br />
moment. For evaluation purposes, as long<br />
as the distribution of age in the baseline<br />
and follow up remain the same, the biases<br />
will be consistent and age should not<br />
confound the analysis of change. Where<br />
age is a potential confounding variable,<br />
data may have to be presented for age<br />
group which has assessment implications<br />
(not all respondents know their ages) and<br />
sample size estimations (stratification of<br />
the sample increases size requirements).<br />
4.3 Mid-upper arm circumference<br />
(MUAC)<br />
MUAC is the circumference of the left<br />
upper arm measured in centimeters. The<br />
point is between the tip of the shoulder<br />
and the elbow. The use of MUAC and the<br />
equipment for the measurement is<br />
detailed in section 5 of this <strong>Guide</strong>. Arm<br />
circumference is measured with special<br />
circumference measuring tapes or<br />
circumference insertion tapes.<br />
Because the equipment is lightweight<br />
and training to do MUAC is<br />
straightforward, MUAC is utilized for<br />
screening in emergency situations when<br />
nutritional status information is needed<br />
immediately for large groups of people,<br />
especially children. The indicator is useful<br />
for assessing acute adult undernutrition<br />
and for assessing the prevalence of<br />
undernutrition at the population level.<br />
While arm circumference measures<br />
both muscle and fat, some populations<br />
would be expected to have very little<br />
subcutaneous fat on their arms. A low or<br />
decreasing arm circumference for these<br />
populations would signal the loss of<br />
muscle mass, a serious sign, possibly<br />
indicative of protein-energy malnutrition<br />
or starvation. MUAC is usually unaffected<br />
by edema common in famine, and is a<br />
sensitive reflection of tissue loss and is<br />
independent of height.<br />
The use of MUAC for emergency<br />
program screening has limitations. The<br />
choice of cutoffs is challenging as there is<br />
a lack of an understanding of the<br />
functional significance of different levels.<br />
9.<br />
77
Collins et al. (2000) recommends the<br />
following MUAC cutoffs for screening<br />
adult admissions to feeding centers.<br />
Table A4.2. MUAC cutoffs for Screening<br />
Moderate and Acute Adult Undernutrition<br />
Level of undernutrition<br />
Moderate
REFERENCES PART 9.<br />
Adolescent<br />
<strong>Anthropometric</strong><br />
<strong>Indicators</strong><br />
5.<br />
APPENDIX<br />
Adolescents are defined by WHO as those<br />
in the age range of 10 to 19 years. The<br />
nutritional status of this age group is<br />
difficult to assess because there is not a<br />
reference standard for adolescents and<br />
there is a growth spurt which occurs with<br />
puberty which occurs at different ages.<br />
This limits the ability to use a reference<br />
standard even if it is developed locally.<br />
The ACC/SCN has produced a paper on<br />
assessing nutrition status for emergencyaffected<br />
populations (Woodruff, and<br />
Duffield. Adolescents: Assessment of<br />
Nutritional Status in Emergency-Affected<br />
populations. SCN Geneva, July, 2000).<br />
acc.unsystem.org/scn<br />
The ACC/SCN recommends that due to<br />
a lack of validated anthropometric<br />
procedures for adolescents, anthropometry<br />
is not used without examining<br />
other population sub-groups and other<br />
determinants of nutrition and food<br />
security.<br />
As with children, adolescent<br />
anthropometric assessment is used to<br />
reflect undernutrition. Anthropometry is<br />
also used to reflect over nutrition but this<br />
is not the focus of this guide. Undernutrition<br />
in adolescents is characterized<br />
by patterns of acute and chronic<br />
deficiency of energy, protein and<br />
micronutrients including vitamins and<br />
minerals. Often a person is affected by<br />
both acute and chronic deficiency in all or<br />
some of the key nutrients. The<br />
manifestation of the deficiency and the<br />
measurement is, complicated to determine<br />
and the functional significance<br />
unclear. Undernutrition is characterized<br />
by a lack of food and while specific<br />
nutrient deficiencies occur, such as<br />
pellagra due to a lack of niacin, the<br />
primary cause is more general. We are<br />
learning more about specific nutrient<br />
requirements for diseases such as<br />
HIV/AIDS but the ability of anthropometrics<br />
to identify these conditions is<br />
limited.<br />
As with adults, adolescent anthropometric<br />
assessment is used for several purposes<br />
including:<br />
• screening or targeting individuals for<br />
some sort of intervention or action such as<br />
supplementary feeding during famine<br />
relief,<br />
• surveillance or monitoring of changes<br />
in prevalence and coverage in groups or<br />
populations to trigger a response including<br />
graduating from an intervention , and<br />
• evaluating the impact of activities or<br />
interventions.<br />
Anthropometry is used to describe the<br />
nutritional situation in a population and<br />
this can be useful for problem analysis<br />
and for evaluation. Because the<br />
determinants of nutrition are so many, it is<br />
important to examine other factors than<br />
just anthropometry such as the food<br />
security situation, levels of illness, care<br />
giving practices and so on.<br />
9.<br />
79
9.<br />
There are a number of recommendations<br />
for different purposes. The reader is<br />
cautioned that some of the recommendations<br />
(including WHO) are being<br />
questioned (see Woodruff and Duffield,<br />
2000). The complex physiological<br />
changes, pubertal development, interethnic<br />
differences in genetic growth<br />
potential, and the different determinants<br />
of body size and shape makes rigid<br />
recommendations difficult.<br />
The recommendations for emergency<br />
screening should be for indicators that are<br />
easy to measure and do not require<br />
cumbersome or complicated equipment<br />
and procedures. The indicator should be<br />
determined taking into account differences<br />
between the survey and reference<br />
populations in age, sexual development<br />
and ethnicity. Most commonly found<br />
measurements in emergency situations<br />
are weight, height and mid-upper-armcircumference<br />
(MUAC). Measuring height<br />
can be challenging especially in<br />
emergency situations and for severely<br />
malnourished people who are feeble and<br />
disabled, height measurement may be<br />
impossible. The presence of famine<br />
edema is a serious indicator of nutritional<br />
stress and the accumulation of fluid<br />
distorts weight measures. Any situation of<br />
edema would be an indication for a range<br />
of nutrition interventions.<br />
For targeting interventions and<br />
assessing the situation, thinness measures<br />
are recommended. Thinness can be<br />
reflected by percent median weight-forheight<br />
or BMI-for-age and the Rohrer<br />
Index. Thinness is especially of concern<br />
among those adolescents who have not yet<br />
finished their growth spurt. Pregnancy<br />
adds weight to the girl and will distort the<br />
various weight based measures. During<br />
pregnancy, measures of weight change<br />
and MUAC are recommended.<br />
For assessing response to an<br />
intervention for adolescents, BMI should<br />
be used for programs designed to reduce<br />
the prevalence of thinness. BMI can be<br />
compared to local reference data or<br />
changes from pre- and post-intervention<br />
can be compared.<br />
It should be stressed that there is a lack<br />
of data to relate the specific indicator and<br />
its cutoff with health or survival<br />
outcomes. This means that to define<br />
undernutrition in adolescents, we do not<br />
have evidence of the choice of indicator or<br />
cutoff that exists with children under the<br />
age of five years. Weight for height and<br />
BMI indicators need to be examined based<br />
on an accurate determination of age. This<br />
may not be possible in many situations<br />
where age is unknown.<br />
The ACC/SCN recommend that<br />
clinical criteria be used for screening for<br />
therapeutic feeding. Surveys, they<br />
suggest, should correct for different ages<br />
of sexual maturation if the age of<br />
maturation in the survey population<br />
differs from the reference population.<br />
This is likely if the reference population is<br />
from a developed country.<br />
The recommendation for screening in<br />
Pre-Pubertal Adolescents, is to use weight<br />
for height as the index of choice (using<br />
weight for height reference standards).<br />
For Post-Pubertal Adolescents, BMI<br />
should be used and compared with the<br />
international reference standards.<br />
Height-for-age. The measure for height<br />
for estimating stunting during adolescence<br />
is the same as it is for young<br />
children. Stunting reflects chronic malnutrition.<br />
The height is compared to the<br />
height of adolescents of the same sex and<br />
age in the NCHS reference population.<br />
Growth charts for the US are available at:<br />
www.cdc.gov/growthcharts/. The cut off<br />
of
REFERENCES PART 9.<br />
BMI-for-age. Median and less than<br />
median BMI-for-age varies little among<br />
well nourished populations. High<br />
percentage BMI at any age has shown<br />
variations and is a less accurate indicator<br />
for overweight assessment. BMI-for-age<br />
is also inaccurate for stunted individuals.<br />
Cut-off values are not well tested for<br />
assessing risk and response to<br />
interventions. Local reference standards<br />
should be developed. Growth charts for<br />
the US are available at<br />
www.cdc.gov/growthcharts/ but the<br />
ACC/SCN cautions on the use of these<br />
reference standards. It should be noted<br />
that BMI-for-age is not a straightforward<br />
concept and has not been examined for its<br />
ability to predict outcomes among<br />
malnourished adolescents.<br />
Rohrer Index (weight/height3) is<br />
calculated as the weight in kilograms<br />
divided by height in meters cubed. An<br />
adolescent girl weight 24.4 kilograms and<br />
is 132.3 cm tall would have a Rohrer<br />
Index of 10.5. There is some evidence that<br />
the Rohrer Index is less age dependent<br />
and can be used like BMI. There are no<br />
reference standards for the use of this<br />
index.<br />
Percent median weight-for-height. In<br />
the absence of strong, simple adolescent<br />
indicators, recommendations are to use<br />
percent of the median weight-for-height.<br />
Using weight-for-height has the limitation<br />
being an indicator of current or acute<br />
malnutrition. Because of its response to<br />
short-term influences, wasting is not used<br />
to evaluate Title II programs but may be<br />
used for screening or targeting purposes<br />
and is sometimes used for annual<br />
reporting.<br />
Because the equipment is lightweight and<br />
training to do MUAC is straightforward,<br />
MUAC is utilized for screening in<br />
emergency situations when nutritional<br />
status information is needed immediately<br />
for large groups of people, especially<br />
children. The indicator is useful for<br />
assessing acute adult undernutrition and<br />
for assessing the prevalence of<br />
undernutrition at the population level.<br />
While arm circumference measures<br />
both muscle and fat, some populations<br />
would be expected to have very little<br />
subcutaneous fat on their arms. A low or<br />
decreasing arm circumference for these<br />
populations would signal the loss of<br />
muscle mass, a serious sign, possibly<br />
indicative of protein-energy malnutrition<br />
or starvation. MUAC is usually unaffected<br />
by edema common in famine and is a<br />
sensitive reflection of tissue loss and is<br />
independent of height.<br />
The use of MUAC for emergency<br />
program screening has limitations. The<br />
choice of cutoffs is challenging as there is<br />
a lack of an understanding of the<br />
functional significance of different levels.<br />
No reference standards exist for MUAC.<br />
Careful training is required to ensure that<br />
the correct location is identified on the<br />
arm. This is especially important with<br />
rapidly growing adolescents. It is<br />
suggested that MUAC be presented by age<br />
category and sex.<br />
There are no recommended MUAC<br />
cutoffs for determining adolescent<br />
undernutrition or for admissions to<br />
feeding centers.<br />
Mid-upper arm circumference (MUAC)<br />
is the circumference of the left upper arm<br />
measured in centimeters. The point is<br />
between the tip of the shoulder and the<br />
elbow. The use of MUAC and the<br />
equipment for the measurement is<br />
detailed in section 5 of this <strong>Guide</strong>. Arm<br />
circumference is measured with special<br />
circumference measuring tapes or<br />
circumference insertion tapes.<br />
9.<br />
81
APPENDIX<br />
of<br />
<strong>Anthropometric</strong><br />
6.Standardization<br />
<strong>Measurement</strong>s<br />
The training of personnel on specific<br />
measurement and recording techniques<br />
includes not only theoretical explanations<br />
and demonstrations, but also an<br />
opportunity to allow participants to<br />
practice the measurement techniques, as<br />
well as reading and recording the results.<br />
This practice is more efficient when a<br />
large number of children are available.<br />
9.<br />
Once all personnel have adequately<br />
practiced the measurement and recording<br />
techniques, and feel comfortable with<br />
their performance, standardization<br />
exercises can be carried out. Each<br />
exercise is performed with a group of 10<br />
children whose ages fall within the preestablished<br />
range for the study. A<br />
sequential identification number is<br />
assigned to both children and staff. To<br />
conduct the exercises the following are<br />
needed:<br />
balances/scales and height boards;<br />
pens; and<br />
•<br />
sufficient <strong>Anthropometric</strong> Standardization<br />
Forms 1 and 2, to record the<br />
exercise number, name and number of the<br />
measurer, date on which the exercise is<br />
conducted, and a sequential listing of<br />
children with their name, age and<br />
identification number.<br />
82
REFERENCES PART 9.<br />
Form 1. Formula for <strong>Anthropometric</strong> Standardization<br />
Weight<br />
Exercise number:<br />
Name of measurer:<br />
Measurer's code:<br />
Date / / 2000<br />
Name<br />
Age in<br />
months<br />
No.<br />
My measure<br />
Standard<br />
measure<br />
Difference<br />
sign ( + , -)<br />
1<br />
2<br />
3<br />
4<br />
5<br />
6<br />
7<br />
8<br />
9<br />
10<br />
Number of large differences<br />
(0.3 Kg or more)<br />
Whole circles<br />
1<br />
Number of medium differences<br />
(0.2 Kg)<br />
Empty circles<br />
2<br />
Number of small differences<br />
(0.0 or 0.1 Kg)<br />
Without circles<br />
3<br />
=<br />
9.<br />
83
Form 2. Formula for <strong>Anthropometric</strong> Standardization<br />
Height<br />
Exercise number:<br />
Name of measurer:<br />
Measurer's code:<br />
Date / / 2000<br />
Name<br />
Age in<br />
months<br />
No.<br />
My measure<br />
Standard<br />
measure<br />
Difference<br />
sign ( + , -)<br />
1<br />
2<br />
3<br />
4<br />
5<br />
6<br />
7<br />
8<br />
9<br />
10<br />
Number of large differences<br />
(1.0cm or more)<br />
Whole circles<br />
1<br />
Number of medium differences<br />
(0.6-0.9cm)<br />
Empty circles<br />
2<br />
Number of small differences<br />
(0-0.5cm)<br />
Without circles<br />
3<br />
9.<br />
No. DIFS. Sign (+): No. DIFS. Sign (-):<br />
=<br />
84
REFERENCES PART 9.<br />
<strong>Measurement</strong> and Recording<br />
Before carrying out the exercise, the<br />
supervisor carefully weighs and measures<br />
each child and records the results without<br />
any of the trainees seeing the results. For<br />
each exercise, a group of up to 10<br />
measurers will conduct the measurements<br />
in a pre-determined order. Each<br />
child will remain at a fixed location. The<br />
distance between each child should be big<br />
enough to prevent measurers seeing/<br />
hearing each others results.<br />
At the beginning of an exercise, each<br />
measurer and assistant is paired with a<br />
child. Once the children and the<br />
measurers have been positioned with their<br />
respective materials and instruments, the<br />
supervisors should instruct the measurers<br />
to begin the measurements following the<br />
pre-established sequence. The measurer<br />
carefully conducts the measurements and<br />
clearly records in ink the results on the<br />
anthropometric standardization form (MY<br />
MEASURE column) next to the child’s<br />
identification number. The measurers<br />
remain with the child until the supervisor<br />
instructs them to move. Once results are<br />
recorded, corrections are not allowed.<br />
When all the measurers have conducted<br />
their measurements, the supervisor<br />
should instruct them to move to next child<br />
following the numerical order and<br />
requests that they wait for instructions to<br />
begin the measurement. This process is<br />
repeated until all children have been<br />
weighed and measured by all the<br />
measurers.<br />
Use the same equipment to measure<br />
each child’s weight and stature.<br />
Measurers and assistants should rotate to<br />
conduct the measurement, but the<br />
equipment remains stationed next to each<br />
child. Only one pair of measurers should<br />
be with a child at any one time. Talking<br />
between measurer-pairs during this<br />
exercise is not allowed.<br />
The supervisor should take advantage<br />
of the standardization exercises to<br />
systematically observe each measurer’s<br />
performance using the <strong>Measurement</strong><br />
Techniques Observation Form 3. This<br />
form contains a list of the most important<br />
steps of each measurement technique, that<br />
allows the supervisor to record if each step<br />
was completed appropriately, and to later<br />
discuss the results of these observations<br />
with the staff.<br />
9.<br />
85
Form 3. <strong>Measurement</strong> techniques observation<br />
Weight<br />
Observer #<br />
1<br />
2 3 4<br />
Exercises 1 2 1 2 1 2 1 2<br />
1<br />
Position of equipment<br />
2<br />
Adjustment to zero<br />
3<br />
Clothes<br />
4<br />
Child's attitude<br />
5<br />
Child's position<br />
6<br />
Reading time<br />
7<br />
Reading angle<br />
8<br />
Reading<br />
9<br />
Value<br />
10<br />
11<br />
12<br />
13<br />
14<br />
9.<br />
V<br />
A<br />
L<br />
U<br />
E<br />
Observer<br />
Supervisor<br />
Difference<br />
86
REFERENCES PART 9.<br />
Height<br />
Observer #<br />
1<br />
2 3 4<br />
Exercises 1 2 1 2 1 2 1 2<br />
1<br />
Position of equipment<br />
2<br />
Adjustment to zero<br />
3<br />
Clothes<br />
4<br />
Child's attitude<br />
5<br />
Child's position<br />
6<br />
Reading time<br />
7<br />
Reading angle<br />
8<br />
Reading<br />
9<br />
Value<br />
10<br />
11<br />
12<br />
13<br />
14<br />
V<br />
A<br />
L<br />
U<br />
E<br />
Observer<br />
Supervisor<br />
Difference<br />
9.<br />
87
Form 4. Example of overplacing of forms to compare measurers<br />
Height<br />
Standardization of<br />
<strong>Anthropometric</strong>s Weight<br />
Name of measurer<br />
Exercise #1 Exercise #1 Exercise #1 Exercise #1<br />
Measurer A Measurer B Measurer C Measurer D<br />
Age in<br />
months<br />
#<br />
<strong>Measurement</strong><br />
A<br />
Standard<br />
<strong>Measurement</strong><br />
B<br />
Difference<br />
A - B<br />
sign (+ , -)<br />
Difference<br />
A - B<br />
sign (+ , -)<br />
Difference<br />
A - B<br />
sign (+ , -)<br />
Difference<br />
A - B<br />
sign (+ , -)<br />
1<br />
.<br />
.<br />
( ) .<br />
( ) .<br />
( ) . ( ) .<br />
2<br />
.<br />
.<br />
( ) .<br />
( ) . ( ) . ( ) .<br />
3<br />
.<br />
.<br />
( ) .<br />
( ) . ( ) . ( ) .<br />
4<br />
.<br />
.<br />
( ) .<br />
( ) . ( ) . ( ) .<br />
5<br />
.<br />
.<br />
( ) .<br />
( ) . ( ) . ( ) .<br />
6<br />
.<br />
.<br />
( ) .<br />
( ) . ( ) . ( ) .<br />
7<br />
.<br />
.<br />
( ) .<br />
( ) . ( ) . ( ) .<br />
8<br />
.<br />
.<br />
( ) .<br />
( ) . ( ) . ( ) .<br />
9<br />
.<br />
.<br />
( ) .<br />
( ) . ( ) . ( ) .<br />
10<br />
.<br />
.<br />
( ) .<br />
( ) . ( ) . ( ) .<br />
Large differences (1.0 or more) = whole circles<br />
1<br />
Total<br />
Total<br />
Total<br />
Medium differences (0.6 or 0.9cm) = empty circles<br />
2<br />
Total<br />
Total<br />
Total<br />
Small differences (0.5 or less) = no circles<br />
3<br />
Total<br />
Total<br />
Total<br />
# of diffs. sign + LESS # of diffs. sign - = ( )<br />
( ) ( ) ( )<br />
9.<br />
88
REFERENCES PART 9.<br />
Form 5. Tracking measurer's progress<br />
Name of measurer-pair<br />
No.<br />
Name of supervisor<br />
Name of supervisor<br />
Height<br />
Weight<br />
Result exercise No. #<br />
Date<br />
Number of full circles<br />
Number of empty circles<br />
Number without circles<br />
Total markings<br />
Name of measurer-pair<br />
No.<br />
Name of supervisor<br />
Name of supervisor<br />
Height<br />
Weight<br />
Result exercise No. #<br />
Date<br />
Number of full circles<br />
Number of empty circles<br />
Number without circles<br />
Total markings<br />
9.<br />
89
9.<br />
Analysis<br />
Once all the children have been measured<br />
by all the measurer-pairs, the supervisor<br />
should meet with the group to analyze the<br />
results of the exercise and the measurers<br />
read out-loud the results of his/her<br />
measurements for each child. The<br />
measurers should record these results in<br />
their respective forms, under the<br />
STANDARD MEASURE column (see<br />
Forms 1 and 2). Next, each of the<br />
measurers should calculate the difference<br />
between MY MEASURE and STANDARD<br />
MEASURE for each measurement and<br />
child, and record the result on the same<br />
form under the DIFFERENCE column,<br />
using the corresponding + or - sign: if the<br />
measurer’s measurement is larger than<br />
the supervisor’s measurement (standard<br />
measurement), the sign is positive; if the<br />
measurer’s measurement is lower than<br />
the supervisor’s measurement, the sign is<br />
negative. Following this procedure, the<br />
measurers should draw a circle to the<br />
right of the large and medium differences<br />
as follows:<br />
<strong>Measurement</strong> Whole Circle No Circle<br />
Empty Circle<br />
Child’s weight 0.2 kg < 0.2 kg<br />
0.3 kg or more<br />
Child’s length 0.6 to 0.9 cm < 0.6 cm<br />
/height 1.0 cm<br />
or more<br />
Each measurer then totals the number of<br />
large differences (marked with a whole<br />
circle) and the number of medium<br />
differences (marked with an empty circle),<br />
and records the totals in the corresponding<br />
boxes on the lower part of the form (box 1<br />
for large differences and box 2 for medium<br />
differences). The sum of all small<br />
differences or no differences should be<br />
calculated and recorded in box 3.<br />
Finally, the difference between the<br />
number of positive and negative differences<br />
(excluding zeros) should be calculated and<br />
recorded in the big box on the form with its<br />
corresponding sign. For example, if there<br />
are 6 positive differences, 3 negative<br />
differences, and a zero, the result is +3; if<br />
there are 8 negative differences and 2<br />
positive differences, the result is -6.<br />
Interpretation<br />
The interpretation of the standardization<br />
exercise results is made by the measurers<br />
with the supervisor’s help. The purpose is<br />
to detect differences, identify their<br />
possible causes, and correct them. To<br />
achieve this, it is important to take into<br />
account the size of the differences<br />
between each measurer and the<br />
supervisor, as well as the positive or<br />
negative sign of the differences.<br />
1. Size of the differences<br />
The total number of the differences,<br />
according to their size, has already been<br />
recorded by line 1, 2, and 3 located in at<br />
the bottom of the form, as follows: large<br />
differences in line 1, medium ones in line<br />
2, and small differences (including the<br />
absence of differences) in line 3. As the<br />
number of differences in lines 1 and 2<br />
decreases, especially in line 1, the<br />
agreement between the measurer and the<br />
supervisor increases; that is, the better the<br />
standardization of the measurer with the<br />
supervisor. Large differences (line 1)<br />
generally indicate carelessness in the<br />
reading or recording, or serious problems<br />
in the measurement technique. Moderate<br />
differences usually indicate problems in<br />
the measurement technique. The ideal is<br />
to obtain the largest number in line 3,<br />
(small differences or complete<br />
agreement).<br />
In cases where large or medium<br />
differences are found, the respective<br />
measurer with the assistance of the<br />
supervisor should carefully repeat the<br />
measurement in order to identify and<br />
correct the cause of the differences.<br />
2. Sign of the differences<br />
If the total registered in the big box is +6<br />
or more, the measurer’s measurements<br />
are consistently larger than the<br />
supervisor’s. For weight measurements,<br />
the most frequent causes for differences<br />
are: not adjusting the scale to zero at the<br />
beginning; reading the scale in an oblique<br />
position and not facing the scale; or<br />
reading the scale by following the<br />
90
REFERENCES PART 9.<br />
incorrect direction. In height or length<br />
measurements, the most frequent causes<br />
for differences are: inadequate position of<br />
the head or feet; a reading done in an<br />
oblique position and not facing the reading<br />
point of the measuring board or heightmeasuring<br />
apparatus; or a reading<br />
conducted by following the incorrect<br />
direction of the scale.<br />
If the total in the big box is -6 or less<br />
(for example, -8), the measurer’s<br />
measurements are consistently smaller<br />
than the supervisor’s measurements.<br />
With weight measurements, the most<br />
frequent causes for differences are similar<br />
to those described above for consistently<br />
large measurements. With height or<br />
length measurements the most frequent<br />
causes are similar to those described<br />
above for consistently large<br />
measurements, in addition to flexing of the<br />
child’s legs during measurement.<br />
In all cases in which large or medium<br />
differences are found, the respective<br />
measurer with the assistance of the<br />
supervisor should carefully repeat the<br />
measurement in order to identify and<br />
correct the cause of the differences.<br />
3. Sample exercise with 4 measurers<br />
Measurers<br />
A B C D<br />
Large differences 1 2 0 0<br />
(line 1)<br />
Medium differences 4 0 2 8<br />
(line 2)<br />
Small differences 5 8 8 2<br />
(line 3)<br />
Signs exercise +2 -5 +6 -6<br />
(final box)<br />
Possible interpretation:<br />
Measurer A<br />
Careless measurement (reading or<br />
recording) and problems with the<br />
measurement technique.<br />
Measurer B<br />
Careless measurement, but no evident<br />
problems with the measurement<br />
technique.<br />
Measurer C<br />
Generally well done (1 to 2 moderate<br />
differences may be allowed), but the sign<br />
test gives +6.<br />
Measurer D<br />
Problems are evident with the<br />
measurement technique and the sign test<br />
gives -6.<br />
4. Comparison between measurers<br />
The forms used in the exercise for each<br />
anthropometric pattern can be overlapped<br />
so that comparisons can be made between<br />
measurers (see Form 4 for example of<br />
weight measurements). A summary table<br />
that shows progress made by the<br />
measurer-pairs can also be prepared<br />
(Form 5). If the frequency, magnitude,<br />
and sign of the differences with the<br />
supervisor are similar for 2 or more<br />
measurers, this can suggest that they may<br />
have common problems. If the differences<br />
concentrate in the measurements of 1 or 2<br />
particular children, all the measurers in<br />
conjunction with the supervisor should<br />
repeat the measurements for these<br />
children, in order to identify and correct<br />
any problems. In some cases problems<br />
can be the result of children who move too<br />
much and are difficult to measure.<br />
D. Replication of the Exercises<br />
The exercises should be repeated as many<br />
times as necessary until none of the<br />
measurers have large differences (line 1),<br />
and a maximum of 1 or 2 medium<br />
differences (ideally zero) and until the<br />
tendency to obtain larger or smaller<br />
values than those of the supervisor<br />
disappears (less than 6 in the big box).<br />
Generally, this is accomplished after 2or 3<br />
exercises for weight and height. The<br />
progress made by the measurers during<br />
the standardization exercises can be<br />
observed using Form 5.<br />
9.<br />
91
Figure A6.1 Recording <strong>Measurement</strong>s<br />
9.<br />
92
REFERENCES PART 9.<br />
<strong>Guide</strong>lines<br />
for Supervising<br />
Surveys<br />
7.<br />
APPENDIX<br />
In order to facilitate the supervision required<br />
for quality control of anthropometric data,<br />
this guide describes the procedures that<br />
supervisors need to follow to routinely<br />
conduct quality control on field data.<br />
Focus and Content of Supervision<br />
Supervision should have a focus on<br />
guidance and training and not be seen as<br />
policing. In other words, reinforcing<br />
training and motivating staff to guarantee<br />
good quality data is essential. From a<br />
quality control perspective, supervision<br />
includes two basic activities:<br />
1. Direct observation of the measurement<br />
techniques conducted by the<br />
measurers. The supervisor routinely<br />
observes the performance of the<br />
measurers while they weigh and measure<br />
throughout the entire data collection<br />
process. To do this, the supervisor should<br />
make a list of the most important steps<br />
that need to be systematically observed, or<br />
a form similar to the one used during the<br />
training and standardization (Form 5),<br />
which contains a column to record<br />
whether each step was correctly followed.<br />
2. Replication of measurements in 10<br />
percent of the sample. The supervisor<br />
should repeat the measurements<br />
conducted by the measures in 10 percent<br />
of the children (one out of every ten),<br />
preferably on different days and in a<br />
random fashion so that the measurers will<br />
not know which children’s measurements<br />
will be repeated. The supervisor records<br />
the results of these repeated measurements<br />
on the regular data collection<br />
forms, compares these results with the<br />
ones conducted by the respective<br />
measurer and, if discrepancies are found,<br />
discusses the results with the measurer so<br />
as to identify the causes and correct them.<br />
Through observation of the measurers<br />
and a careful review of results of the<br />
replications, the supervisor can reinforce<br />
measurer training and correct any faults.<br />
The standardization exercises should be<br />
repeated whenever needed.<br />
Quality Control Through Visual<br />
Inspection of the Forms<br />
The supervisor will, on a daily basis and<br />
in a systematic way, visually inspect the<br />
forms where the data are recorded. The<br />
purpose of this inspection is to detect<br />
missing data, inconsistencies, recording<br />
errors and values outside the preestablished<br />
permissible ranges. During<br />
the review, emphasis should be given to<br />
the following points:<br />
1. Date of measurement<br />
2. Correct identification of the form with<br />
the mother or infant’s identification<br />
number, as well as the correct sex of<br />
the child<br />
3. Date of birth of the child<br />
4. Weight of the child<br />
5. Length/height of the child<br />
9.<br />
93
Points 1 to 3 are especially important to<br />
detect errors in identification. These errors<br />
should be immediately corrected. The<br />
anthropometric data (4 and 5) are<br />
reviewed with the goal of detecting errors<br />
in recording (coding) and values outside<br />
the preestablished range, as follows:<br />
• for the child’s weight, values falling<br />
outside the following ranges according to age:<br />
Age (months)<br />
6 - 11 4.00-13.00<br />
12 -17 7.00-15.00<br />
18-23 8.00-16.50<br />
24-29 8.50-17.50<br />
30-35 9.00-19.00<br />
36-41 9.50-2<strong>2.1</strong>5<br />
42-47 10.00-23.00<br />
48-53 11.00-24.50<br />
54-59 11.50-26.00<br />
60-65 12.00-27.50<br />
66-71 13.00-29.50<br />
72-77 13.50-31.50<br />
78-83 14.00-33.50<br />
Range of Weights (Kg)<br />
Once the coding has been visually<br />
inspected, data are entered into the<br />
computer. Data processing procedures for<br />
quality control will also be applied to<br />
detect possible coding errors,<br />
inconsistencies, and data outside the<br />
specified ranges. It is important to<br />
emphasize, however, that quality control<br />
in the field through supervision, including<br />
the daily and routine inspection of forms,<br />
is the only efficient procedure to detect<br />
and correct errors, omissions, and<br />
inconsistencies in a timely manner. The<br />
feasibility of correcting errors during data<br />
processing is much lower given that<br />
generally it is too late to return to the<br />
primary source of the data, the majority of<br />
errors detected at that late time cannot be<br />
corrected and many of them end up as<br />
missing data.<br />
Age (months) Range of<br />
Length/heights (cm)<br />
6 - 11 60-90<br />
12 -17 65-95<br />
18-23 70-100<br />
24-29 75-105<br />
30-35 80-110<br />
36-41 80-115<br />
42-47 85-115<br />
48-53 90-120<br />
54-59 90-125<br />
60-65 95-130<br />
66-71 95-130<br />
72-77 100-135<br />
78-83 100-140<br />
9.<br />
Values outside the ranges should be<br />
carefully reviewed by both the supervisor<br />
and the measurers with the aim of<br />
assuring that there were no errors in<br />
measurement or recording. In cases of<br />
doubt, the measurement should be<br />
repeated; if this is not possible the data<br />
should be erased and replaced with the<br />
code “999” for the weight or “9999” for<br />
height. If it is confirmed that the data are<br />
correct, they are kept even though they<br />
may be outside the range.<br />
94
REFERENCES PART 9.<br />
Title II<br />
Generic <strong>Indicators</strong><br />
8.<br />
APPENDIX<br />
The Title II Generic <strong>Indicators</strong><br />
Category<br />
Health, nutrition<br />
and MCH<br />
Level<br />
Impact<br />
Annual<br />
monitoring<br />
Indicator<br />
% stunted children 24-59 months (height/age Z-score)<br />
% underweight children by age group (weight/age Z-score)<br />
% infants breastfed w/in 8 hours of birth<br />
% infants under 6 months breastfed only<br />
% infants 6-10 months fed complementary foods<br />
% infants continuously fed during diarrhea<br />
% infants fed extra food for 2 weeks after diarrhea<br />
% eligible children in growth monitoring/promotion<br />
% children immunized for measles at 12 months<br />
% of communities with community health organization<br />
% children in growth promotion program gaining weight in past 3<br />
months (by gender)<br />
Water and<br />
Sanitation<br />
Impact<br />
Annual<br />
monitoring<br />
% infants with diarrhea in last two weeks<br />
liters of household water use per person<br />
% population with proper hand washing behavior<br />
% households with access to adequate sanitation (also annual<br />
monitoring)<br />
% households with year-round access to safe water<br />
% water/sanitation facilities maintained by community<br />
Household food<br />
consumption<br />
continued overleaf<br />
Impact<br />
% households consuming minimum daily food requirements<br />
number of meals/snacks eaten per day<br />
number of different food/food groups eaten<br />
9.<br />
95
The Title II Generic <strong>Indicators</strong> - continued<br />
Category<br />
Agricultural<br />
productivity<br />
Level<br />
Impact<br />
Annual<br />
monitoring<br />
Indicator<br />
annual yield of targeted crops<br />
yield gaps (actual vs. potential)<br />
yield variability under varying conditions<br />
value of agricultural production per vulnerable household<br />
months of household grain provisions<br />
% of crops lost to pests or environment<br />
annual yield of targeted crops<br />
number of hectares in which improved practices adopted<br />
number of storage facilities built and used<br />
Natural resource<br />
management<br />
Impact<br />
Annual<br />
monitoring<br />
imputed soil erosion<br />
imputed soil fertility<br />
yields or yield variability (also annual monitoring)<br />
number of hectares in which NRM practices used<br />
seedling/ sapling survival rate<br />
FFW / CFW roads<br />
Impact<br />
agriculture input price margins between areas<br />
availability of key agriculture inputs<br />
staple food transport costs by seasons<br />
volume of agriculture produce transported by households to markets<br />
volume of vehicle traffic by vehicle type<br />
kilometers of farm to market roads rehabilitated<br />
selected annual measurements of the impact indicators<br />
9.<br />
96
Food and Nutrition Technical Assistance <strong>Project</strong><br />
Academy for Educational Development<br />
1825 Connecticut Ave, NW,<br />
Washington D.C., 20009-5721<br />
Tel: 202-884 8000<br />
Fax: 202-884 8432<br />
E-mail: fanta@aed.org<br />
Website: www.fantaproject.org