2.1: Anthropometric Indicators Measurement Guide - Linkages Project
2.1: Anthropometric Indicators Measurement Guide - Linkages Project
2.1: Anthropometric Indicators Measurement Guide - Linkages Project

Create successful ePaper yourself
Turn your PDF publications into a flip-book with our unique Google optimized e-Paper software.
DATA ANALYSIS PART 7.<br />
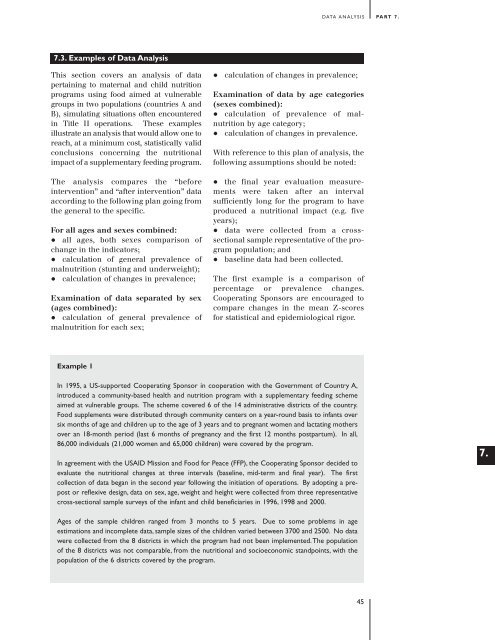
7.3. Examples of Data Analysis<br />
This section covers an analysis of data<br />
pertaining to maternal and child nutrition<br />
programs using food aimed at vulnerable<br />
groups in two populations (countries A and<br />
B), simulating situations often encountered<br />
in Title II operations. These examples<br />
illustrate an analysis that would allow one to<br />
reach, at a minimum cost, statistically valid<br />
conclusions concerning the nutritional<br />
impact of a supplementary feeding program.<br />
The analysis compares the “before<br />
intervention” and “after intervention” data<br />
according to the following plan going from<br />
the general to the specific.<br />
For all ages and sexes combined:<br />
• all ages, both sexes comparison of<br />
change in the indicators;<br />
• calculation of general prevalence of<br />
malnutrition (stunting and underweight);<br />
• calculation of changes in prevalence;<br />
Examination of data separated by sex<br />
(ages combined):<br />
• calculation of general prevalence of<br />
malnutrition for each sex;<br />
• calculation of changes in prevalence;<br />
Examination of data by age categories<br />
(sexes combined):<br />
• calculation of prevalence of malnutrition<br />
by age category;<br />
• calculation of changes in prevalence.<br />
With reference to this plan of analysis, the<br />
following assumptions should be noted:<br />
• the final year evaluation measurements<br />
were taken after an interval<br />
sufficiently long for the program to have<br />
produced a nutritional impact (e.g. five<br />
years);<br />
• data were collected from a crosssectional<br />
sample representative of the program<br />
population; and<br />
• baseline data had been collected.<br />
The first example is a comparison of<br />
percentage or prevalence changes.<br />
Cooperating Sponsors are encouraged to<br />
compare changes in the mean Z-scores<br />
for statistical and epidemiological rigor.<br />
Example 1<br />
In 1995, a US-supported Cooperating Sponsor in cooperation with the Government of Country A,<br />
introduced a community-based health and nutrition program with a supplementary feeding scheme<br />
aimed at vulnerable groups. The scheme covered 6 of the 14 administrative districts of the country.<br />
Food supplements were distributed through community centers on a year-round basis to infants over<br />
six months of age and children up to the age of 3 years and to pregnant women and lactating mothers<br />
over an 18-month period (last 6 months of pregnancy and the first 12 months postpartum). In all,<br />
86,000 individuals (21,000 women and 65,000 children) were covered by the program.<br />
In agreement with the USAID Mission and Food for Peace (FFP), the Cooperating Sponsor decided to<br />
evaluate the nutritional changes at three intervals (baseline, mid-term and final year). The first<br />
collection of data began in the second year following the initiation of operations. By adopting a prepost<br />
or reflexive design, data on sex, age, weight and height were collected from three representative<br />
cross-sectional sample surveys of the infant and child beneficiaries in 1996, 1998 and 2000.<br />
7.<br />
Ages of the sample children ranged from 3 months to 5 years. Due to some problems in age<br />
estimations and incomplete data, sample sizes of the children varied between 3700 and 2500. No data<br />
were collected from the 8 districts in which the program had not been implemented.The population<br />
of the 8 districts was not comparable, from the nutritional and socioeconomic standpoints, with the<br />
population of the 6 districts covered by the program.<br />
45