2.1: Anthropometric Indicators Measurement Guide - Linkages Project
2.1: Anthropometric Indicators Measurement Guide - Linkages Project
2.1: Anthropometric Indicators Measurement Guide - Linkages Project

Create successful ePaper yourself
Turn your PDF publications into a flip-book with our unique Google optimized e-Paper software.
REFERENCES PART 9.<br />
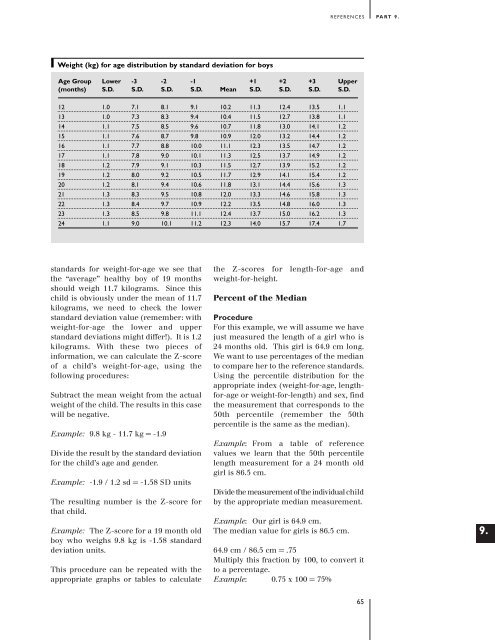
Weight (kg) for age distribution by standard deviation for boys<br />
Age Group<br />
(months)<br />
Lower<br />
S.D.<br />
-3<br />
S.D.<br />
-2<br />
S.D.<br />
-1<br />
S.D.<br />
Mean<br />
+1<br />
S.D.<br />
+2<br />
S.D.<br />
+3<br />
S.D.<br />
Upper<br />
S.D.<br />
12<br />
13<br />
14<br />
15<br />
16<br />
17<br />
18<br />
19<br />
20<br />
21<br />
22<br />
23<br />
24<br />
1.0<br />
1.0<br />
1.1<br />
1.1<br />
1.1<br />
1.1<br />
1.2<br />
1.2<br />
1.2<br />
1.3<br />
1.3<br />
1.3<br />
1.1<br />
7.1<br />
7.3<br />
7.5<br />
7.6<br />
7.7<br />
7.8<br />
7.9<br />
8.0<br />
8.1<br />
8.3<br />
8.4<br />
8.5<br />
9.0<br />
8.1<br />
8.3<br />
8.5<br />
8.7<br />
8.8<br />
9.0<br />
9.1<br />
9.2<br />
9.4<br />
9.5<br />
9.7<br />
9.8<br />
10.1<br />
9.1<br />
9.4<br />
9.6<br />
9.8<br />
10.0<br />
10.1<br />
10.3<br />
10.5<br />
10.6<br />
10.8<br />
10.9<br />
11.1<br />
11.2<br />
10.2<br />
10.4<br />
10.7<br />
10.9<br />
11.1<br />
11.3<br />
11.5<br />
11.7<br />
11.8<br />
12.0<br />
12.2<br />
12.4<br />
12.3<br />
11.3<br />
11.5<br />
11.8<br />
12.0<br />
12.3<br />
12.5<br />
12.7<br />
12.9<br />
13.1<br />
13.3<br />
13.5<br />
13.7<br />
14.0<br />
12.4<br />
12.7<br />
13.0<br />
13.2<br />
13.5<br />
13.7<br />
13.9<br />
14.1<br />
14.4<br />
14.6<br />
14.8<br />
15.0<br />
15.7<br />
13.5<br />
13.8<br />
14.1<br />
14.4<br />
14.7<br />
14.9<br />
15.2<br />
15.4<br />
15.6<br />
15.8<br />
16.0<br />
16.2<br />
17.4<br />
1.1<br />
1.1<br />
1.2<br />
1.2<br />
1.2<br />
1.2<br />
1.2<br />
1.2<br />
1.3<br />
1.3<br />
1.3<br />
1.3<br />
1.7<br />
standards for weight-for-age we see that<br />
the “average” healthy boy of 19 months<br />
should weigh 11.7 kilograms. Since this<br />
child is obviously under the mean of 11.7<br />
kilograms, we need to check the lower<br />
standard deviation value (remember: with<br />
weight-for-age the lower and upper<br />
standard deviations might differ!). It is 1.2<br />
kilograms. With these two pieces of<br />
information, we can calculate the Z-score<br />
of a child’s weight-for-age, using the<br />
following procedures:<br />
Subtract the mean weight from the actual<br />
weight of the child. The results in this case<br />
will be negative.<br />
Example: 9.8 kg - 11.7 kg = -1.9<br />
Divide the result by the standard deviation<br />
for the child’s age and gender.<br />
Example: -1.9 / 1.2 sd = -1.58 SD units<br />
The resulting number is the Z-score for<br />
that child.<br />
Example: The Z-score for a 19 month old<br />
boy who weighs 9.8 kg is -1.58 standard<br />
deviation units.<br />
This procedure can be repeated with the<br />
appropriate graphs or tables to calculate<br />
the Z-scores for length-for-age and<br />
weight-for-height.<br />
Percent of the Median<br />
Procedure<br />
For this example, we will assume we have<br />
just measured the length of a girl who is<br />
24 months old. This girl is 64.9 cm long.<br />
We want to use percentages of the median<br />
to compare her to the reference standards.<br />
Using the percentile distribution for the<br />
appropriate index (weight-for-age, lengthfor-age<br />
or weight-for-length) and sex, find<br />
the measurement that corresponds to the<br />
50th percentile (remember the 50th<br />
percentile is the same as the median).<br />
Example: From a table of reference<br />
values we learn that the 50th percentile<br />
length measurement for a 24 month old<br />
girl is 86.5 cm.<br />
Divide the measurement of the individual child<br />
by the appropriate median measurement.<br />
Example: Our girl is 64.9 cm.<br />
The median value for girls is 86.5 cm.<br />
64.9 cm / 86.5 cm = .75<br />
Multiply this fraction by 100, to convert it<br />
to a percentage.<br />
Example: 0.75 x 100 = 75%<br />
9.<br />
65