2.1: Anthropometric Indicators Measurement Guide - Linkages Project
2.1: Anthropometric Indicators Measurement Guide - Linkages Project
2.1: Anthropometric Indicators Measurement Guide - Linkages Project

Create successful ePaper yourself
Turn your PDF publications into a flip-book with our unique Google optimized e-Paper software.
DATA ANALYSIS PART 7.<br />
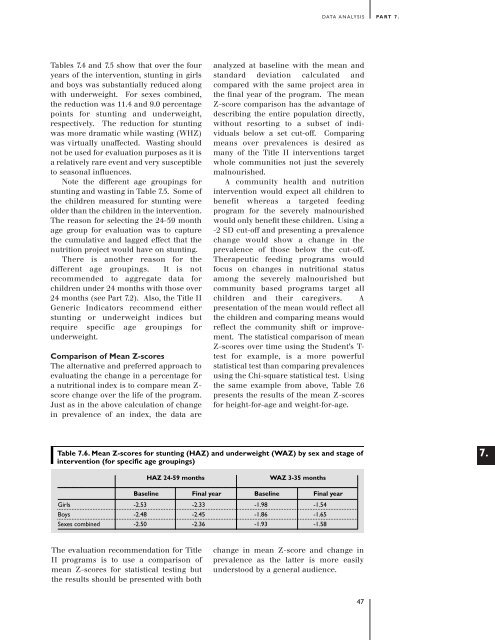
Tables 7.4 and 7.5 show that over the four<br />
years of the intervention, stunting in girls<br />
and boys was substantially reduced along<br />
with underweight. For sexes combined,<br />
the reduction was 11.4 and 9.0 percentage<br />
points for stunting and underweight,<br />
respectively. The reduction for stunting<br />
was more dramatic while wasting (WHZ)<br />
was virtually unaffected. Wasting should<br />
not be used for evaluation purposes as it is<br />
a relatively rare event and very susceptible<br />
to seasonal influences.<br />
Note the different age groupings for<br />
stunting and wasting in Table 7.5. Some of<br />
the children measured for stunting were<br />
older than the children in the intervention.<br />
The reason for selecting the 24-59 month<br />
age group for evaluation was to capture<br />
the cumulative and lagged effect that the<br />
nutrition project would have on stunting.<br />
There is another reason for the<br />
different age groupings. It is not<br />
recommended to aggregate data for<br />
children under 24 months with those over<br />
24 months (see Part 7.2). Also, the Title II<br />
Generic <strong>Indicators</strong> recommend either<br />
stunting or underweight indices but<br />
require specific age groupings for<br />
underweight.<br />
Comparison of Mean Z-scores<br />
The alternative and preferred approach to<br />
evaluating the change in a percentage for<br />
a nutritional index is to compare mean Z-<br />
score change over the life of the program.<br />
Just as in the above calculation of change<br />
in prevalence of an index, the data are<br />
analyzed at baseline with the mean and<br />
standard deviation calculated and<br />
compared with the same project area in<br />
the final year of the program. The mean<br />
Z-score comparison has the advantage of<br />
describing the entire population directly,<br />
without resorting to a subset of individuals<br />
below a set cut-off. Comparing<br />
means over prevalences is desired as<br />
many of the Title II interventions target<br />
whole communities not just the severely<br />
malnourished.<br />
A community health and nutrition<br />
intervention would expect all children to<br />
benefit whereas a targeted feeding<br />
program for the severely malnourished<br />
would only benefit these children. Using a<br />
-2 SD cut-off and presenting a prevalence<br />
change would show a change in the<br />
prevalence of those below the cut-off.<br />
Therapeutic feeding programs would<br />
focus on changes in nutritional status<br />
among the severely malnourished but<br />
community based programs target all<br />
children and their caregivers. A<br />
presentation of the mean would reflect all<br />
the children and comparing means would<br />
reflect the community shift or improvement.<br />
The statistical comparison of mean<br />
Z-scores over time using the Student’s T-<br />
test for example, is a more powerful<br />
statistical test than comparing prevalences<br />
using the Chi-square statistical test. Using<br />
the same example from above, Table 7.6<br />
presents the results of the mean Z-scores<br />
for height-for-age and weight-for-age.<br />
Table 7.6. Mean Z-scores for stunting (HAZ) and underweight (WAZ) by sex and stage of<br />
intervention (for specific age groupings)<br />
7.<br />
HAZ 24-59 months<br />
WAZ 3-35 months<br />
Final year<br />
Baseline<br />
Final year<br />
Girls<br />
Boys<br />
Sexes combined<br />
Baseline<br />
-2.53<br />
-2.48<br />
-2.50<br />
-2.33<br />
-2.45<br />
-2.36<br />
-1.98<br />
-1.86<br />
-1.93<br />
-1.54<br />
-1.65<br />
-1.58<br />
The evaluation recommendation for Title<br />
II programs is to use a comparison of<br />
mean Z-scores for statistical testing but<br />
the results should be presented with both<br />
change in mean Z-score and change in<br />
prevalence as the latter is more easily<br />
understood by a general audience.<br />
47