ILLINOIS SCHOOL REPORT CARD - Bremen High School District 228
ILLINOIS SCHOOL REPORT CARD - Bremen High School District 228
ILLINOIS SCHOOL REPORT CARD - Bremen High School District 228

Create successful ePaper yourself
Turn your PDF publications into a flip-book with our unique Google optimized e-Paper software.
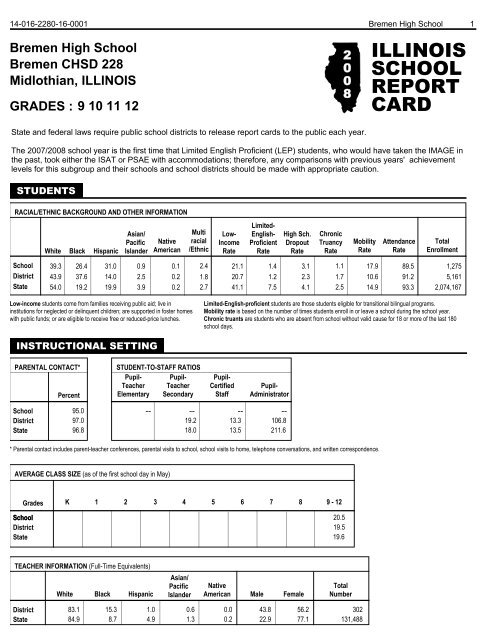
14-016-<strong>228</strong>0-16-0001<br />
<strong>Bremen</strong> <strong>High</strong> <strong>School</strong><br />
<strong>Bremen</strong> CHSD <strong>228</strong><br />
Midlothian, <strong>ILLINOIS</strong><br />
GRADES : 9 10 11 12<br />
2<br />
0<br />
0<br />
8<br />
<strong>Bremen</strong> <strong>High</strong> <strong>School</strong> 1<br />
<strong>ILLINOIS</strong><br />
<strong>SCHOOL</strong><br />
<strong>REPORT</strong><br />
<strong>CARD</strong><br />
State and federal laws require public school districts to release report cards to the public each year.<br />
The 2007/2008 school year is the first time that Limited English Proficient (LEP) students, who would have taken the IMAGE in<br />
the past, took either the ISAT or PSAE with accommodations; therefore, any comparisons with previous years' achievement<br />
levels for this subgroup and their schools and school districts should be made with appropriate caution.<br />
STUDENTS<br />
RACIAL/ETHNIC BACKGROUND AND OTHER INFORMATION<br />
White Black Hispanic<br />
Asian/<br />
Pacific<br />
Islander<br />
Native<br />
American<br />
Multi<br />
racial<br />
/Ethnic<br />
Low-<br />
Income<br />
Rate<br />
Limited-<br />
English-<br />
Proficient<br />
Rate<br />
<strong>High</strong> Sch.<br />
Dropout<br />
Rate<br />
Chronic<br />
Truancy<br />
Rate<br />
Mobility<br />
Rate<br />
Attendance<br />
Rate<br />
Total<br />
Enrollment<br />
<strong>School</strong><br />
<strong>District</strong><br />
State<br />
39.3<br />
43.9<br />
54.0<br />
26.4<br />
37.6<br />
19.2<br />
31.0<br />
14.0<br />
19.9<br />
0.9<br />
2.5<br />
3.9<br />
0.1<br />
0.2<br />
0.2<br />
2.4<br />
1.8<br />
2.7<br />
21.1<br />
20.7<br />
41.1<br />
1.4<br />
1.2<br />
7.5<br />
3.1<br />
2.3<br />
4.1<br />
1.1<br />
1.7<br />
2.5<br />
17.9<br />
10.6<br />
14.9<br />
89.5<br />
91.2<br />
93.3<br />
1,275<br />
5,161<br />
2,074,167<br />
Low-income students come from families receiving public aid; live in<br />
institutions for neglected or delinquent children; are supported in foster homes<br />
with public funds; or are eligible to receive free or reduced-price lunches.<br />
Limited-English-proficient students are those students eligible for transitional bilingual programs.<br />
Mobility rate is based on the number of times students enroll in or leave a school during the school year.<br />
Chronic truants are students who are absent from school without valid cause for 18 or more of the last 180<br />
school days.<br />
INSTRUCTIONAL SETTING<br />
PARENTAL CONTACT*<br />
Percent<br />
STUDENT-TO-STAFF RATIOS<br />
Pupil-<br />
Pupil-<br />
Teacher Teacher<br />
Elementary Secondary<br />
Pupil-<br />
Certified<br />
Staff<br />
Pupil-<br />
Administrator<br />
<strong>School</strong><br />
<strong>District</strong><br />
State<br />
95.0<br />
97.0<br />
96.8<br />
--<br />
--<br />
19.2<br />
18.0<br />
--<br />
13.3<br />
13.5<br />
--<br />
106.8<br />
211.6<br />
* Parental contact includes parent-teacher conferences, parental visits to school, school visits to home, telephone conversations, and written correspondence.<br />
AVERAGE CLASS SIZE (as of the first school day in May)<br />
Grades<br />
<strong>School</strong><br />
<strong>District</strong><br />
State<br />
K<br />
1 2 3 4 5 6 7 8 9 - 12<br />
20.5<br />
19.5<br />
19.6<br />
TEACHER INFORMATION (Full-Time Equivalents)<br />
White<br />
Black<br />
Hispanic<br />
Asian/<br />
Pacific<br />
Islander<br />
Native<br />
American<br />
Male<br />
Female<br />
Total<br />
Number<br />
<strong>District</strong><br />
State<br />
83.1 15.3 1.0 0.6 0.0 43.8 56.2 302<br />
84.9 8.7 4.9 1.3 0.2 22.9 77.1 131,488
14-016-<strong>228</strong>0-16-0001<br />
<strong>Bremen</strong> <strong>High</strong> <strong>School</strong> 2<br />
TEACHER INFORMATION ( Continued )<br />
Average<br />
Teaching<br />
Experience<br />
(Years)<br />
% of<br />
Teachers<br />
with<br />
Bachelor's<br />
Degrees<br />
% of<br />
Teachers<br />
with<br />
Master's<br />
& Above<br />
% of<br />
Teachers with<br />
Emergency or<br />
Provisional<br />
Credentials<br />
% of<br />
Classes Not<br />
Taught by<br />
<strong>High</strong>ly Qualified<br />
Teachers<br />
<strong>School</strong> -- -- --<br />
0.0 0.0<br />
<strong>District</strong><br />
12.4 39.2 60.8 0.0 0.0<br />
State<br />
12.4 46.7 53.2 0.7 0.7<br />
Some teacher/administrator data are not collected at the school level.<br />
<strong>SCHOOL</strong> DISTRICT FINANCES<br />
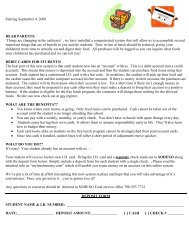
TEACHER/ADMINISTRATOR SALARIES (Full-Time Equivalents)<br />
$200,000<br />
$160,000<br />
$120,000<br />
$80,000<br />
$81,730<br />
$60,871<br />
$113,723<br />
$105,117<br />
Salaries and counts of staff are summed<br />
across a district based on the percentage of<br />
time that each individual is employed as a<br />
teacher or an administrator and may or may<br />
not reflect the actual paid salaries for the<br />
district.<br />
<strong>District</strong><br />
$40,000<br />
State<br />
$0<br />
Average Teacher Salary<br />
Average Administrator Salary<br />
EXPENDITURE BY FUNCTION 2006-07 (Percentages)<br />
60.0<br />
50.0<br />
51.0<br />
47.5<br />
40.0<br />
30.0<br />
20.0<br />
30.4<br />
32.4<br />
15.5<br />
17.6<br />
<strong>District</strong><br />
State<br />
10.0<br />
0.0<br />
3.0 2.5<br />
Instruction<br />
General<br />
Administration<br />
Supporting<br />
Services<br />
Other<br />
Expenditures
14-016-<strong>228</strong>0-16-0001<br />
<strong>Bremen</strong> <strong>High</strong> <strong>School</strong> 3<br />
REVENUE BY SOURCE 2006-07<br />
<strong>District</strong><br />
<strong>District</strong> %<br />
State %<br />
EXPENDITURE BY FUND 2006-07<br />
<strong>District</strong><br />
<strong>District</strong> %<br />
State %<br />
Local Property Taxes<br />
Other Local Funding<br />
General State Aid<br />
Other State Funding<br />
Federal Funding<br />
TOTAL<br />
$41,758,265<br />
$2,355,011<br />
$15,816,453<br />
$4,599,670<br />
$1,952,121<br />
$66,481,520<br />
62.8<br />
3.5<br />
23.8<br />
6.9<br />
2.9<br />
57.6<br />
7.3<br />
18.1<br />
9.7<br />
7.3<br />
Education<br />
Operations & Maintenance<br />
Transportation<br />
Bond and Interest<br />
Rent<br />
Municipal Retirement/<br />
Social Security<br />
Fire Prevention & Safety<br />
Site & Construction/<br />
Capital Improvement<br />
TOTAL<br />
$61,128,391<br />
$2,935,843<br />
$2,815,518<br />
$2,608,741<br />
$0<br />
$1,899,729<br />
$0<br />
$0<br />
$71,388,222<br />
85.6<br />
4.1<br />
3.9<br />
3.7<br />
0.0<br />
2.7<br />
0.0<br />
0.0<br />
72.6<br />
8.5<br />
3.9<br />
6.7<br />
0.0<br />
1.8<br />
0.9<br />
5.6<br />
OTHER FINANCIAL INDICATORS<br />
2005 Equalized<br />
Assessed Valuation<br />
per Pupil<br />
<strong>District</strong><br />
State<br />
2005 Total <strong>School</strong><br />
Tax Rate<br />
per $100<br />
$294,589 3.33<br />
** **<br />
2006-07 Instructional<br />
Expenditure<br />
per Pupil<br />
$7,512<br />
$5,808<br />
2006-07 Operating<br />
Expenditure<br />
per Pupil<br />
$12,241<br />
$9,907<br />
** Due to the way Illinois school districts are configured, state averages for equalized assessed valuation per pupil and total school tax rate per $100 are not provided.<br />
Equalized assessed valuation includes all computed property values upon which a district's local tax rate is calculated.<br />
Total school tax rate is a district's total tax rate as it appears on local property tax bills.<br />
Instructional expenditure per pupil includes the direct costs of teaching pupils or the interaction between teachers and pupils.<br />
Operating expenditure per pupil includes the gross operating cost of a school district excluding summer school, adult education, bond principal retired, and capital expenditures.<br />
ACADEMIC PERFORMANCE<br />
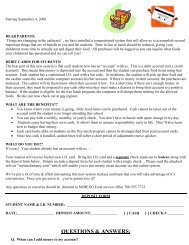
ACT ASSESSMENT: GRADUATING CLASS OF 2008 *<br />
36.0<br />
32.0<br />
28.0<br />
24.0<br />
20.0 18.5 19.4 20.5 17.9 19.0 20.1 18.9 19.7 20.6 18.2 19.2 20.4 18.6 19.3 20.3<br />
16.0<br />
12.0<br />
8.0<br />
4.0<br />
0.0<br />
Composite English Mathematics Reading Science<br />
The number and percent of students taking<br />
the ACT are no longer reported since<br />
virtually every eleventh grade student takes<br />
the ACT as part of the PSAE.<br />
* Includes graduating students' most recent<br />
ACT Assessment scores from an ACT<br />
national test date or PSAE testing. Excludes<br />
the scores of students who took the test with<br />
special accommodations. State averages for<br />
ACT data are based on regular public schools<br />
and do not include private and special<br />
purpose schools.<br />
<strong>School</strong> <strong>District</strong> State<br />
HIGH <strong>SCHOOL</strong> GRADUATION RATE<br />
Gender<br />
All Male Female<br />
White Black Hispanic<br />
Race / Ethnicity<br />
Asian/<br />
Pacific<br />
Islander<br />
Native<br />
American<br />
Multi<br />
racial<br />
/Ethnic<br />
LEP<br />
Migrant<br />
Students<br />
with<br />
Disabilities<br />
Economically<br />
Disadvantaged<br />
<strong>School</strong> 87.5 82.3 92.2 90.2 78.6 87.5 100.0<br />
<strong>District</strong> 90.1 89.4 90.9 93.3 87.8 86.7 88.1<br />
State 86.5 84.2 88.8 92.5 74.9 75.7 93.4<br />
100.0<br />
100.0<br />
87.6
14-016-<strong>228</strong>0-16-0001<br />
<strong>Bremen</strong> <strong>High</strong> <strong>School</strong> 4<br />
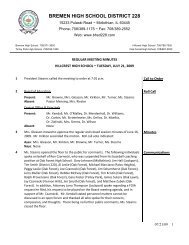
OVERALL STUDENT PERFORMANCE<br />
These charts present the overall percentages of state test scores categorized as meeting or exceeding the Illinois Learning<br />
Standards for your school, district, and the state. They respresent your school's performance in reading, mathematics, and<br />
science.<br />
The 2007/2008 school year is the first time that Limited English Proficient (LEP) students, who would have taken the IMAGE in<br />
the past, took either the ISAT or PSAE with accommodations; therefore, any comparisons with previous years' achievement<br />
levels for this subgroup and their schools and school districts should be made with appropriate caution.<br />
OVERALL PERFORMANCE - ALL STATE TESTS<br />
100<br />
80<br />
73.8 74.8<br />
60<br />
40<br />
42.9 41.9<br />
50.3<br />
54.0<br />
2006-07<br />
2007-08<br />
20<br />
0<br />
<strong>School</strong> <strong>District</strong> State<br />
OVERALL PRAIRIE STATE ACHIEVEMENT EXAMINATION (PSAE) PERFORMANCE<br />
100<br />
80<br />
60<br />
40<br />
42.6 41.7<br />
50.3<br />
54.1 52.6 52.5<br />
2006-07<br />
2007-08<br />
20<br />
0<br />
<strong>School</strong> <strong>District</strong> State
14-016-<strong>228</strong>0-16-0001<br />
<strong>Bremen</strong> <strong>High</strong> <strong>School</strong> 5<br />
PSAE PERFORMANCE<br />
These charts provide information on attainment of the Illinois Learning Standards. They show the average scores and also the<br />
percents of student scores meeting or exceeding standards in reading, mathematics, and science on PSAE.<br />
PRAIRIE STATE ACHIEVEMENT EXAMINATION (PSAE) - Average Scores<br />
200<br />
180<br />
2006-07<br />
160<br />
153 152<br />
155 155 157 156 154 153<br />
156 157 157 157 155 155 156<br />
158 158 158<br />
2007-08<br />
140<br />
120<br />
<strong>School</strong> <strong>District</strong> State <strong>School</strong> <strong>District</strong> State<br />
<strong>School</strong><br />
<strong>District</strong><br />
State<br />
Reading<br />
Mathematics<br />
Science<br />
PSAE scores range from 120 to 200.<br />
PRAIRIE STATE ACHIEVEMENT EXAMINATION (PSAE) - Percents Meeting or Exceeding Standards<br />
100<br />
80<br />
60<br />
40<br />
40.9 41.5<br />
51.0 52.6 54.1 53.3<br />
43.2 43.0<br />
51.3 56.2 52.7 53.0<br />
43.6 40.7<br />
48.7 53.4 51.0 51.2<br />
2006-07<br />
2007-08<br />
20<br />
0<br />
<strong>School</strong> <strong>District</strong> State <strong>School</strong> <strong>District</strong> State<br />
<strong>School</strong><br />
<strong>District</strong><br />
State<br />
Reading<br />
Mathematics<br />
Science<br />
Number of students in this school with PSAE scores in 2008: 238<br />
PERFORMANCE ON STATE ASSESSMENTS<br />
Federal law requires that student achievement results for reading, mathematics, and science for schools providing Title I<br />
services be reported to the general public.<br />
The Illinois Standards Achievement Test (ISAT) is administered to students in grades 3 through 8. The Prairie State<br />
Achievement Examination (PSAE) is administered to students in grade 11. The Illinois Alternate Assessment (IAA) is<br />
administered to students with disabilities whose Individualized Education Programs (IEPs) indicate that participation in the<br />
ISAT or PSAE would not be appropriate.<br />
Students with disabilities have an IEP (No Child Left Behind Act). An IEP is a written plan for a child with a disability who is<br />
eligible to receive special education services under the Individuals with Disabilities Education Act.<br />
Reading and Mathematics are tested in grades 3 through 8 and 11. Science is tested in grades 4, 7, and 11.<br />
In order to protect students' identities, test data for groups of fewer than ten students are not reported.
14-016-<strong>228</strong>0-16-0001<br />
<strong>Bremen</strong> <strong>High</strong> <strong>School</strong> 6<br />
PERCENTAGE OF STUDENTS NOT TESTED IN STATE TESTING PROGRAMS FOR READING AND MATHEMATICS<br />
All<br />
Male<br />
Gender<br />
Female<br />
White Black Hispanic<br />
Racial/Ethnic Background<br />
Asian/<br />
Pacific<br />
Islander<br />
Multi<br />
Native<br />
American<br />
racial<br />
/Ethnic LEP Migrant<br />
Students<br />
with<br />
Disabilities<br />
Economically<br />
Disadvantaged<br />
*Enrollment<br />
242<br />
116<br />
126<br />
124<br />
54<br />
57<br />
7<br />
1<br />
25<br />
50<br />
<strong>School</strong><br />
Reading<br />
Mathematics<br />
0.0<br />
0.0<br />
0.0<br />
0.0<br />
0.0<br />
0.0<br />
0.0<br />
0.0<br />
0.0<br />
0.0<br />
0.0<br />
0.0<br />
0.0<br />
0.0<br />
0.0<br />
0.0<br />
*Enrollment<br />
898<br />
430<br />
468<br />
488<br />
266<br />
94<br />
27<br />
2<br />
21<br />
5<br />
102<br />
169<br />
<strong>District</strong><br />
Reading<br />
Mathematics<br />
0.1<br />
0.1<br />
0.0<br />
0.0<br />
0.2<br />
0.2<br />
0.0<br />
0.0<br />
0.4<br />
0.4<br />
0.0<br />
0.0<br />
0.0<br />
0.0<br />
0.0<br />
0.0<br />
0.0<br />
0.0<br />
0.6<br />
0.6<br />
State<br />
*Enrollment<br />
Reading<br />
Mathematics<br />
1,080,912 552,428<br />
0.3<br />
0.3<br />
0.3<br />
0.3<br />
528,334<br />
0.2<br />
0.2<br />
584,551 209,802<br />
0.1 0.6<br />
0.1 0.6<br />
211,723<br />
0.3<br />
0.3<br />
42,677<br />
0.1<br />
0.1<br />
1,747<br />
0.2<br />
0.2<br />
28,936<br />
0.2<br />
0.2<br />
71,592<br />
0.2<br />
0.2<br />
349<br />
0.3<br />
0.3<br />
153,444<br />
0.5<br />
0.5<br />
459,352<br />
0.3<br />
0.3<br />
* Enrollment as reported during the testing windows for grades 3 - 8 and 11.<br />
PERCENTAGE OF STUDENTS NOT TESTED IN STATE TESTING PROGRAMS FOR SCIENCE ONLY<br />
<strong>School</strong><br />
*Enrollment<br />
Science<br />
All<br />
242<br />
0.0<br />
Gender<br />
Male Female<br />
116 126<br />
0.0 0.0<br />
White<br />
124<br />
0.0<br />
Black<br />
54<br />
0.0<br />
Racial/Ethnic Background<br />
Hispanic<br />
57<br />
0.0<br />
Asian/<br />
Pacific<br />
Islander<br />
Native<br />
American<br />
Multi<br />
racial<br />
/Ethnic<br />
7<br />
LEP<br />
1<br />
Migrant<br />
Students<br />
with<br />
Disabilities<br />
25<br />
0.0<br />
Economically<br />
Disadvantaged<br />
50<br />
0.0<br />
<strong>District</strong><br />
*Enrollment<br />
Science<br />
898<br />
0.1<br />
430<br />
0.0<br />
468<br />
0.2<br />
488<br />
0.0<br />
266<br />
0.4<br />
94<br />
0.0<br />
27<br />
0.0<br />
2<br />
21<br />
0.0<br />
5<br />
102<br />
0.0<br />
169<br />
0.6<br />
State<br />
*Enrollment 453,766<br />
Science 0.5<br />
230,339<br />
0.6<br />
223,387<br />
0.4<br />
253,443<br />
0.2<br />
84,573<br />
1.3<br />
85,001<br />
0.6<br />
18,167<br />
0.2<br />
775<br />
0.5<br />
11,107<br />
0.4<br />
24,940<br />
0.5<br />
141<br />
0.7<br />
63,312<br />
1.1<br />
180,194<br />
0.7<br />
* Enrollment as reported during the testing windows for grades 4, 7, and 11.
14-016-<strong>228</strong>0-16-0001<br />
<strong>Bremen</strong> <strong>High</strong> <strong>School</strong> 7<br />
PRAIRIE STATE ACHIEVEMENT EXAMINATION (PSAE)<br />
The following tables show the percentages of student scores in each of four performance levels. These levels were<br />
established with the help of Illinois educators who teach the grade levels and learning areas tested. Due to rounding, the sum<br />
of the percentages in the four performance levels may not always equal 100.<br />
Level 1 -- Academic Warning -<br />
Level 2 -- Below Standards -<br />
Level 3 -- Meets Standards -<br />
Level 4 -- Exceeds Standards -<br />
Student work demonstrates limited knowledge and skills in the subject. Because of major gaps in learning, students apply<br />
knowledge and skills ineffectively.<br />
Student work demonstrates basic knowledge and skills in the subject. However, because of gaps in learning, students<br />
apply knowledge and skills in limited ways.<br />
Student work demonstrates proficient knowledge and skills in the subject. Students effectively apply knowledge and skills<br />
to solve problems.<br />
Student work demonstrates advanced knowledge and skills in the subject. Students creatively apply knowledge and skills<br />
to solve problems and evaluate the results.<br />
Grade 11<br />
Grade 11 - All<br />
Reading<br />
Levels 1 2 3 4<br />
1<br />
Mathematics<br />
2 3<br />
4<br />
Science<br />
1 2 3 4<br />
<strong>School</strong><br />
<strong>District</strong><br />
State<br />
12.7 45.8 36.4 5.1<br />
8.6 38.8 46.1 6.5<br />
10.1 36.6 42.9 10.4<br />
12.2 44.7 39.7 3.4<br />
8.2 35.6 48.1 8.1<br />
11.1 35.9 42.2 10.8<br />
8.9 50.4 36.9 3.8<br />
6.7 39.8 47.7 5.7<br />
9.5 39.3 40.4 10.8<br />
Grade 11 - Gender<br />
Levels<br />
Reading<br />
1 2 3 4<br />
Mathematics<br />
1 2 3 4<br />
Science<br />
1 2 3 4<br />
Male<br />
<strong>School</strong><br />
<strong>District</strong><br />
State<br />
15.2 49.1 31.3 4.5<br />
10.5 42.7 41.5 5.3<br />
12.4 36.3 41.1 10.1<br />
10.6 39.8 44.2 5.3<br />
8.3 35.0 47.4 9.3<br />
11.0 33.5 42.8 12.7<br />
9.7 46.9 36.3 7.1<br />
7.4 38.1 46.4 8.1<br />
10.0 35.7 40.7 13.7<br />
Female<br />
<strong>School</strong><br />
<strong>District</strong><br />
State<br />
10.5 42.7 41.1 5.6<br />
6.8 35.2 50.3 7.7<br />
7.9 36.8 44.6 10.7<br />
13.7 49.2 35.5 1.6<br />
8.1 36.2 48.7 7.0<br />
11.2 38.2 41.7 8.9<br />
8.1 53.7 37.4 0.8<br />
6.1 41.4 48.9 3.5<br />
8.9 42.9 40.2 8.0
14-016-<strong>228</strong>0-16-0001<br />
<strong>Bremen</strong> <strong>High</strong> <strong>School</strong> 8<br />
Grade 11 - Racial/Ethnic Background<br />
Reading<br />
Levels 1 2 3 4<br />
White<br />
<strong>School</strong><br />
7.3 36.3 47.6 8.9<br />
<strong>District</strong><br />
4.5 28.4 57.2 9.9<br />
State<br />
6.0 29.3 50.8 13.9<br />
Mathematics<br />
Science<br />
1 2 3 4 1 2 3 4<br />
7.3 38.7 47.6 6.5<br />
4.3 27.4 56.4 11.9<br />
6.0 29.9 50.1 13.9<br />
8.1 35.5 49.2 7.3<br />
4.1 27.6 59.1 9.3<br />
5.2 31.3 49.0 14.5<br />
Black<br />
Hispanic<br />
State<br />
Asian/Pacific Islander<br />
<strong>School</strong><br />
State<br />
Multiracial/Ethnic<br />
<strong>School</strong><br />
<strong>District</strong><br />
State<br />
<strong>School</strong><br />
<strong>District</strong><br />
<strong>District</strong><br />
State<br />
Native American<br />
<strong>School</strong><br />
<strong>District</strong><br />
<strong>School</strong><br />
<strong>District</strong><br />
State<br />
23.5 49.0 27.5 0.0 28.8 44.2 26.9 0.0 12.0 66.0 22.0 0.0<br />
15.5 50.6 31.9 2.0 15.9 46.8 34.1 3.2 11.2 56.6 30.9 1.2<br />
20.2 54.9 23.3 1.6 27.5 51.8 19.6 1.0 21.3 60.4 17.3 1.0<br />
16.7 63.0 18.5 1.9 9.3 61.1 29.6 0.0 9.1 70.9 20.0 0.0<br />
12.2 53.3 31.1 3.3 8.9 48.9 38.9 3.3 7.7 59.3 31.9 1.1<br />
18.4 50.7 28.3 2.6 17.6 49.7 30.3 2.3 16.5 55.9 25.3 2.3<br />
11.5 53.8 34.6 0.0 7.4 33.3 55.6 3.7 11.1 40.7 48.1 0.0<br />
6.3 29.8 47.3 16.6 3.7 18.9 49.0 28.5 4.6 25.1 50.1 20.2<br />
9.3 40.9 40.9 8.9 11.7 40.1 40.5 7.8 12.5 38.5 39.7 9.3<br />
0.0 57.1 38.1 4.8 4.8 38.1 52.4 4.8 4.8 38.1 52.4 4.8<br />
8.0 37.6 43.3 11.1 11.1 36.6 42.4 9.9 8.4 41.1 40.4 10.0<br />
Grade 11 - Students with Disabilities<br />
IEP<br />
<strong>School</strong><br />
Levels<br />
<strong>District</strong><br />
State<br />
Reading<br />
1 2 3 4<br />
50.0 45.5 4.5 0.0<br />
38.5 48.4 11.0 2.2<br />
38.0 43.2 16.7 2.1<br />
Mathematics<br />
Science<br />
1 2 3 4 1 2 3 4<br />
65.2 30.4 4.3 0.0<br />
45.7 45.7 8.7 0.0<br />
42.4 44.3 12.0 1.3<br />
71.4 28.6 0.0 0.0<br />
44.9 44.9 7.9 2.2<br />
44.3 42.2 11.3 2.1<br />
Non-IEP<br />
<strong>School</strong><br />
<strong>District</strong><br />
State<br />
8.9 45.8 39.7 5.6<br />
5.1 37.7 50.2 7.0<br />
6.7 35.8 46.1 11.4<br />
6.5 46.3 43.5 3.7<br />
3.8 34.5 52.7 9.0<br />
7.3 34.9 46.0 11.9<br />
2.8 52.6 40.5 4.2<br />
2.4 39.3 52.2 6.1<br />
5.2 39.0 44.0 11.8<br />
Grade 11 - Economically Disadvantaged<br />
Free/Reduced Price Lunch<br />
<strong>School</strong><br />
<strong>District</strong><br />
State<br />
Not Eligible<br />
Levels<br />
<strong>School</strong><br />
<strong>District</strong><br />
State<br />
Reading<br />
1 2 3 4<br />
14.6 37.5 43.8 4.2<br />
13.5 46.2 39.1 1.3<br />
19.6 52.0 26.2 2.3<br />
12.2 47.9 34.6 5.3<br />
7.5 37.2 47.6 7.6<br />
6.3 30.4 49.6 13.7<br />
1<br />
Mathematics<br />
2 3<br />
14.6 39.6 45.8 0.0<br />
14.1 48.1 35.3 2.6<br />
22.3 50.3 25.5 1.9<br />
11.6 46.0 38.1 4.2<br />
6.9 33.0 50.8 9.3<br />
6.6 30.1 49.0 14.3<br />
4<br />
1<br />
Science<br />
2 3 4<br />
14.9 48.9 34.0 2.1<br />
13.0 52.6 32.5 1.9<br />
19.4 57.0 21.7 1.9<br />
7.4 50.8 37.6 4.2<br />
5.4 37.1 51.0 6.5<br />
5.5 32.2 48.0 14.3
14-016-<strong>228</strong>0-16-0001<br />
<strong>Bremen</strong> <strong>High</strong> <strong>School</strong> 9<br />
2008 ADEQUATE YEARLY PROGRESS (AYP) Status Report<br />
Is this school making Adequate Yearly Progress (AYP)<br />
No<br />
Has this school been identified for <strong>School</strong> Improvement according to the<br />
AYP specifications of the federal No Child Left Behind Act<br />
No<br />
Is this school making AYP in Reading<br />
No<br />
2008-09 Federal Improvement Status<br />
Is this school making AYP in Mathematics<br />
No<br />
2008-09 State Improvement Status<br />
Academic Watch Status Year 1<br />
Percent Tested on<br />
State Tests<br />
Percent Meeting/Exceeding Standards *<br />
Other Indicators<br />
Reading<br />
Mathematics<br />
Reading<br />
Mathematics<br />
Attendance Rate<br />
Graduation Rate<br />
Safe<br />
Safe<br />
% Met % Met % Harbor Met % Harbor Met %<br />
AYP<br />
AYP<br />
Target ** AYP<br />
Target ** AYP<br />
Met<br />
AYP<br />
%<br />
Met<br />
AYP<br />
State AYP<br />
Minimum Target<br />
95.0 95.0 62.5 62.5 90.0 75.0<br />
All<br />
100.0<br />
Yes<br />
100.0<br />
Yes<br />
41.5<br />
No<br />
43.8<br />
No<br />
87.5<br />
Yes<br />
White<br />
Black<br />
100.0<br />
100.0<br />
Yes<br />
Yes<br />
100.0<br />
100.0<br />
Yes<br />
Yes<br />
56.5<br />
26.5<br />
Yes<br />
No<br />
54.0<br />
28.0<br />
57.8<br />
Yes<br />
No<br />
90.2<br />
Hispanic<br />
100.0<br />
Yes<br />
100.0<br />
Yes<br />
20.4 40.5<br />
No<br />
31.5<br />
43.8<br />
No<br />
87.5<br />
Asian/Pacific<br />
Islander<br />
Native American<br />
Multiracial<br />
/Ethnic<br />
LEP<br />
Students with<br />
Disabilities<br />
Economically<br />
Disadvantaged<br />
100.0<br />
Yes<br />
100.0<br />
Yes<br />
46.8<br />
34.2<br />
No<br />
48.9<br />
41.1<br />
No<br />
Four Conditions Are Required For Making Adequate Yearly Progress (AYP):<br />
1. At least 95% tested in reading and mathematics for every student group. If the current year participation rate is less than 95%, this condition may<br />
be met if the average of the current and preceding year rates is at least 95%, or if the average of the current and two preceding years is at least 95%.<br />
Only actual participation rates are printed. If the participation rate printed is less than 95% and yet this school makes AYP, it means that the 95%<br />
condition was met by averaging.<br />
2. At least 62.5% meeting/exceeding standards in reading and mathematics for every group. For any group with less than 62.5% meeting/exceeding<br />
standards, a 95% confidence interval was applied. Subgroups may meet this condition through Safe Harbor provisions. ***<br />
3. For schools not making AYP solely because the IEP group fails to have 62.5% meeting/exceeding standards, 14% may be added to this variable in<br />
accordance with the federal 2% flexibility provision.<br />
4. At least 90% attendance rate for non-high schools and at least 75% graduation rate for high schools.<br />
* Includes only students enrolled as of 05/01/2007.<br />
** Safe Harbor Targets of 62.5% or above are not printed.<br />
*** Subgroups with fewer than 45 students are not reported. Safe Harbor only applies to subgroups of 45 or more. In order for Safe Harbor to apply, a<br />
subgroup must decrease by 10% the percentage of scores that did not meet state standards from the previous year plus meet the other indicators<br />
(attendance rate for non-high schools and graduation rate for high schools) for the subgroup. For subgroups that do not meet their Safe Harbor<br />
Targets, a 75% confidence interval is applied. Safe Harbor allows schools an alternate method to meet subgroup minimum targets on achievement.