Spray Drying Technology.pdf - National University of Singapore
Spray Drying Technology.pdf - National University of Singapore
Spray Drying Technology.pdf - National University of Singapore

Create successful ePaper yourself
Turn your PDF publications into a flip-book with our unique Google optimized e-Paper software.
<strong>Spray</strong> <strong>Drying</strong><br />
<strong>Technology</strong><br />
Volume One<br />
Editors<br />
M.W.Woo, A.S. Mujumdar, W.R.W. Daud
Preface<br />
<strong>Spray</strong> drying is a ubiquitous industrial operation found in numerous industrial<br />
sectors. It is employed to produce engineered powders from liquid feedstocks in<br />
a single step. Extensive research and development efforts in understanding the<br />
fundamentals and applications <strong>of</strong> spray drying in recent years has prompted us<br />
to edit this book enlisting the assistance <strong>of</strong> experts in the field. Recent research<br />
has seen developments in many aspects <strong>of</strong> spray drying technology. One end <strong>of</strong><br />
the R&D spectrum concerns large scale design <strong>of</strong> such equipment, in certain<br />
cases incorporating very detailed flow and heat and mass transfer analysis, while<br />
the other end <strong>of</strong> the spectrum focuses on the functionality <strong>of</strong> the single particle.<br />
This book aims to provide in a concise form <strong>of</strong> some <strong>of</strong> the latest research in<br />
these diverse areas <strong>of</strong> spray drying. However, the philosophy <strong>of</strong> this book does<br />
not end there. Keeping in mind that knowledge is useful only if it is able to reach<br />
a wider technical and research community, we have decided to publish this book<br />
in the form <strong>of</strong> an e-book that is freely downloadable. Thus, it is accessible<br />
without charge even in parts <strong>of</strong> the world where resources are not available to<br />
purchase high cost books and journals. It is hoped that this endeavour will allow<br />
the latest developments in this field to reach the global audience, particularly<br />
those who need access to the latest information but cannot afford it.<br />
Each chapter in this book was contributed by experts active in one particular<br />
area <strong>of</strong> spray drying. Each chapter has been prepared in a way that is selfcontained<br />
to extent possible. Two chapters are devoted to computational fluid<br />
flow and particle trajectory analysis in spray dryers. Three chapters focus on the<br />
functionality <strong>of</strong> particles by manipulating powder physical properties,<br />
crystallinity and in the production <strong>of</strong> herbal extracts. Extension <strong>of</strong> the spray<br />
drying process to incorporate the freezing phenomenon is also included. A<br />
unique feature <strong>of</strong> this book is in its electronic form <strong>of</strong> publication which allows<br />
this book to be updated as required in order to keep abreast with the latest<br />
development in the area. Therefore, as a service to our reader, we will endeavour<br />
to invite continuous feedback from our authors and readers to further improve<br />
this book. Lastly we would like to thank all the authors for their contribution in<br />
making this book project possible. It is through their selfless effort, we hope this<br />
book will be useful to the spray drying community.<br />
Contributions to our e-book series are made by editors as well as authors<br />
entirely as a volunteer effort. The copyrights rest with the authors <strong>of</strong> individual<br />
contributors. They have agreed to allow free access to their work for the benefit<br />
<strong>of</strong> free and fast global access to the knowledge they have created. Although freely<br />
available,readers should note that all contribtors are peer-reviewed and<br />
accepted only if they meet our quality requirements. We do plan to update and<br />
produce revised/enhanced editions <strong>of</strong> the e-books or produce additional<br />
volumes as a series.<br />
Meng Wai Woo<br />
Arun Sadashiv Mujumdar<br />
Wan Ramli Wan Daud<br />
i
List <strong>of</strong> Authors<br />
Arun Sadashiv Mujumdar<br />
Wan Ramli Wan Daud<br />
Meng Wai Woo<br />
Li Xin Huang<br />
Maria Laura Passos<br />
Viviane S. Birchal<br />
Timothy Langrish<br />
Sam Sukgoo Yoon<br />
Wanderley Pereira Oliveira<br />
Claudia R.F. Souza<br />
Louise E. Kurozawa<br />
Kil J. Park<br />
Mechanical Engineering Department & M3TC<br />
<strong>National</strong> <strong>University</strong> <strong>of</strong> <strong>Singapore</strong>, <strong>Singapore</strong><br />
Chemical Engineering Department<br />
<strong>National</strong> <strong>University</strong> <strong>of</strong> Malaysia, Malaysia<br />
Chemical Engineering Department<br />
Monash <strong>University</strong>, Australia<br />
Research Institute <strong>of</strong> Chemical Industry and<br />
Forest Products, Nanjing, China<br />
Chemical Engineering Department,<br />
Federal <strong>University</strong> <strong>of</strong> Sao Carlos, Brazil<br />
Chemical Engineering Department,<br />
Federal <strong>University</strong> <strong>of</strong> Sao Carlos, Brazil<br />
Department <strong>of</strong> Chemical and Biomolecular<br />
Engineering, <strong>University</strong> <strong>of</strong> Sydney, Australia<br />
School <strong>of</strong> Mechanical Engineering<br />
Korea <strong>University</strong>, Korea<br />
<strong>University</strong> <strong>of</strong> São Paulo/FCFRP,<br />
Ribeirão Preto, SP, Brazil<br />
<strong>University</strong> <strong>of</strong> São Paulo/FCFRP, Ribeirão<br />
Preto, SP, Brazil<br />
<strong>University</strong> <strong>of</strong> São Paulo/FCFRP, Ribeirão<br />
Preto, SP, Brazil<br />
<strong>University</strong> <strong>of</strong> São Paulo/FCFRP, Ribeirão<br />
Preto, SP, Brazil<br />
ii
Hasan Sadikoglu<br />
Xiao Dong Chen<br />
Sean Xu Qi Lin<br />
Kamlesh Patel<br />
M.J. Perea-Flores<br />
J.J. Chanona-Perez<br />
Department <strong>of</strong> Chemical Engineering, Gebze<br />
Institute <strong>of</strong> <strong>Technology</strong>, Turkey<br />
Chemical Engineering Department<br />
Monash <strong>University</strong>, Australia (Department <strong>of</strong><br />
Chemical and Biomechanical Engineering,<br />
College <strong>of</strong> Chemistry and Chemical<br />
Engineering, Xiamen <strong>University</strong>, China)<br />
Chemical Engineering Department<br />
Monash <strong>University</strong>, Australia<br />
Chemical Engineering Department<br />
Monash <strong>University</strong>, Australia<br />
Departamento de Ingeniería Bioquímica,<br />
Sección de Graduados e Investigación.<br />
Escuela Nacional de Ciencias Biológicas del<br />
Instituto Politécnico Nacional<br />
Departamento de Ingeniería Bioquímica,<br />
Sección de Graduados e Investigación.<br />
Escuela Nacional de Ciencias Biológicas del<br />
Instituto Politécnico Nacional<br />
E. Terres-Rojas Departamento de Ingeniería Bioquímica,<br />
Sección de Graduados e Investigación.<br />
Escuela Nacional de Ciencias Biológicas del<br />
Instituto Politécnico Nacional<br />
G. Calderon-Domingues Departamento de Ingeniería Bioquímica,<br />
Sección de Graduados e Investigación.<br />
Escuela Nacional de Ciencias Biológicas del<br />
Instituto Politécnico Nacional<br />
G.F. Gutierrez-Lopez Departamento de Ingeniería Bioquímica,<br />
Sección de Graduados e Investigación.<br />
Escuela Nacional de Ciencias Biológicas del<br />
Instituto Politécnico Nacional<br />
L. Alamilla-Beltran Departamento de Ingeniería Bioquímica,<br />
Sección de Graduados e Investigación.<br />
Escuela Nacional de Ciencias Biológicas del<br />
Instituto Politécnico Nacional<br />
V. Garibey-Febles Laboratorio de Microscopia Electrónica de<br />
Ultra-Alta Resolución del Instituto Mexicano<br />
de Petróleo<br />
iii
Content<br />
Preface<br />
Page<br />
i<br />
List <strong>of</strong> Authors<br />
ii<br />
Content<br />
iv<br />
Chapter 1 Computational fluid dynamics modelling <strong>of</strong> spray dryers 1<br />
Authors: Woo M.W., Huang, L.X., Mujumdar A.S., Daud W.R.W.<br />
Chapter 2 Manipulating physical properties <strong>of</strong> powders 37<br />
Authors: Passos M. L., Birchal V.S.<br />
Chapter 3 In-process crystallization control 61<br />
Authors: Langrish T.A.G.<br />
Chapter 4 Modelling <strong>of</strong> liquid atomization 77<br />
Authors: Yoon S.S.<br />
Chapter 5 <strong>Spray</strong> drying <strong>of</strong> food and herbal products 113<br />
Authors: Oliveira W.P., Souza C.R.F., Kurozawa L.E., Park K.J.<br />
Chapter 6 <strong>Spray</strong> freeze drying 157<br />
Authors: Sadikoglu H.<br />
Chapter 7 One dimensional design procedure for a spray dryer 183<br />
Authors: Chen X.D., Lin S.X.Q., Patel K., Woo M.W.<br />
Chapter 8 Microstructure structure characterization <strong>of</strong> milk powders 197<br />
and their relationship with rehydration properties<br />
Authors: Perea-Flores M.J., Chanona-Perez J.J., Terres-Rojas E.,<br />
Calderon-Dominguez G., Garibay-Febles V., Alamilla-Beltran L.,<br />
Gutierrez-Lopez G.F.<br />
Index 219<br />
iv
Woo, M.W., Huang, L.X., Mujumdar, A.S., Daud, W.R.W. CFD simulation <strong>of</strong> spray<br />
dryers - Volume 1, Ed. Woo, M.W., Mujumdar, A.S. and Daud, W.R.W., 2010, ISBN -<br />
978-981-08-6270-1, Published in <strong>Singapore</strong>, pp. 1-36.<br />
CFD simulation <strong>of</strong> spray dryers<br />
Woo M.W. 1 , Huang L.X. 2 , Mujumdar A.S. 3 , Daud W.R.W. 4<br />
1 Department <strong>of</strong> Chemical Engineering, Monash <strong>University</strong><br />
2 Research Institute <strong>of</strong> Chemical Industry and Forest Products, Nanjing, China<br />
3 Mechanical Engineering Department & M3TC <strong>National</strong> <strong>University</strong> <strong>of</strong> <strong>Singapore</strong>, <strong>Singapore</strong><br />
4 Department <strong>of</strong> Chemical and Process Engineering, <strong>National</strong> <strong>University</strong> <strong>of</strong> Malaysia<br />
Chapter 1<br />
Contents<br />
Page<br />
1.0 Introduction 2<br />
2.0 Components <strong>of</strong> a spray dryer CFD simulation 2<br />
2.1 Airflow simulation 3<br />
Transient or steady simulations 4<br />
Two dimensional versus three dimensional 7<br />
Turbulence modelling approach 8<br />
2.2 Particle tracking and atomization 9<br />
2.3 Droplet drying in CFD simulations 14<br />
2.4 Wall deposition modelling 16<br />
Sticking criterion 16<br />
Particle build-up and near-wall particle transport 18<br />
2.5 Particle interaction modelling 19<br />
3.0 Simulation validation 19<br />
3.1 Quantitative and qualitative flow visualization 20<br />
3.2 Humidity and temperature field measurements 21<br />
3.3 Final product and deposition flux comparison 21<br />
3.4 Residence time measurements 22<br />
4.0 Sample CFD simulation 22<br />
4.1 Steady state 22<br />
4.2 Transient state 25<br />
5.0 Typical applications 27<br />
5.1 Operation and design optimization 27<br />
5.3 Exploring new ideas 29<br />
6.0 Conclusion 30<br />
8.0 References 30<br />
Woo, Huang, Mujumdar, Daud – CFD modeling <strong>of</strong> spray dryers 1
1.0 Introduction<br />
The CFD technique has emerged as a useful tool to provide very<br />
detailed visualization <strong>of</strong> the internal phenomenon in the chamber. In the<br />
design <strong>of</strong> spray dryers, this can be used to complement existing design<br />
practice and as an economical scale up tool from pilot or lab scale<br />
experiments. However, it is pertinent that a CFD model <strong>of</strong> a spray dryer is<br />
properly set up and most importantly is interpreted correctly by the user.<br />
Therefore, this chapter aims to introduce the important aspects and numerical<br />
practice in using the CFD technique to model spray drying.<br />
For the fresh reader, this chapter will be useful in introducing the<br />
components important when setting up their own spray drying CFD models.<br />
On the other hand, for the experienced modeller, this chapter will be useful in<br />
providing the different perspective in applying the CFD technique to spray<br />
dryer modelling. This is important to allow the reader to effectively<br />
understand the current limitations <strong>of</strong> the CFD technique in spray drying when<br />
interpreting their own models. On top <strong>of</strong> that, validation <strong>of</strong> the spray dryer<br />
CFD model is another challenge in this area. Some useful validation method<br />
is provided in the second part <strong>of</strong> the chapter.<br />
2.0 Components <strong>of</strong> a spray dryer CFD<br />
simulation<br />
A CFD simulation <strong>of</strong> a spray dryer encompasses many different submodels<br />
or modelling areas combined. Five main areas are highlighted in this<br />
section and they are all inter-related to cover the diverse physics involved in<br />
spray drying. Figure 1 schematically shows the major components <strong>of</strong> a CFD<br />
simulation with the airflow simulation forming the main model. It is important<br />
to note that the submodels involved is not limited to those in Figure 1 and<br />
certainly depends on the complexity (or details) required from the simulation.<br />
While capturing the actual physics, this also forms a big challenge in the<br />
development <strong>of</strong> each sub-model as it is difficult to independently isolate each<br />
process. Different research as well as commercial groups has attempted to<br />
look at the different components <strong>of</strong> a CFD simulation. We will now look into<br />
each component in detail and in the course look at some numerical practice in<br />
such CFD modelling effort. For in-depth review <strong>of</strong> CFD techniques as applied<br />
to a wide assorted <strong>of</strong> dryers, the reader may refer to an extensive review <strong>of</strong><br />
relevant literature carried out by Tarek and Ray [1] . Mujumdar and Wu [2] have<br />
proposed use <strong>of</strong> mathematical models for intensification <strong>of</strong> innovation since a<br />
validated model allows designers to test novel designs and unorthodox<br />
operating conditions without the risk and cost involved in physical testing.<br />
Woo, Huang, Mujumdar, Daud – CFD modeling <strong>of</strong> spray dryers 2
Core model<br />
Air flow simulation<br />
Sub-models<br />
Particle tracking<br />
Droplet drying model<br />
Deposition model<br />
Particle interaction<br />
Particle quality<br />
Results<br />
Figure 1<br />
Schematic layout <strong>of</strong> a CFD simulation <strong>of</strong> spray drying<br />
2.1 Airflow simulation<br />
The core <strong>of</strong> a spray dryer CFD model from which other components are<br />
based on is the airflow simulation. Airflow pattern in the chamber mainly<br />
determines the movement <strong>of</strong> the particles which subsequently affects the<br />
residence time <strong>of</strong> the particles and whether the particles get deposited or<br />
escape from the chamber. In the computational sense, getting this right is the<br />
prerequisite for subsequent modelling effort.<br />
Most spray dryer CDF simulations reported are currently undertaken<br />
using commercial codes such as FLUENT, CFX, STAT3D e.g. as well as inhouse<br />
codes [3-6] . The basic CFD techniques are relatively established and will<br />
not be repeated here. It is expected that the reader is familiar in the<br />
technique and references can be found elsewhere [7] . However, we will only<br />
focus on some specific important general considerations when modelling the<br />
internal airflow within the chamber <strong>of</strong> a spray dryer:<br />
1. Transient or steady simulation<br />
2. Two-dimensional versus three-dimensional<br />
3. Turbulence modelling approach<br />
Woo, Huang, Mujumdar, Daud – CFD modeling <strong>of</strong> spray dryers 3
Transient or steady simulation<br />
The steady state approach has been the work horse <strong>of</strong> many early<br />
reports on CFD simulation <strong>of</strong> spray dryers [8-12] . To be more specific, it implies<br />
that there are no long time scale changes in the flow, although there can still<br />
be turbulence fluctuations present. Under the assumption that the airflow<br />
within the chamber is steady, these simulations managed to capture<br />
engineering data <strong>of</strong> interest. In particular, the third report by Kieviet et al. [10]<br />
illustrated relatively good comparison between the simulated and the<br />
measured velocity pr<strong>of</strong>iles although some unsteady pattern can be observed<br />
in their experimental work. This work has further become a relatively<br />
‘standard’ test case in some recent studies [13][14] . Relying on the ability <strong>of</strong> the<br />
steady state approach, a European Union (EU) project was funded, EDECAD,<br />
to implement the CFD technique to large industrial scale dryers [6] , further<br />
illustrates the application <strong>of</strong> the steady state approach.<br />
On the other hand, recent experimental work suggests that the internal<br />
airflow pattern can exhibit significant transient behaviour. Observations in a<br />
co-current pilot scale unit indicated that the central core flow tend to fluctuate<br />
sidewards with transient eddies being formed near the wall [15][16] . Not to be<br />
confused with rapid turbulence fluctuation, this transient behaviour refers to<br />
relatively long time scale self-sustained fluctuations. Figure 2 gives a<br />
simplified illustration <strong>of</strong> such transient behaviour in the airflow. There will be<br />
tendency for the central jet to deflect to the sides. The transient behaviour is<br />
also called self-sustained fluctuations as the transient behaviour is sustained<br />
due to pressure imbalances around the central jet. Additional experiments<br />
using a scaled down experimental unit provided more evidence <strong>of</strong> the<br />
transient behaviour particularly in the central core flow [17] . In order to obtain<br />
more insights into the transient behaviour, extensive simulations were further<br />
undertaken by making analogy to sudden pipe expansion flows. Depending<br />
on the inlet conditions, in general, it was found that a larger expansion ratio<br />
promotes more instability [18-20] . Some workers in the field have also recently<br />
switched to the transient approach [21][22] .<br />
However, based on a jet feed-back mechanism, it was recently<br />
numerically shown that the internal flow pattern in a spray dryer can exhibit<br />
steady-like behaviour, depending on the diameter <strong>of</strong> the chamber and the inlet<br />
velocity [23] . In a separate simulation for a unit with a rotating disk, Ullum<br />
(2006) also noted that their CFD predicted flow field resembles that <strong>of</strong> steady<br />
state; even when the simulation was switched to the transient solution<br />
framework. Harvie et al. [8] and Langrish et al. [5] further provide illustration <strong>of</strong><br />
the contrasting effect <strong>of</strong> swirls in stabilizing or de-stabilizing the flow field. On<br />
more fundamental grounds analogous to the spray dryer, studies on sudden<br />
pipe expansion and cavity expansion systems showed that steady or transient<br />
behaviour in the flow is strongly dependent on the expansion ratio and<br />
operating conditions [19][24] . Coupled with the ability <strong>of</strong> the steady approach in<br />
the earlier work, these are strong evidence in the possible existence <strong>of</strong> a<br />
transient-steady stability map in spray dryers. However, this point is still<br />
expected to be under discussion in the near future and mapping out <strong>of</strong> the<br />
entire stability map might not be possible due to the myriad possible designs<br />
<strong>of</strong> spray dryers. The key objective in illustrating these different cases and in<br />
making the comparison is so that the readers are aware <strong>of</strong> the possible<br />
Woo, Huang, Mujumdar, Daud – CFD modeling <strong>of</strong> spray dryers 4
scenarios on both sides <strong>of</strong> the fence when setting up and interpreting their<br />
own simulations.<br />
Figure 2<br />
Simplified illustration <strong>of</strong> the long time scale fluctuation (focusing<br />
on the deflection <strong>of</strong> the central jet). This illustration also<br />
highlights the jet feedback mechanism (Woo et al. 2009)<br />
At this juncture, as a guide for future workers, it is pertinent to venture<br />
briefly into the numerical aspect <strong>of</strong> such possibly self-sustained fluctuating<br />
flow. One main question is, in the absence <strong>of</strong> experimental data, on how do<br />
we know if the transient or steady treatment should be used It will be useful<br />
to use a step-by-step solution to the CFD model (Figure 3). The model is<br />
initially solved with a steady state solution in the first step. The results or the<br />
developed flow field from the steady state solution will then be used as the<br />
initial condition for the second transient solution. Such a practice is also<br />
commonly recommended by commercial code developers (eg. FLUENT,<br />
CFX).<br />
In the first steady solution step, two possible scenarios are possible. If<br />
the flow field is inherently steady, the numerical residuals will reduce to a low<br />
level and in certain cases form a horizontal pattern giving a good convergence<br />
indication. In order to further check, the converged flow field should not<br />
significantly change at further iterations. However, if the flow is inherently<br />
transient, the residuals will tend to oscillate at a relative high level without<br />
giving convergence. In such a case, very aberrant flow contours will be<br />
produced. The flow pattern will also most likely be asymmetric and changes<br />
at each subsequent iterations. Figure 4 illustrates and compares typical<br />
residual plots <strong>of</strong> such possible scenarios. It is noteworthy that the residual<br />
pattern might differ depending on the solver and model parameters.<br />
Woo, Huang, Mujumdar, Daud – CFD modeling <strong>of</strong> spray dryers 5
Initial conditions<br />
Steady state solution<br />
framework<br />
Semi-converged<br />
solution<br />
Converged solution<br />
Transient solution<br />
framework<br />
Converged transient<br />
solution<br />
Figure 3<br />
Numerical solution practice for spray dryer simulation<br />
Semi-converged<br />
Converged<br />
Figure 4<br />
Typical residual patterns for the initial steady state<br />
solution<br />
Woo, Huang, Mujumdar, Daud – CFD modeling <strong>of</strong> spray dryers 6
If the former case is encountered, it is then a good indication that the<br />
less computationally expensive steady state solution is suitable for the model;<br />
flow is inherently steady. However, although a converged solution might be<br />
achieved in the steady state, it is important to check if the solution is<br />
physically ‘logical’. Although not reported, it was found that certain<br />
numerically converged solutions produce aberrant flow patterns. Such<br />
aberrant behaviour was alleviated when the solution was changed to the<br />
transient framework. On the other hand, the oscillating residual pattern as<br />
mentioned above is definitely a good indication to switch to the transient<br />
solution framework, using the semi-converged solution from the steady state.<br />
Both <strong>of</strong> these numerical aspects were reported by Woo et al. (2009) and<br />
Ullum (2006). In addition, one should also check if the flow field significantly<br />
changes at subsequent iterations after ‘convergence’. If the flow field<br />
changes significantly or even produces aberrant flow contours, then it is most<br />
likely an indication <strong>of</strong> inherently transient behaviour.<br />
Another key numerical aspect is in the refinement <strong>of</strong> the mesh used. It is<br />
common CFD practice to perform mesh independence tests particularly for<br />
regions <strong>of</strong> high gradients. This is normally undertaken by systematically and<br />
progressively using smaller mesh sizes until the solution is independent <strong>of</strong> the<br />
mesh size. However, for such possibly self sustained fluctuation flow, on top<br />
<strong>of</strong> providing mesh independence to the solution, the mesh size also<br />
determines whether or not the possibly transient flow structures are captured.<br />
This was firstly reported by Oakley et al. [25] , where their steady axisymmetric<br />
solution becomes progressively unsteady when the mesh size was reduced to<br />
a certain high refinement. Although not specifically shown, Langrish et al. [5]<br />
also observed such numerical behaviour in their Very Large Eddy Simulations<br />
(VLES) <strong>of</strong> a pilot unit. Such a numerical behaviour is attributed to the ability to<br />
capture smaller flow structures as too coarse a mesh will make the solution<br />
too diffusive, thus damping out any transient behaviour. Woo et al. (2009)<br />
further reported on this behaviour by using an extensive combination <strong>of</strong> mesh<br />
sizes and chamber diameter [23] . In their three-dimensional simulation work on<br />
a short-form co-current spray dryer, a total <strong>of</strong> 946071 mesh elements are<br />
warranted for a transient solution whereas a mesh <strong>of</strong> only 288511 produces a<br />
steady state flow solution without any self-sustained fluctuations.<br />
Two dimensional versus three-dimensional<br />
Consideration in using a two-dimensional (including axisymmetric models) or<br />
three-dimensional simulation will greatly affect the computational time and<br />
resources (Figure 4). Such requirements are further amplified in transient<br />
simulations as the flow field needs to be developed and statistical averaging<br />
might be required in the transient framework [21][26] . Most early work typically<br />
utilizes the axisymmetric [25][27] and two-dimensional models [10-11] . In recent<br />
reports, workers have shifted to three-dimensional simulations [23][26][28] . Apart<br />
from the computational requirements, another important consideration<br />
between the two approaches concerns the ability to capture any possible<br />
transient behaviour in the flow. Guo et al. [20] have shown that transient<br />
fluctuation, particularly <strong>of</strong> the central jet, is three-dimensional. To be more<br />
precise, the jet tends to flap about a moving axis precessing around the<br />
chamber. Further illustration <strong>of</strong> such fluctuation is illustrated by Woo et al.<br />
using the jet feedback mechanism [23] . Using a two-dimensional model for<br />
such flows will prohibit the precision <strong>of</strong> the model in capturing such important<br />
Woo, Huang, Mujumdar, Daud – CFD modeling <strong>of</strong> spray dryers 7
flow structures; limiting any possible transient behaviour to a two-dimensional<br />
plane. In certain cases, such restriction might even make the flow behave in<br />
a steady like behaviour. This was observed in simulations <strong>of</strong> a rotary<br />
atomizer fitted pilot unit using both the three-dimensional and the<br />
axisymmetric approach [23][27] . Such numerical implications could be due to the<br />
inability <strong>of</strong> axisymmetric simulations to capture possible cross-flows as well as<br />
flow rotation (or swirls) which might not be uniform along the circumference <strong>of</strong><br />
the chamber. Therefore, these factors should be kept in mind when<br />
interpreting an axisymmtric simulation <strong>of</strong> a spray dryer. However, it is<br />
important to note that an axisymmetric approach drastically reduces the<br />
computational resources and time in a compromise with accuracy.<br />
Turbulence modelling approach<br />
All the CFD simulations undertaken so far are confined to the Reynolds<br />
Averaged Navier-Stokes (RANS) approach in which the large scale turbulent<br />
eddies are modelled. Under this family, different closures were reported in<br />
the literature. However, it would not be useful to specifically pinpoint any<br />
particularly useful model as myriad flow patterns can be observed in a<br />
chamber: e.g. non-swirling, vane induced swirls, rotating disc induced swirls.<br />
Rather, it will be useful to identify how different turbulence models work for<br />
different situations. Most <strong>of</strong> the simulations reported in the literature uses the<br />
conventional work horse for the CFD technique, k-e closures [26][29][30] . For<br />
highly swirling flow induced by a rotating atomizer, a very useful comparison<br />
can be found in the report by Huang et al. [12] in which the different variant <strong>of</strong><br />
k-e closures were tested against the anisotropic Reynolds Stress Model<br />
(RSM). Taking the RSM as a basis, Huang et al. concluded that the RNG<br />
variant <strong>of</strong> the k-e closure can be a suitable and computationally economical<br />
approach. In terms <strong>of</strong> transient simulations, Langrish and his associates [5][28]<br />
have shown that the k-e closure as well as the Shear Stress Transport (SST)<br />
method, which is a hybrid between the k-e and k-w closure, has the ability to<br />
capture the fluctuation frequencies relatively well.<br />
In these conventional RANS based turbulence closures, the resolution <strong>of</strong><br />
the turbulence scale in the simulation is limited by the size <strong>of</strong> the mesh used.<br />
It might be important, although yet to be illustrated, that the capturing <strong>of</strong> these<br />
small scale turbulences might significantly affect subsequent transport <strong>of</strong> the<br />
particles or droplets in the chamber. Recently, Fletcher and Langrish [31]<br />
evaluated the use <strong>of</strong> the Scale-Adaptive-Approach (SAS) technique applied to<br />
the SST closure to capture the smaller turbulence scales without the need to<br />
use a relatively much finer mesh. It was found that the SAS-SST technique<br />
was able to capture some <strong>of</strong> the transient eddies previously observed in the<br />
pilot scale experiments [16] .<br />
Woo, Huang, Mujumdar, Daud – CFD modeling <strong>of</strong> spray dryers 8
Uniform gradient<br />
rotation<br />
Possible cross-flows<br />
Possible nonuniform<br />
gradient<br />
rotation<br />
Figure 5<br />
Axisymmetric and three-dimensional considerations<br />
2.2 Particle tracking and atomization<br />
Particle loading in a spray dryer is relatively dilute. On top <strong>of</strong> that, unlike<br />
other multiphase particle-air processes such as the fluidized bed or pneumatic<br />
powder conveying, the particles in a spray dryer are not in constant contact<br />
with each other. In fact, contact between the particles can be viewed as<br />
‘instantaneous’. It is for these reasons, the Euler-Lagrange method is<br />
preferred in all the work reported hitherto. Apart from that, stemming from the<br />
development <strong>of</strong> the Particle-Source-In-Cell method developed by Crowe et al.<br />
[32], it is also more realistic to incorporate the droplet drying phenomenon<br />
through the Euler-Lagrange method. Nevertheless, there are also reports<br />
where the Eulerian-Eulerian method is employed treating both the<br />
droplet/particle and the gas phase as interpenetrating continuum liquid. This<br />
treatment <strong>of</strong> particle tracking will not be covered in here and an illustration in<br />
the application <strong>of</strong> this approach can be found in the work <strong>of</strong> Li et al. [33] . It is<br />
noteworthy that the pure evaporative model used in the work <strong>of</strong> Li et al. has to<br />
be modified in the application <strong>of</strong> spray drying in order to account for the solid<br />
formation <strong>of</strong> the droplets.<br />
In the Euler-Langrange method, a spray or a steam <strong>of</strong> atomized liquid is<br />
represented by a distribution <strong>of</strong> parcels. Each parcel represents a group <strong>of</strong><br />
particles with the same size and mass (Figure 6). It is then assumed that<br />
particles <strong>of</strong> the same size and mass follow the same path. Such an approach<br />
does not necessitate the need to track a huge number <strong>of</strong> particles. The<br />
parcels are then individually tracked throughout the flow field following<br />
Newton’s drag law <strong>of</strong> motion assuming that all the particles in a parcel follows<br />
the same path due to the similarity in mass and diameter,<br />
Woo, Huang, Mujumdar, Daud – CFD modeling <strong>of</strong> spray dryers 9
( ρ − ρ)<br />
du<br />
g<br />
P X P<br />
= FD<br />
( u − uP<br />
) +<br />
F<br />
dt<br />
ρ<br />
+<br />
P<br />
X<br />
p<br />
(1)<br />
where F<br />
D<br />
, drag force, is normally expressed in the following form assuming<br />
spherical particles,<br />
F<br />
D<br />
18µ<br />
C<br />
D<br />
Re<br />
= (2)<br />
2<br />
ρ d 24<br />
P<br />
P<br />
with the Re given by,<br />
ρd<br />
P<br />
u<br />
P<br />
− u<br />
Re =<br />
(3)<br />
µ<br />
Another advantage from this method is that additional forces can be<br />
easily incorporated into the model. This feature has found applications in<br />
other fields such as spray coating which utilizes electrostatics to manipulate<br />
the spray trajectories. Some reports can be found in experimentally charging<br />
particles during spray drying in an attempt to reduce the deposition problem<br />
[34] . However, there is yet to be incorporation <strong>of</strong> additional forces in the<br />
modelling effort so far. Additional forces such as the Basset or Magnus forces<br />
are normally not incorporated due to the relatively big difference in density<br />
between air and a typical particle found in spray drying. Turbulence<br />
dispersion <strong>of</strong> the particles is normally modelled by the Random Walk type <strong>of</strong><br />
model which is based on the principle that a parcel successively enters and<br />
leaves random eddies distributed throughout the domain. Mathematical<br />
details for such stochastic treatment <strong>of</strong> particle dispersion can be found in the<br />
chapter on Lagrangian particle tracking in this book (Sukgoo et al. – Chapter<br />
10). Figure 7 shows the random stochastic obtained for a same particle<br />
injected into a simulated flow field.<br />
Although the Lagrangian tracking method has been widely used and is<br />
the accepted method in modelling particle movements in the chamber, there<br />
is virtually no development done in this area with application to spray drying.<br />
Only some validation work was undertaken to validate such Lagragian particle<br />
tracking by measuring particle concentration and sizes in different regions <strong>of</strong><br />
the chamber [35-36] .<br />
Important consideration when applying the Lagrangian technique is in<br />
coupling with the flow field. As a particle is tracked from its injection, it<br />
generates momentum, energy and species source terms in the CFD domain<br />
in which it passes. While the effect <strong>of</strong> species and energy source terms on the<br />
flow field is apparent, there can be debate in the significance <strong>of</strong> the<br />
momentum coupling due to the aforementioned low particle loading;<br />
particularly for ‘cold flow’ research applications in which heat and mass<br />
transfer from the droplet is not considered [28] . In the region near the<br />
atomizer, where the particles are yet to be dispersed, particle loading can be<br />
quite high going beyond the recommended threshold for one-way coupling [32] .<br />
Woo, Huang, Mujumdar, Daud – CFD modeling <strong>of</strong> spray dryers 10
Depending on the case, such high loading can significantly affect the flow field<br />
near the atomizer which subsequently affects the flow field in the other<br />
downstream regions [4] . Recently, in a full transient simulation, the effect <strong>of</strong><br />
particles on the flow field was further illustrated by Jin and Chen [26] .<br />
In the wake <strong>of</strong> recent developments in transient CFD simulations <strong>of</strong><br />
spray dryers, usage <strong>of</strong> the steady or transient particle tracking has also<br />
emerged as an important consideration. Figure 8 shows the difference in<br />
numerical procedures when implementing full coupled steady or transient<br />
particle tracking. In the steady approach, particles are injected and tracked<br />
until it reaches the boundary <strong>of</strong> the simulation domain [11][23][28] . On the other<br />
hand, in the transient approach, particles are typically tracked and penetrate<br />
the flow field following the simulation time step and duration [21][22] . This has<br />
three major implications: (1) relatively large simulation time is required for all<br />
the injected parcels to initially penetrate the simulation domain, (2) once the<br />
particles have penetrated the flow field, further transient duration is required<br />
for any statistical analysis <strong>of</strong> the particle simulations, (3) particles have to be<br />
injected at each time step drastically increasing memory requirements<br />
(increasing total number <strong>of</strong> particle in simulation). It is also clear that the<br />
coupling iterations are required for each time step in the transient tracking<br />
making it computationally expensive. Therefore, full transient air-particle<br />
simulation is a very computationally expensive undertaking. In terms <strong>of</strong><br />
coupling with the continuous phase as alluded to earlier, for steady state<br />
particle tracking, it is important to incorporate these source terms in<br />
developing the flow field by repeatedly injecting the particles and reiterating<br />
flow field until insignificant change occurs in the computed flow field.<br />
Many different atomizers can be found in spray drying. For example: eg.<br />
pressure nozzle, ultrasonic nozzle, two fluid nozzle and rotary disk. In a CFD<br />
simulation, these different atomizers are characterized by the particle size<br />
distribution, mass flow rate and the initial particles velocity components. As<br />
noted by Kieviet et al. [10] , getting these initial parameters can be a big<br />
challenge by itself. While the mass flow rate can be easily known as an<br />
overall simulated operation capacity, the latter two parameters are less<br />
apparent. Most commercial nozzles and rotary disks come with specifications<br />
<strong>of</strong> the droplet size distribution; the former includes the cone angle.<br />
Woo, Huang, Mujumdar, Daud – CFD modeling <strong>of</strong> spray dryers 11
Group <strong>of</strong> particles<br />
with the same mass<br />
and diameter<br />
Particle parcel<br />
Group <strong>of</strong> particles<br />
with the same mass<br />
and diameter<br />
Figure 6<br />
Tracking <strong>of</strong> a parcel <strong>of</strong> particles<br />
Figure 7<br />
Stochastic tracks <strong>of</strong> a particle incorporating turbulence<br />
dispersion<br />
However, it is important to note that the resultant droplet size distribution<br />
or cone angle is strongly dependent on the feed material and the operation <strong>of</strong><br />
the atomizer such pressure and feed rate. For their simulations, Kieviet et<br />
al. [10] characterized their atomizer by collecting and measuring maltodextrin<br />
droplets in silicone oil. Huang et al. [35] and Nijdam et al. [37] used laser<br />
diffraction technique to obtain particle size distribution <strong>of</strong> their atomizers. Al-<br />
Hakim et al. [38] further used PDA to obtain the initial droplet velocity from their<br />
nozzle. In the absence <strong>of</strong> experimental data, correlations for the initial droplet<br />
Woo, Huang, Mujumdar, Daud – CFD modeling <strong>of</strong> spray dryers 12
size distribution and the initial velocity for both rotating and nozzle atomizers<br />
can be found in Masters’ Handbook [39] . However, in view <strong>of</strong> the myriad<br />
designs <strong>of</strong> an atomizer, it is important to assess the applicability <strong>of</strong> these<br />
correlations. Huang et al. [37] recently re-evaluated its applicability and noted<br />
that the effect <strong>of</strong> viscosity has to be further incorporated into one <strong>of</strong> the<br />
correlations available for a rotary atomizer.<br />
Initial calculation <strong>of</strong><br />
flow field<br />
Initial calculation <strong>of</strong><br />
flow field<br />
Repeat for all<br />
particles<br />
Particle injection<br />
Simulataneous<br />
injection <strong>of</strong> all<br />
particles<br />
Lagrangian tracking <strong>of</strong> particle<br />
throughout the CFD domain<br />
until termination at boundary<br />
Lagrangian tracking <strong>of</strong> newly<br />
injected particles as well as<br />
existing particles in the domain<br />
Source terms generated in<br />
the flow field<br />
Source terms generated in<br />
the flow field<br />
Coupling calculation <strong>of</strong><br />
flow field<br />
Converged solution<br />
If not<br />
converged<br />
Coupling calculation <strong>of</strong><br />
flow field<br />
Advance in<br />
simulation time<br />
a<br />
b<br />
Figure 8<br />
Typical numerical procedure for coupled Lagrangian particle<br />
tracking: (a) steady state and (b) transient simulation<br />
Typically, nozzle atomization is implemented by injecting particle into the<br />
domain at a point corresponding to the location <strong>of</strong> the nozzle. For the rotating<br />
disk atomization, Huang et al. [40] devised a novel method by evenly putting<br />
multiple particle injection points around the peripheral <strong>of</strong> the side wall <strong>of</strong> the<br />
disk. An important note when modelling the rotating disk is to set the disk<br />
walls (boundary conditions) to give a rotational momentum source term to the<br />
flow field. This modelling effort is crucial as the rotation <strong>of</strong> the disk will impart<br />
significant swirls to the chamber, stabilizing as well as resulting in recirculation<br />
Woo, Huang, Mujumdar, Daud – CFD modeling <strong>of</strong> spray dryers 13
vortex in the region below the disk [16] . Building up from the method by Huang<br />
et al. [40] , some recent work has also incorporated the pumping effect caused<br />
by the construction <strong>of</strong> the rotating disk [4] . Explanation and experimental<br />
observation <strong>of</strong> this pumping effect can be found in the papers provided here<br />
[41] .<br />
2.3 Droplet drying in CFD simulations<br />
There is a lot <strong>of</strong> development in the area <strong>of</strong> droplet drying which includes<br />
comprehensive diffusion models [42-44] and other semi-empirical models [45][46] .<br />
Description <strong>of</strong> these models and the fundamental phenomenon in droplet<br />
drying will be covered in another chapter in this e-book. The focus <strong>of</strong> this<br />
section is only on the modelling approach applicable to CFD modelling.<br />
In general, as noted by Kieviet et al. [47] , it is not practical to implement<br />
the diffusion type model in a CFD simulation due to the high numerical<br />
demand and complexity in the solution <strong>of</strong> these models. One way is to use a<br />
simplified version <strong>of</strong> the diffusion model [47] . Utilizing this model, their CFD<br />
simulation produced humidity and temperature pr<strong>of</strong>iles which followed very<br />
well to the measured field in their pilot scale unit. In contrary, Lo [48] and<br />
Verdumen et al. [6] adopted the full diffusion model for their CFD simulations <strong>of</strong><br />
industrial scale spray dryers.<br />
For simplicity, another approach adopted by some authors is to treat the<br />
mixture droplets as pure water [12][13] . In essence, it is assumed that drying <strong>of</strong><br />
a droplet continues in a saturated manner without any falling rate period. In<br />
the event that the particle reaches the boiling point, it is further assumed that<br />
the moisture is ‘boiled <strong>of</strong>f’ from the particle or droplet. Huang et al. [14] showed<br />
that this approach managed to reproduce the experimental measurements <strong>of</strong><br />
Kieviet et al. [10] .<br />
Recent developments have moved to the use <strong>of</strong> semi-empirical models.<br />
Two such semi-empirical models are the: (1) Characteristic <strong>Drying</strong> Curve<br />
(CDC) and (2) Reaction Engineering Approach (REA). The CDC approach<br />
assumes that the falling rate period follows a fixed pattern. Langrish and<br />
Kockel [46] developed the CDC approach for spray drying with application <strong>of</strong><br />
milk and proposed a linear falling rate. Such linear falling rate was also used<br />
by Zbicinski et al. [49] for maltodextrin solutions. However, there can also be<br />
many falling rate pattern such as a convex or concave shape. Huang et al. [12]<br />
evaluated the effect <strong>of</strong> different falling rate pattern in their CFD simulations.<br />
Building up form their work, Woo et al. [50] further noted that suitable shape <strong>of</strong><br />
the falling rate period is strongly dependent on the droplet material by making<br />
comparison with single droplet experimental data <strong>of</strong> carbohydrates. In<br />
general, following the suggestion <strong>of</strong> Langrish and Kockel [46] , the CDC<br />
mathematically takes the form,<br />
d X<br />
dt<br />
Ah<br />
m ∆H<br />
= f ( T − T )<br />
(4)<br />
S<br />
evap<br />
a<br />
wb<br />
Woo, Huang, Mujumdar, Daud – CFD modeling <strong>of</strong> spray dryers 14
f<br />
( X − X<br />
eq<br />
)<br />
( X − X )<br />
n<br />
⎡ ⎤<br />
= ⎢ ⎥ , X ≤ X<br />
cr<br />
⎢⎣<br />
cr eq ⎥⎦<br />
f = 1 , X > X<br />
cr<br />
On the other hand, the REA visualizes the drying process as an activation<br />
process in which an ‘energy’ barrier has to be overcome for moisture removal<br />
to occur [51] . The drying rate then takes the following form,<br />
d m<br />
dt<br />
h<br />
A<br />
( k P ( T ) − P )<br />
m<br />
= −<br />
v, sat d v,<br />
∞<br />
ms<br />
(5)<br />
The core <strong>of</strong> this model lies in modelling the fracitonality term, k , which should<br />
progressively reduce as moisture is being removed. This fractionality is<br />
expected to be a function <strong>of</strong> moisture and temperature, which can be<br />
approximated by,<br />
⎛ ∆EV<br />
⎞<br />
k = exp ⎜−<br />
⎟<br />
(6)<br />
⎝ RT ⎠<br />
where ∆E v is the apparent activation energy, which is likely to be dependent<br />
on the ‘mean’ or ‘average’ moisture. The original authors proposed the<br />
following function to be taken as the fingerprint <strong>of</strong> a material applicable to all<br />
drying conditions,<br />
∆E<br />
∆E<br />
v<br />
v,<br />
∞<br />
= a e<br />
−b<br />
( X −X<br />
) c<br />
∞<br />
(7)<br />
At high moisture content<br />
∆ E<br />
∆ E<br />
V<br />
V , ∞<br />
→ 0<br />
, k →1<br />
(8)<br />
At low moisture content<br />
∆ E<br />
∆ E<br />
V<br />
V , ∞<br />
→1<br />
, 0 < minimal K value<<br />
1<br />
(9)<br />
Application <strong>of</strong> the REA model in CFD simulations can be found [21][26][27] .<br />
Good comparison was obtained with experimental data. A general<br />
comparison between the two approaches, CDC and REA, can be found in the<br />
review by Chen [52] . With application to CFD simulations, Woo et al. [27] further<br />
showed that both approaches response differently to the initial droplet<br />
moisture. It is important for the reader to assess these differences and<br />
behaviour <strong>of</strong> the models when applying them in their CFD simulations.<br />
Woo, Huang, Mujumdar, Daud – CFD modeling <strong>of</strong> spray dryers 15
Another development is in the use <strong>of</strong> the droplet drying model in<br />
predicting particle quality. Harvie et al. [29] used the predicted particle<br />
moisture to further compute and determine the stickiness <strong>of</strong> the particles in<br />
their CFD simulation. This concept was extended by Woo et al. [27][50] to<br />
determine particle surface rigidity exploiting the ability <strong>of</strong> the Reaction<br />
Engineering Approach to compute surface moisture. Such surface<br />
computation might have implications in deposition or any surface quality<br />
predictions using the CFD technique. As noted in a few reports [21][27] , usage<br />
<strong>of</strong> such surface moisture computation will have big implication particularly in<br />
modelling preservation <strong>of</strong> surface active materials, such as proteins or<br />
bioactive substance, within the droplets.<br />
Coming in from the industrial perspective, the CFD team in Niro has<br />
adopted an alternative semi-empirical approach in modelling droplet drying.<br />
The approach is based on the development <strong>of</strong> an acoustic levitation dryer in<br />
which a droplet can be levitated and evaporated while its drying rate can be<br />
continuously monitored [53] . From the acoustic levitator, extensive sets <strong>of</strong><br />
drying rates data, specific to the material, can be determined at different<br />
drying conditions and inserted into the CFD simulation corresponding to the<br />
condition <strong>of</strong> the Lagrangian parcel in the domain. Recent reports from Ullum<br />
[54]<br />
indicate that this approach corresponds well with pilot scale data. This<br />
useful predictive tool, under the tradename Drynetics, is already commercially<br />
used in their design and optimization work (www.foodproductiondaily.com).<br />
2.4 Wall deposition modelling<br />
Sticking criterion<br />
The wall deposition model determines the fate <strong>of</strong> the particles when they<br />
are tracked and reaches the simulation boundary (wall). Choosing a suitable<br />
wall deposition model will affect the prediction <strong>of</strong> yield and final product<br />
moisture prediction. Most <strong>of</strong> the simulations reported in the literature utilize<br />
the stick-upon-contact approach [12][30][55] . In essence, it is assumed that once<br />
a parcel touches the simulation boundaries (wall), it will be adhered and<br />
removed form the simulation.<br />
This approach is a simplifying assumption which does not capture the<br />
important effect <strong>of</strong> particle rigidity on the collision outcome. It has been a<br />
common practice and as illustrated by Bhandari and his co-workers, that<br />
increasing the rigidity <strong>of</strong> the particles increases the yield from the spray drying<br />
process [56][57] . Such an effect was also fundamentally investigated by Zuo et<br />
al. [58] using a particle gun experimental setup in which powders are<br />
pneumatically impinged onto a substrate wall material. Along this line,<br />
Ozmen and Langrish [59] investigated this effect in a pilot scale spray dryer<br />
unit and arrived at a deposition model based on the Glass Transition – Sticky<br />
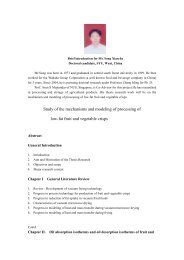
Point concept. Figure 8 shows the typical glass transition curve <strong>of</strong> lactose as<br />
predicted by the Gordon-Taylor correlation. From Figure 9, the glass<br />
transition temperature (and the corresponding sticky point temperature) is a<br />
strong function <strong>of</strong> the particle moisture. At higher moisture contents, the<br />
sticky point becomes lower and vice versa. If the particle temperature is<br />
Woo, Huang, Mujumdar, Daud – CFD modeling <strong>of</strong> spray dryers 16
above the sticky point, the particle is then deemed sticky and will adhere to<br />
the walls <strong>of</strong> the processing equipment.<br />
Following this concept, the sticky point <strong>of</strong> material is taken as the cut-<strong>of</strong>f<br />
point in determining whether or not a particle sticks to the wall. With<br />
application to amorphous carbohydrates, it is common to take the sticky point<br />
as 20-25 degrees higher than the glass transition point [27][29][42].<br />
80<br />
70<br />
Glass transition<br />
Approximated sticky point<br />
Temperature, °C<br />
60<br />
50<br />
40<br />
30<br />
Non-sticky<br />
region<br />
Sticky region<br />
20 °C<br />
20<br />
10<br />
0<br />
0.03 0.04 0.05 0.06 0.07 0.08 0.09 0.1 0.11<br />
%wt moisture<br />
Figure 9<br />
Typical glass transition and approximated sticky point curve for<br />
lactose<br />
However, it is noteworthy that this concept in using the glass transition<br />
as the cut <strong>of</strong>f point does not account for the effect <strong>of</strong> impacting velocity and<br />
angle on the collision outcome. Murti et al. [60] utilizing particle gun<br />
experiments have shown that the impact velocity and angle do affect the<br />
deposition <strong>of</strong> skim milk powders. A higher impact velocity causes a higher<br />
critical T-Tg value, which translates to a lower propensity for the particle to get<br />
adhered. Apart from that, it was also found that beyond the critical T-Tg<br />
value, a smaller impact angle reduces the dependency <strong>of</strong> particle stickiness<br />
on temperature. Therefore, the particle impacting momentum does affect the<br />
deposition outcome.<br />
In order to address these aspects <strong>of</strong> deposition modelling, a recent work<br />
involved the development <strong>of</strong> a rheology based deposition model [61] . The<br />
premise <strong>of</strong> this model is based on the viscoelastic property <strong>of</strong> amorphous<br />
particles <strong>of</strong>ten encountered in spray drying [62] . Starting from and assuming a<br />
Kelvin-Voigt element, the elastic and dissipation forces experienced by a<br />
particle can then take the form,<br />
F approach<br />
A<br />
= − ( E x + η v )<br />
(10)<br />
2 R<br />
Adopting the superposition technique, which is a commonly accepted<br />
technique in polymer sciences, master curves for the elastic and loss modulus<br />
in the equation above can be determined from DMTA experiments [63] . From<br />
the master curves coupled with the superposition technique, the rigidity <strong>of</strong> the<br />
particle at different temperatures, which is delineated by the elastic and loss<br />
Woo, Huang, Mujumdar, Daud – CFD modeling <strong>of</strong> spray dryers 17
modulus, can be obtained to be used in the collision modelling. From<br />
Equation xx, it can be seen that the effect <strong>of</strong> impacting velocity is also<br />
incorporated into the model. It is noteworthy that this approach is still at its<br />
infancy and full validation <strong>of</strong> this approach is currently in progress.<br />
Particle build-up and near wall particle transport<br />
These physical aspects in deposition modelling have not been attempted<br />
before in any CFD modelling <strong>of</strong> spray dryers. This section is aimed at giving<br />
some perspectives in this area and also to touch on some possible<br />
significance (or lack there<strong>of</strong>) in capturing such phenomena. Another aim <strong>of</strong><br />
this section is to let the reader become aware <strong>of</strong> the limitations in current CFD<br />
modelling effort when interpreting their own results.<br />
When particles get deposited onto the walls <strong>of</strong> the chamber, they tend to<br />
retain or continuously release moisture while in the deposited state. When<br />
the layers get sufficiently built-up, the released or trapped moisture can affect<br />
the overall humidity and temperature predictions in the chamber. This was<br />
observed in industrial operations (Dr. Huang – personal plant experience). To<br />
further complicate things, in certain materials such as dairy products, the<br />
deposition rate will tend to decrease overtime to reach a relatively constant<br />
deposit thickness in which the entrainment rate balances out the deposition<br />
rate. On top <strong>of</strong> that, there might also be tendency for the deposits to get<br />
dislodged and slide down as an ‘avalanche’ once it reaches a certain<br />
deposited weight [64] . Such deposit build-up phenomenon has been<br />
extensively modelled in CFD simulations <strong>of</strong> boilers [65] . In the CFD boiler<br />
simulation <strong>of</strong> Kaer et al. [65] , the combination <strong>of</strong> transient-steady approach was<br />
formulated which does not necessitate tracking the particles following the<br />
transient fluid flow time. It will be interesting if such technique is implemented<br />
or evaluated in the spray dryer framework. This can be an area to look at in<br />
future simulation development work.<br />
Another area in which methods can be adopted from CFD simulation <strong>of</strong><br />
boilers is in the near wall particle transport modelling. All the CFD simulations<br />
for spray dryers reported so far rely solely on Lagrangian tracking. This<br />
assumes that sufficient particle parcels are used to represent the dispersion <strong>of</strong><br />
the particle cloud near the wall (as well as in the central region <strong>of</strong> the<br />
chamber). Recently, Kaer et al. (2006) argued that although parcels are<br />
considered not depositing when they are tracked in the Lagrangian manner to<br />
move in parallel closely above a wall, in reality, part <strong>of</strong> the particles in the<br />
parcel might actually disperse away from the mean parcel flow to reach the<br />
wall [65] . Kaer et al. introduced a turbulent-pipe-deposition based dispersion<br />
model in the CFD simulation <strong>of</strong> a straw boiler on top <strong>of</strong> the typical lagrangian<br />
tracking dispersion model. Figure 13 illustrates in a simplified manner the<br />
difference between the current Lagrangian deposition tracking method and<br />
the deposition pipe based deposition model as proposed by Kaer et al. (2006)<br />
for boiler simulation. Attempt to use such a turbulent-pipe-deposition based<br />
deposition model was also made by Kota and Langrish [66] in their analysis by<br />
considering the spray dryer as a ‘large pipe’. However, this approach<br />
produced limited success in their analysis based on the experimental<br />
deposition fluxes obtained from a pilot scale unit. It will be interesting to see<br />
how such turbulent-pipe-deposition based model can be further developed for<br />
application in CFD simulation <strong>of</strong> spray dryers.<br />
Woo, Huang, Mujumdar, Daud – CFD modeling <strong>of</strong> spray dryers 18
2.5 Particle interaction modelling<br />
Most work reported in the literature does not consider particle<br />
interactions in their simulation. This is partly justified by the dilute loading <strong>of</strong><br />
the particles resulting in the particle being effectively separated form each<br />
other. However, recent interest to use CFD in predicting the final particle size<br />
due to agglomeration and coalescence has led to extensive developments in<br />
the interaction models under the EDECAD project [6] . Under this project,<br />
particle interactions were discriminated in the form <strong>of</strong>: droplet-droplet, dropletparticle<br />
and particle-particle interactions. The first interaction simply implies<br />
that droplets coalescence and form a larger droplet composed <strong>of</strong> the volume<br />
<strong>of</strong> the two coalescing droplets. For the latter two interactions, a Newtonianbased<br />
viscous penetration model was assumed to capture how particles will<br />
penetrate each other during collision to form agglomerates. On top <strong>of</strong><br />
collision criteria, part <strong>of</strong> the effort in modelling such particle interactions is also<br />
focused on a stochastic approach in determining collision partners for each<br />
particle in the simulation domain. Instead <strong>of</strong> relying on the ‘physical’ collision<br />
as predicted by the Lagrangian tracking, the developed approach determines<br />
the collision partner <strong>of</strong> a particle based on the distribution <strong>of</strong> the neighbouring<br />
particles within the computational cell [6] . Along the same line, Guo et al. [20]<br />
evaluated the applicability <strong>of</strong> the Lagrangian approach in modelling such<br />
stochastic particle collisions due to turbulent flow. A latter evaluation further<br />
confirms the advantage <strong>of</strong> the Lagrangian approach in modelling such<br />
turbulent dispersion <strong>of</strong> droplets [35] . From the EDECAD project, Relatively<br />
reasonable results were obtained from their approach in comparing with pilot<br />
scale experimental data [6] .<br />
Looking at a different aspect, on top <strong>of</strong> the coalescence phenomenon,<br />
Mezhericher et al. [55] recently showed that incorporation <strong>of</strong> particle-particle<br />
interaction (bouncing) does affect the dispersion <strong>of</strong> the particles in the<br />
chamber. Therefore, this lends further weight on the significance <strong>of</strong> particle<br />
interactions within the chamber. However, further experimental validation is<br />
required in this area.<br />
3.0 Simulation validation<br />
The flip side <strong>of</strong> any CFD simulation is model validation, which is a big<br />
challenge in spray drying due to the harsh conditions within the chamber<br />
which make local measurements extremely difficult- even impossible. The<br />
task is further complicated with the presence <strong>of</strong> droplets or particles which<br />
might foul measurement equipments inserted into the chamber. This section<br />
aims to introduce the current validation method available and also some <strong>of</strong> the<br />
experimental data available for comparison.<br />
Woo, Huang, Mujumdar, Daud – CFD modeling <strong>of</strong> spray dryers 19
3.1 Quantitative and qualitative airflow visualization<br />
One option for partial validation is to measure the velocity pr<strong>of</strong>iles within<br />
the chamber. As mentioned earlier, presence <strong>of</strong> droplets or particles and the<br />
harsh conditions in the chamber tend to hamper such measurements.<br />
Therefore, most measurements and experimental velocity pr<strong>of</strong>ile data<br />
available were done in ‘cold-flow’ conditions and without atomization <strong>of</strong> feed.<br />
Kieviet et al. [10] provided very useful air velocity pr<strong>of</strong>ile measurements<br />
from their pilot scale unit using a hotwire anemometer. This set <strong>of</strong><br />
experimental work has somehow recently emerged as a standard test case<br />
for many reports [14] . For the benefit <strong>of</strong> future experimenters, it is noteworthy<br />
that strong turbulent fluctuations might exist within the chamber depending on<br />
the location <strong>of</strong> measurement. Measurements near the central jet might exhibit<br />
relative high fluctuation whereas in the recirculation region near the wall<br />
region, fluctuations might be relatively lower. It is useful, as done by Kieviet et<br />
al. [10] , to report the average velocity as the mode <strong>of</strong> the velocity distribution<br />
and also to take note <strong>of</strong> the fluctuation range in measurements. This will<br />
ensure a more useful comparison with the CFD prediction. In a recent work,<br />
such a method was also adopted by Woo et al. [23] in their measurements in a<br />
pilot scale dryer.<br />
Apart from obtaining the average velocity pr<strong>of</strong>iles, another possible<br />
output in the usage <strong>of</strong> hotwire measurements is to produce data <strong>of</strong> the<br />
transient behaviour in the chamber. Such measurements can be found in the<br />
published work <strong>of</strong> Langrish and his co-workers to measure the long time-scale<br />
behaviour <strong>of</strong> the flow [16][67] . In analyzing these transient data, the Fast Fourier<br />
Transform (FFT) is a useful tool to analyze the transient data by transforming<br />
the time-series data into the frequency spectrum so that dominant or<br />
secondary frequencies in the flow can be identified [15] . Important criteria<br />
when choosing a hotwire measuring system for such transient analysis is to<br />
have sufficiently high sampling frequency and sampling intervals.<br />
Recently more advanced methods such as the Laser Doppler<br />
Anemometry (LDA) and PIV are used to provide more detailed measurements<br />
<strong>of</strong> the air flow [36][68] . Some special notes on these methods is that significant<br />
modifications has to be to allow such optical based measurements to<br />
penetrate into the chamber and high cost is involved in such methods. In<br />
order to use the LDA method, Bayly et al. [68] had to make measurements<br />
from a scale down spray tower made <strong>of</strong> transparent perspex. In the spray<br />
tower <strong>of</strong> Zbicinski et al. [68] , transparent observation panel were installed at<br />
different elevations to allow PIV measurement access. As to date, these<br />
methods were only used to provide average velocity contours but yet to be<br />
explored to provide transient data. Besides, flow in the presence <strong>of</strong> particles<br />
is bound to be different from the particle-free flowfield.<br />
In qualitative manner, flow visualization experiments had been carried<br />
out on pilot scale units using flexible turfs and smoke [16] . Turfs can be<br />
positioned at different regions in the chamber to provide a rough indication <strong>of</strong><br />
the flow direction in the chamber. However, usage <strong>of</strong> tufts will not be able to<br />
capture small length scale or low velocity structures. These small scale<br />
Woo, Huang, Mujumdar, Daud – CFD modeling <strong>of</strong> spray dryers 20
structures can then be visualized using smoke. There can be many options to<br />
introduce smoke into the chamber. When analyzing the atomization region,<br />
Langrish et al. [42] introduced smoke from the air inlet pipe to flow across their<br />
rotary atomizer. Smoke can also be introduced into the chamber via tubes or<br />
‘tube racks’ to be positioned at different regions <strong>of</strong> interest within the chamber<br />
[16] . Using smoke visualization, they managed to observe small eddy<br />
formations in the recirculation region when swirl was imparted to the flow by<br />
atomizer disk rotation. A key issue in using such visualization method<br />
particularly smoke visualization; is the illumination required to make the<br />
smoke contrastingly visible for analysis. The concentration <strong>of</strong> smoke in the<br />
region <strong>of</strong> interest is also another factor which makes this method useful.<br />
3.2 Humidity and temperature measurements<br />
A huge difficulty in measuring the humidity and temperature field is<br />
because <strong>of</strong> the presence <strong>of</strong> droplets and particles. A seminal advancement in<br />
this area was contributed by Kieviet et al. [47] in the development <strong>of</strong> a microseparator.<br />
This device allows particles or droplets in the air to be separated<br />
before reaching humidity and temperature probes which can be inserted into<br />
different regions in the chamber. Separation is achieved by enforcing a tight<br />
flow curvature <strong>of</strong> the particle-laden air, causing the particles to traverse the air<br />
flow and thus prevents any particle in reaching the measurement sensors.<br />
Incidentally, the development <strong>of</strong> the micro-separator by Kieviet et al. [47] also<br />
involved use <strong>of</strong> the CFD technique.<br />
3.3 Final product and deposition flux comparison<br />
For full CFD simulations incorporating particles injections, it is typical to<br />
make comparison <strong>of</strong> the predicted particle moisture with that <strong>of</strong> experiments.<br />
So far, there is limited comparison reported in the literature. Quantitative<br />
deposition flux data, hitherto, can be found in numerous reports [59][69][70].<br />
Deposition fluxes were mainly determined by inserting plates into the chamber<br />
and allowing the particles to deposit over a relatively short period <strong>of</strong> operation<br />
time. Based on the pilot scale experimental deposition fluxes, Kota and<br />
Langrish [28] noted that their simulations produced realistic deposition trends.<br />
However, the CFD prediction only produce reasonable quantitative match to<br />
the experimental data. Qualitative data particularly on regions <strong>of</strong> high<br />
deposition in industrial scale dryers was also reported by a few workers [71][72] .<br />
Such observations can certainly complement CFD simulations although only<br />
limited comparisons can be made due to the confidentiality <strong>of</strong> such<br />
commercial operations.<br />
Woo, Huang, Mujumdar, Daud – CFD modeling <strong>of</strong> spray dryers 21
3.4 Residence time measurements<br />
There has been attempt to characterize the residence time in the<br />
chamber utilizing the nuclear tracing approach [73] . Kieviet et al. [64] attempted<br />
to measure the residence time their pilot unit using pulsed injection <strong>of</strong><br />
coloured feed material. However, their experimental findings did not compare<br />
very well with correpsondign CFD simulations. Accurate prediction and<br />
validation <strong>of</strong> the residence time in spray drying will have big implication in the<br />
usage <strong>of</strong> the CFD technique to predict in-process crystallization [74] or<br />
preservation <strong>of</strong> biological material within the chamber [75] .<br />
4.0 A sample CFD simulation<br />
This section presents two samples <strong>of</strong> the prediction results for a co-current<br />
spray dryer fitted with a pressure nozzle. The CFD results for a steady state<br />
spray drying are compared with the published data <strong>of</strong> Kieviet et al. [10][47] .<br />
4.1 Steady state<br />
Problem description<br />
Figure 10 shows the tested spray dryer geometry used in this work which<br />
is the same as that studied by Kieviet [10] . The chamber is a cylinder-on-cone<br />
vessel, 2.215m in diameter and with a cylinder top section, height <strong>of</strong> 2.0m and<br />
the bottom cone with 1.725m height. The angle <strong>of</strong> the cone is 60 0 . Hot air is<br />
blown from the ceiling <strong>of</strong> the drying chamber through an annular tube which<br />
has an outer diameter <strong>of</strong> 495.6mm and an inner diameter <strong>of</strong> 411.6mm. The<br />
pressure nozzle is located at the center <strong>of</strong> drying chamber, 229mm away from<br />
the flat ceiling <strong>of</strong> chamber. There is an exit tube for the exhaust air conveying<br />
the dried particles at the center <strong>of</strong> the cone. The outlet diameter is 172mm.<br />
Mesh independence test<br />
The simulations are performed for steady state operations. The 2D<br />
axi-symmetrical model which is same as the model used by Kieviet [10] was<br />
selected for simulation. Square grids (size 0.03m) were used for the drying<br />
chamber. The results for airflow patterns and temperature fields were similar<br />
when different mesh sizes were used. Hence, the results are considered to be<br />
grid-independent. The number <strong>of</strong> grid point used for the geometry tested is<br />
3765.<br />
Woo, Huang, Mujumdar, Daud – CFD modeling <strong>of</strong> spray dryers 22
Figure 10<br />
Boundary conditions<br />
Tested geometry with dimensions in mm<br />
Cases A and B are defined as spray dryer without spray and with spray,<br />
respectively. Inlet air: The velocity <strong>of</strong> drying air is 7.36m/s for the case without<br />
spray and 9.078m/s with spray. Temperature <strong>of</strong> the air at inlet is set at 468K<br />
and its relative humidity is 75% at 25 o C. Outlet conditions: The outlet<br />
pressure is set at –150Pa, i.e., a fan is assumed to draw air out from the<br />
drying chamber. Chamber wall conditions: According to the options that could<br />
be selected for the present work in the FLUENT code, when a droplet/particle<br />
hits the wall <strong>of</strong> the drying chamber, it can be assumed to be “trapped” or<br />
“escaped” or “reflected” by the wall. Under the "trap" condition, all non-volatile<br />
material is “lost” from the calculation at the point <strong>of</strong> impact with the wall. The<br />
volatile material present in the trapped particle/droplet is assumed to be<br />
released to the gas phase at this point. However, under the “escape”<br />
condition, the particles are removed from the calculation at the point <strong>of</strong> impact<br />
with the wall. According to the "reflect" condition, the particles rebound <strong>of</strong>f the<br />
wall with a change in its momentum as defined by the coefficient <strong>of</strong> restitution.<br />
In this validation case, the “escape” boundary condition is used.<br />
The overall heat transfer coefficient from the wall to the outside <strong>of</strong> the<br />
drying chamber is estimated to be 3.5W/m 2 .K and the chamber wall is<br />
assumed to be made <strong>of</strong> 2mm thick stainless steel. This coefficient value is<br />
obtained by fitting published measurement results [10] with a simulation carried<br />
out with spray. <strong>Spray</strong> from nozzle: An “injection” condition is defined here to<br />
specify the spray with a given droplet size distribution. The droplet diameters<br />
and mass flow rates used are shown in Table 1. The spray mass flow rate is<br />
50kg/h (0.013889kg/s) with 42.5% solids content. The feed temperature is set<br />
at 300K. The spray angle is assumed to be 76 0 . The droplet size distribution is<br />
such that10 .0µ m is the minimum droplet diameter and 138 .0µ m is the<br />
maximum droplet diameter with an average droplet diameter<br />
D<br />
m<br />
<strong>of</strong><br />
70 .5µ m .<br />
The droplet diameter distribution is modeled using a Rosin-Rammler curve<br />
with these parameters and the spread parameter equal to 2.05. The droplet<br />
Woo, Huang, Mujumdar, Daud – CFD modeling <strong>of</strong> spray dryers 23
velocities at nozzle exit are fixed to be 59m/s (46.49m/s in the x-axis and<br />
36.32m/s in the y axis). In order to simplify the calculation, the feed physical<br />
properties are assumed to be those <strong>of</strong> water, except that the volatile content<br />
is allowed to change as drying proceeds.<br />
Table 1 Diameters and mass rate <strong>of</strong> droplets injected by the atomizer<br />
Droplet No. 0 1 2 3 4 5 6 7 8 9<br />
Diameter (10 -5 m) 1 1.67 2.35 3.02 3.69 4.37 5.04 5.72 6.39 7.06<br />
Mass rate (10 -4 kg/s) 3.31 5.62 7.71 9.47 10.8 11.6 11.9 11.8 11.3 10.4<br />
Droplet No. 10 11 12 13 14 15 16 17 18 19<br />
Diameter (10 -5 m) 7.74 8.41 9.08 9.76 10.4 11.1 11.8 12.5 13.1 13.8<br />
Mass rate (10 -4 kg/s) 9.3 8.09 6.83 5.62 4.50 3.51 2.67 1.98 1.43 1.01<br />
Turbulence model: For the 2D-axisymmetric model, the standard k-ε<br />
turbulence model was used. Because there is no swirling flow in the drying<br />
chamber, the standard k-ε model is expected to be an appropriate choice for<br />
simulating such a flow [Oakley, 1994]. The turbulent kinetic energy at the inlet<br />
was set at 0.027m 2 /s 2 and the energy dissipation rate at the inlet to be<br />
0.37m 2 /s 3 which are the same values as those used by Kieviet [10] . For<br />
tracking the droplets, the turbulent stochastic model (TSM) option was used.<br />
Turbulent stochastic tracking <strong>of</strong> droplets allows for the effect <strong>of</strong> random<br />
velocity fluctuations <strong>of</strong> turbulence on particle dispersion to be accounted for in<br />
the prediction <strong>of</strong> particle trajectories.<br />
Predicted results<br />
The predicted velocity pr<strong>of</strong>iles for Case A and measured results by Kieviet<br />
at different levels in the drying chamber are shown in Figure 11. Figure 11<br />
shows that the predicted velocities agree well with the measured results. It is<br />
seen that there is a non-uniform velocity distribution in the core region <strong>of</strong> the<br />
chamber. The highest velocity magnitude is about 7.0m/s at the 0.30m level.<br />
The velocity magnitude is reduced as the air goes into the chamber further<br />
due to the expanding area.<br />
Figure 12 shows the predicted temperature pr<strong>of</strong>ile for Case B and the<br />
measured data by Kieviet at different levels in the drying chamber. It is found<br />
that the predicted results agree well with the measured results. The simulation<br />
results provide details <strong>of</strong> the temperature field at different levels and<br />
anywhere inside the chamber. The measurement results however do not give<br />
such detail because <strong>of</strong> the limited number <strong>of</strong> measurement points.<br />
From the predicted temperature pr<strong>of</strong>iles (Figure 12), it is observed that the<br />
temperatures in the central core up to a radius <strong>of</strong> 0.1m are quite different at<br />
different levels, which is expected as a direct result <strong>of</strong> drying. There is only a<br />
minor radial variation in the gas temperature. The largest temperature<br />
changes usually occur at the first level. It is the result <strong>of</strong> very high heat and<br />
mass transfer rates in the nozzle zone due to high relative velocities between<br />
the gas and the droplets coupled with large temperature driven forces.<br />
Woo, Huang, Mujumdar, Daud – CFD modeling <strong>of</strong> spray dryers 24
Figure 11<br />
Comparison <strong>of</strong> velocity pr<strong>of</strong>iles between present prediction and<br />
Kieviet’s measurement at no spray condition<br />
Figure 12<br />
Comparison <strong>of</strong> temperature pr<strong>of</strong>iles between prediction and<br />
Kieviet’s measurement at spray condition<br />
4.2 Transient state<br />
The example below aims to illustrate the intricacy and certain numerical<br />
aspects <strong>of</strong> undertaking a transient spray dryer CFD simulation. A pilot scale<br />
cylinder on cone dryer (1.7m high with 1m diameter) is simulated (Figure 13<br />
a). The unit is equipped with a rotating atomizer at the top which imparts<br />
rotation to the flow field when the atomizer is operated (Figure 13b).<br />
Woo, Huang, Mujumdar, Daud – CFD modeling <strong>of</strong> spray dryers 25
Figure 13<br />
a<br />
b<br />
<strong>Spray</strong> dryer considered for the transient simulation (fitted with a<br />
rotating atomizer – <strong>National</strong> <strong>University</strong> <strong>of</strong> Malaysia)<br />
Southwell and Langrish [16] previously observed that such rotating flow,<br />
particularly the central core, is transient in behaviour. Figure 14 illustrates the<br />
flow pattern generated when a steady state or a transient is used in the<br />
simulation. It can be seen that a steady state simulation resulted in a very<br />
aberrant flow field. When the simulation was switched to the transient<br />
approach, the appropriate flow field was achieved. This illustrates the<br />
importance for future worker to firstly indentify the nature <strong>of</strong> the flow in the<br />
spray chamber when interpreting their own results.<br />
It was further found later on from the numerical work that the flow field is<br />
transient in terms <strong>of</strong> the rotating recirculation region. Figure 15 further<br />
compares the effect <strong>of</strong> incorporating swirls in a simulation; if swirls are<br />
physically present in the actually dryer operation such as those induced by<br />
inlet swirls or atomizer rotation. It is noteworthy that non-inclusion <strong>of</strong> these<br />
phenomenons, if it arises in the physical system, can result in completely<br />
different flow fields which will subsequently affect particle trajectory<br />
predictions.<br />
Steady state<br />
Transient<br />
Figure 14<br />
Comparison between flow fields generated using the steady and<br />
transient simulation approach for a predominantly transient flow<br />
Woo, Huang, Mujumdar, Daud – CFD modeling <strong>of</strong> spray dryers 26
Without rotation<br />
With rotation<br />
Figure 15<br />
Comparison between flow fields generated with and without<br />
atomizer rotation<br />
In comparison to the preceding example, transient particle tracking is<br />
used in this work. This means that the particles are tracked following the flow<br />
field simulation time. The implication <strong>of</strong> this, as can be alluded from Figure<br />
(16), is that it takes quite s significant amount <strong>of</strong> time for the particle to<br />
penetrate into the chamber. Therefore, interpretation and post-processing <strong>of</strong><br />
any transient results should only be undertaken discarding the initial portion <strong>of</strong><br />
the simulation so that the actual operating condition <strong>of</strong> the chamber can be<br />
analyzed and not only the initial ‘flow developing’ period. On the contrary, in<br />
the steady state particle tracking, each particle is tracked throughout the flow<br />
field one at a time, until it leaves or terminates at the boundary. These are<br />
important considerations in future transient simulation <strong>of</strong> a spray dryer.<br />
5.0 Typical applications<br />
This section aims to highlight the possible applications and usage <strong>of</strong><br />
modelling the spray drying process using the CFD technique. Applications<br />
can be found in troubleshooting the process or arriving at optimal operation<br />
and design <strong>of</strong> the unit.<br />
5.1 Operation and design optimization<br />
In terms <strong>of</strong> process troubleshooting, Straatsma et al. [11] illustrated the<br />
use <strong>of</strong> the CFD technique using an in-house NIZO-DrySim CFD code to<br />
troubleshoot a problem occurring in an industrial scale spray dryer fitted with a<br />
rotating atomizer. In their dryer, operation problem occurred when the rotary<br />
Woo, Huang, Mujumdar, Daud – CFD modeling <strong>of</strong> spray dryers 27
atomizer was operated at a higher capacity (faster rotation), giving strange<br />
behaviour. Although the operators suspected that this could be due to air bypass<br />
from the central air inlet to the outlets located at the side on the ceiling,<br />
they could not provide the evidence to facilitate modifications to the unit.<br />
From CFD simulations, they managed to show that the relatively higher<br />
atomizer rotation caused the air flow to by-pass to the air outlets without<br />
effectively penetrating the chamber.<br />
Time = 1 Time = 2 Time = 3<br />
Transient particle tracking<br />
Steady state<br />
particle tracking<br />
Figure 16<br />
Illustration for a transient and a steady state particle tracking<br />
approach<br />
Woo, Huang, Mujumdar, Daud – CFD modeling <strong>of</strong> spray dryers 28
In a process analogous to spray drying, spray cooler, Poh et al. [76]<br />
showed how the CFD technique can be used to assist in the modification <strong>of</strong><br />
an existing unit. In the industrial spray cooler investigated, collision between<br />
the hot molten fatty acid particle with the wall causes the production capacity<br />
to decrease. CFD simulations were then used to modifications to the inlet<br />
geometry to provide more swirl in the chamber which minimized the particle<br />
accumulation on the chamber wall. Other illustrations on the application <strong>of</strong><br />
the CFD technique to better understand and manipulate the airflow patterns<br />
includes studying the effect <strong>of</strong> chamber size and air inlet turbulence or design<br />
[5][23][29] .<br />
Operating parameters such as atomization can also be evaluated using<br />
CFD simulations. Straatsma et al. [11] and Langrish and Zbicinski [30] also<br />
used CFD simulations to assess the effect <strong>of</strong> cone spray angle on the<br />
deposition problem. Although it is relatively established that a wider spray<br />
angle results into more propensity for the particles to reach the wall,<br />
visualization from the CFD simulations allows clearer evidence for decision<br />
making.<br />
The CFD technique can also be used as an overall optimization tool for<br />
the process. Lo [48] used the CFD technique to determine the optimal<br />
operating condition <strong>of</strong> their spray tower to use minimal air flow rate in<br />
achieving the desired product quality in dairy products. Optimization was<br />
undertaken by looking at the yield, particle outlet moisture and particle outlet<br />
temperature as predicted by the CFD model.<br />
5.2 Exploring new ideas<br />
Using the advantage <strong>of</strong> CFD which enables the non-linearity <strong>of</strong> the<br />
process to be captured, Huang et al. [77] assessed and visualized the<br />
efficiency different chamber configurations. Some <strong>of</strong> the different<br />
configurations are the lantern type chamber and the inverted type spray dryer,<br />
in which standard design correlations might not be applicable. Along that line,<br />
Huang et al. [78] also evaluated the horizontal spray drying process,<br />
incorporating a bottom fluidized bed, using the CFD visualization technique.<br />
In a recent paper, Huang and Mujumdar [79] also proposed and evaluated a<br />
method <strong>of</strong> using low humidity conditions in a spray dryer to cater for drying <strong>of</strong><br />
heat sensitive materials. It was found that such operation conditions are<br />
advantageous for heat sensitive materials. Therefore, the CFD can be a cost<br />
effective method to explore and design new spray drying chambers. New<br />
ideas can be evaluated without the need for expensive pilot scale construction<br />
in the preliminary stage, particularly as a scale up tool as noted by Oakley [80] .<br />
As mentioned earlier, Niro has already reported the use <strong>of</strong> CFD in their<br />
commercial design <strong>of</strong> spray dryers. CFD could also be used in future for online<br />
control <strong>of</strong> spray dryers.<br />
Woo, Huang, Mujumdar, Daud – CFD modeling <strong>of</strong> spray dryers 29
6.0 Concluding remarks<br />
This chapter discusses the various important aspects <strong>of</strong> setting up a<br />
CFD model <strong>of</strong> a spray dryer. These different aspects are important as they<br />
cover the different physical phenomenon occurring simultaneously in the<br />
chamber during spray drying. Knowing the current developments as well the<br />
limitations in the modelling effort <strong>of</strong> each aspect is important to allow better<br />
interpretation <strong>of</strong> the CFD model. On the flip side <strong>of</strong> a CFD simulation is<br />
validation <strong>of</strong> the model, which is a big challenge in spray drying due to the<br />
harsh internal conditions <strong>of</strong> the chamber. A few common validation<br />
approaches are discussed and experimental data available in the literature<br />
was laid out. In the final part <strong>of</strong> this chapter, important applications <strong>of</strong> the<br />
CFD modelling effort in spray drying were discussed. The applications<br />
highlighted here is not exhaustive and illustration on other applications,<br />
particularly for industrial operations, are certainly welcome.<br />
7.0 References<br />
1. Tarek, J.; Ray, M. Application <strong>of</strong> computational fluid dynamics for<br />
simulation <strong>of</strong> drying processes: A review. <strong>Drying</strong> <strong>Technology</strong> 2010,<br />
28, 120-154.<br />
2. Mujumdar, A.S.; Wu, Z.H. Thermal drying technologies – cost effective<br />
innovation aided by mathematical modelling approach. <strong>Drying</strong><br />
<strong>Technology</strong>, 2008, 26(1), 145-153.<br />
3. Woo, M.W.; Daud, W.R.W.; Mujumdar, A.S.; Wu, Z.H.; Talib, M.Z.M.;<br />
Tasirin, S.M. Steady and transient flow simulations in short-form spray<br />
dryers. Chemical Product and Process Modelling 2009, 4(1), Article<br />
20.<br />
4. Ullum, T. Simulation <strong>of</strong> a spray dryer with rotary atomizer: The<br />
appearance <strong>of</strong> vortex breakdown. Proceedings <strong>of</strong> the 15 th International<br />
<strong>Drying</strong> Symposium 2006, pg. 251-257.<br />
5. Langrish, T.A.G.; Williams, J.; Fletcher, D.F. Simulation <strong>of</strong> the effects<br />
<strong>of</strong> inlet swirl on gas flow patterns in a pilot-scale spray dryer. Chemical<br />
Engineering Research and Design 2004, 82, 821-833.<br />
6. Verdumen, R.E.M.; Menn, P.; Ritzert, J.; Blei, S.; Nhumaio, G.C.S.;<br />
Sorenson, T.S.; Gunsing, M.; Straatsma, J.; Verschueren, M.; Sibeijn,<br />
M.; Schulte, G.; Fritsching, U.; Bauckhage, K.; Tropea, C.;<br />
Sommerfeld, M.; Watkins, A.P.; Yule, A.J.; Schonfeldt, H. Simulation<br />
<strong>of</strong> Agglomeration in <strong>Spray</strong> <strong>Drying</strong> Installations: The EDECAD Project.<br />
<strong>Drying</strong> <strong>Technology</strong> 2004, 22(6), 1403-146.<br />
7. Versteeg, H.K; Malalsekera, W. An introduction to Computational Fluid<br />
Dynamics: The Finite Volume Method. 2007. Pearson Education, New<br />
York.<br />
Woo, Huang, Mujumdar, Daud – CFD modeling <strong>of</strong> spray dryers 30
8. Harvie, D.J.E.; Langrish, T.A.G.; Fletcher, D.F. A Computational Fluid<br />
Dynamics Study <strong>of</strong> A Tall-Form <strong>Spray</strong> Dryer. TRANS. IChemE 2002,<br />
80(C), 163-175.<br />
9. Sano, Y. Gas flow behaviour in spray dryer. <strong>Drying</strong> <strong>Technology</strong> 1993,<br />
11(4), 697-718.<br />
10. Kieviet, F.G.; Van Raaij, J.; De Moor, P.P.E.A.; Kerkh<strong>of</strong>, P.J.A.M.<br />
Measurement and modelling <strong>of</strong> the air flow pattern in a pilot-scale<br />
spray dryer. Chemical Engineering Research and Design 1997, 75(3),<br />
321-328.<br />
11. Straatsma, J.; Van Houwelingen, G.; Steenbergen, A.E.; De Jong, P.<br />
<strong>Spray</strong> <strong>Drying</strong> <strong>of</strong> Food Products: Simulation Model. Journal <strong>of</strong> Food<br />
Engineering 1999, 42, 67-72.<br />
12. Huang, L.X.; Kumar, K.; Mujumdar, A.S. Computational Fluid Dynamic<br />
Simulation <strong>of</strong> Droplet <strong>Drying</strong> in a <strong>Spray</strong> Dryer. Proceedings <strong>of</strong> the 14 th<br />
International <strong>Drying</strong> Symposium 2004, pg. 326 – 333.<br />
13. Anandharamakrishnan, C.; Gimbun, J.; Stapley, A.G.F.; Rielly, C.D.<br />
Application <strong>of</strong> computational fluid dynamic simulations to sprayfreezing<br />
operations. In: 16th International <strong>Drying</strong> Symposium IDS 2008,<br />
9-12th November 2008, Hyderabad, India. Vol A pp. 537-545<br />
14. Huang, L. X.; Kumar, K.; Mujumdar, A.S. A comparative study <strong>of</strong> a<br />
spray dryer with rotary disc atomizer and pressure nozzle using<br />
computational fluid dynamic simulations. Chemical Engineering and<br />
Processing 2006, 45, 461-470.<br />
15. Southwell, D.B.; Langrish, T.A.G. The effect <strong>of</strong> swirl on flow stability in<br />
spray dryers. Chemical Engineering Research and Design 2001, 79,<br />
222-234.<br />
16. Southwell, D.B.; Langrish, T.A.G. Observations <strong>of</strong> flow patterns in a<br />
spray dryer. <strong>Drying</strong> <strong>Technology</strong> 2000, 18(3), 661-685.<br />
17. Lebarbier, C.; Kockel, T.K.; Fletcher, D.F.; Langrish, T. A.G.<br />
Experimental measurement and numerical simulation <strong>of</strong> the effect <strong>of</strong><br />
swirl on flow stability in spray dryers. Chemical Engineering Research<br />
and Design 2001, 79, 260-268.<br />
18. Guo, B.; Langrish, T.A.G.; Fletcher, D.F. Simulation <strong>of</strong> turbulent swirl<br />
flow in an axisymetric sudden expansion, AIAA Journal 2001a, 39(1),<br />
96-102.<br />
19. Guo, B.; Langrish, T.A.G.; Fletcher, D.F. Numerical simulation <strong>of</strong><br />
unsteady turbulent flow in axisymmetric sudden expansions. Journal <strong>of</strong><br />
Fluids Engineering 2001b, 123, 574-587.<br />
20. Guo, B.; Langrish, T.A.G.; Fletcher, D.F. Simulation <strong>of</strong> gas flow<br />
instability in a spray dryer. Chemical Engineering Research and Design<br />
2003, 81, 631-638.<br />
21. Jin, Y.; Chen, X.D. Numerical Study <strong>of</strong> the <strong>Drying</strong> Process <strong>of</strong> Different<br />
Sized Particles in an Industrial-Scale <strong>Spray</strong> Dryer. <strong>Drying</strong> <strong>Technology</strong><br />
2009, 27(3), 371-381.<br />
22. Mezhericher, M.; Levy, A.; Borde, I. Modeling <strong>of</strong> droplet drying in spray<br />
chambers using 2D and 3D computational fluid dynamics. <strong>Drying</strong><br />
<strong>Technology</strong> 2009, 27, 359-370.<br />
23. Woo, M.W.; Daud, W.R.W.; Mujumdar, A.S.; Talib, Wu, Z.H.; M.Z.M.,<br />
Tasirin, S.M. Steady and transient flow simulations in short-form spray<br />
Woo, Huang, Mujumdar, Daud – CFD modeling <strong>of</strong> spray dryers 31
dryers. Chemical Product and Process Modelling 2009, 4(1), Article<br />
20.<br />
24. Maurel, A.; Ern, P.; Zielinska, B.J.A.; Wesfreid, J.E. Experimental<br />
study <strong>of</strong> self-sustained oscillations in a confined jet. Physical Review E<br />
1996, 54(4), 3643-3651.<br />
25. Oakley, D.E.; Bahu, R.E. <strong>Spray</strong>/Gas mixing behaviour within spray<br />
dryers. Proceedings <strong>of</strong> the 6 th International <strong>Drying</strong> Symposium 1991,<br />
pg. 303-313.<br />
26. Jin, Y.; Chen, X.D. A Three-Dimensional Numerical Study <strong>of</strong> the<br />
Gas/Particle Interactions in an Industrial-Scale <strong>Spray</strong> Dryer for Milk<br />
Powder Production. <strong>Drying</strong> <strong>Technology</strong> 2009, 27(10), 1018-1027.<br />
27. Woo, M.W.; Daud, W.R.W.; Mujumdar, A.S.; Wu, Z.H.; Talib, M.Z.M.;<br />
Tasirin, S.M. Evaluation <strong>of</strong> droplet drying models in a CFD spray<br />
drying environment. <strong>Drying</strong> <strong>Technology</strong> 2008, 26(10), 1180-1198.<br />
28. Kota, K.; Langrish, T.A.G. Prediction <strong>of</strong> Deposition Patterns in a Pilot-<br />
Scale <strong>Spray</strong> Dryer Using Computational Fluid Dynamics (CFD)<br />
Simulations. Chemical Product and Process Modeling 2007, 2(3),<br />
Article 26.<br />
29. Harvie, D.J.E.; Langrish, T.A.G.; Fletcher, D.F. Numerical simulations<br />
<strong>of</strong> gas flow patterns within a tall-form spray dryer. Chemical<br />
Engineering Research and Design 2001, 79, 235-248.<br />
30. Langrish, T.A.G.; Zbicinski, I. The Effects <strong>of</strong> Air Inlet Geometry and<br />
<strong>Spray</strong> Cone Angle on the Wall Deposition Rate in <strong>Spray</strong> Dryers.<br />
Transaction <strong>of</strong> IChemE 1994, 72(A), 420-430.<br />
31. Fletcher, D.F.; Langrish, T.A.G. Scale-adaptive simulation (SAS)<br />
modelling <strong>of</strong> a pilot-scale spray dryer. Chemical Engineering Research<br />
and Design 2009, 10, 1371-1378.<br />
32. Crowe, C.T.; Sharma, M.P.; Stock, D.E. The particle-source-in-cell<br />
(PSI-Cell) model for gas-droplet flows. Journal <strong>of</strong> Fluid Engineering<br />
1977, 99,325-332.<br />
33. Li, T..; Pougatch, K.; Salcudean; Grecov, D. Numerical simulation <strong>of</strong><br />
an evaporative spray in a gas-solid crossflow. International Journal <strong>of</strong><br />
Chemical Reactor Engineering 2010, 8, A43.<br />
34. Johnson, R.K.; Anantheswaran R.C.; Law, S.E. Electrostatic-Enhanced<br />
Atomization for <strong>Spray</strong> <strong>Drying</strong> <strong>of</strong> Milk. Lebensm.-Wiss. U.-<strong>Technology</strong><br />
1996, 29, 71-81.<br />
35. Nijdam, J.J.; Guo, B.; Fletcher, D.F.; Langrish, T.A.G. Validation <strong>of</strong> the<br />
lagrangian approach for predicting turbulent dispersion and<br />
evaporation <strong>of</strong> droplets within a spray. <strong>Drying</strong> <strong>Technology</strong> 2006,<br />
24(11), 1373-1379.<br />
36. Zbicinski, I.; Piatkowski, M. <strong>Spray</strong> drying tower experiments. <strong>Drying</strong><br />
<strong>Technology</strong> 2004, 22(6), 1325-1349<br />
37. Huang, L.X.; Wang, C.P.; Zhou, R.J.; Mujumdar, A.S. <strong>Spray</strong> droplet<br />
size distribution using a spinning disk atomizer. In Proceedings <strong>of</strong> the<br />
6 th Asia Pacific <strong>Drying</strong> Symposium 2009, pg 589-594.<br />
38. Al-Hakim, K.; Wigley, G.; Stapley, A.G.F. Phase doppler anemometry<br />
studies <strong>of</strong> spray freezing. Chemical Engineering Research and Design<br />
2006, 84(A12),1142-1151.<br />
39. Masters, K. 1979. <strong>Spray</strong> <strong>Drying</strong> Handbook. London: George Godwin<br />
Limited.<br />
Woo, Huang, Mujumdar, Daud – CFD modeling <strong>of</strong> spray dryers 32
40. Huang, L.X.; Kumar, K.; Mujumdar, A.S. Simulation <strong>of</strong> a <strong>Spray</strong> Dryer<br />
Fitted with a Rotary Disk Atomizer Using a Three-Dimensional<br />
Computational Fluid Dynamic Model. <strong>Drying</strong> <strong>Technology</strong> 2004, 22(6),<br />
1489-1515.<br />
41. Langrish, T.A.G.; Keey, R.B.; Hutchinson, C.A. Flow visualization in a<br />
spray dryer fitted with a vane-wheel atomizer: photography and<br />
prediction. Chemical Engineering Research and Design 1992, 70, 385-<br />
394.<br />
42. Adhikari, B.; Howes, T.; Bhandari, B.R.; Truong, V. Effect <strong>of</strong> addition <strong>of</strong><br />
maltodextrin on drying kinetics and stickiness <strong>of</strong> sugar and acid-rich<br />
foods during convective drying: experiments and modelling. Journal <strong>of</strong><br />
food Engineering 2004, 62, 53-68.<br />
43. Handscomb, C.S.; Kraft, M.; Bayly, A.E. A new model for the drying <strong>of</strong><br />
droplets containing suspended solids after shell formation. Chemical<br />
Engineering Science 2009, 64, 228-246.<br />
44. Mezhericher, M.; Levy, A.; Borde, I. Heat and mass transfer <strong>of</strong> single<br />
droplet/wet particle drying. Chemical Engineering Science 2008a,<br />
63(1), 12-23.<br />
45. Chen, X.D.; Lin, S.X.Q. Air <strong>Drying</strong> <strong>of</strong> Milk Droplet under Constant and<br />
Time-Dependent Conditions. AIChe Journal 2005, 51(6), 1790-1799.<br />
46. Langrish, T.A.G.; Kockel, T.K. The assessment <strong>of</strong> a characteristic<br />
drying curve for milk powder for use in computational fluid dynamics<br />
modeling. Chemical Engineering Journal 2001, 84, 69-74.<br />
47. Kieviet, F.G., Van Raaij, J., Kerkh<strong>of</strong>, P.J.A.M. A device for measuring<br />
temperature and humidity in a spray dryer chamber. Chemical<br />
Engineering Research and Design 1997, 75, 329-333.<br />
48. Lo, S. Application <strong>of</strong> computational fluid dynamics to spray drying. Lait<br />
2005, 85, 353-359.<br />
49. Zbicinki, I.; Piatkowski, M.; Prajs, W. Determination <strong>of</strong> spray drying<br />
kinetics in a small scale. <strong>Drying</strong> <strong>Technology</strong> 2005, 23(8), 1751-1759.<br />
50. Woo, M.W.; Daud, W.R.W.; Mujumdar, A.S.; Talib, M.Z.M.; Wu, Z.H.;<br />
Tasirin, S.M. Comparative Study <strong>of</strong> <strong>Drying</strong> Models for CFD<br />
Simulations <strong>of</strong> <strong>Spray</strong> Dryers. Chemical Engineering Research and<br />
Design 2008, 86(9), 1038-1048.<br />
51. Chen, X.D.; Xie, G.Z. Fingerprints <strong>of</strong> the drying behaviour <strong>of</strong> particulate<br />
or thin layer food materials established using a reaction engineering<br />
model. Trans. IChemE 1997, 75(C), 213-222.<br />
52. Chen, X.D. The basics <strong>of</strong> a reaction engineering approach to<br />
modelling air-drying <strong>of</strong> small droplets or thin layer materials. <strong>Drying</strong><br />
<strong>Technology</strong> 2008, 26, 627-639.<br />
53. Brask, A.; Ullum, T.; Thybo, P.; Wahlberg, M. High-temperature<br />
ultrasonic levitatorfor investigating drying kinetics <strong>of</strong> single droplets.<br />
Niro A/S 2007 – ADB Test and Development.<br />
54. Ullum, T. CFD simulation <strong>of</strong> a spray dryer using an empirical drying<br />
model. Proceedings <strong>of</strong> the 16 th International <strong>Drying</strong> Symposium 2008,<br />
pg. 301-308.<br />
55. Mezhericher, M.; Levy, A.; Borde, I. Droplet-droplet interactions in<br />
spray drying using 2D computational fluid dynamics. <strong>Drying</strong><br />
<strong>Technology</strong> 2008, 26(3), 265-282.<br />
Woo, Huang, Mujumdar, Daud – CFD modeling <strong>of</strong> spray dryers 33
56. Adhikari, B.; Howes, T.; Lecomte, D.; Bhandari, B.R. A glass transition<br />
temperature approach for the prediction <strong>of</strong> the surface stickiness <strong>of</strong> a<br />
drying droplet during spray drying. Powder <strong>Technology</strong> 2005, 149,<br />
168-179.<br />
57. Bhandari, B.R.; Datta, N.; Crooks, R.; Howes, T.; Rigby, S. A Semi-<br />
Empirical Approach to Optimise the Quantity <strong>of</strong> <strong>Drying</strong> Aids Required<br />
to <strong>Spray</strong> Dry Sugar-Rich Food. <strong>Drying</strong> <strong>Technology</strong> 1997, 15(10),<br />
2509-2525.<br />
58. Zuo, J.Y.; Paterson, A.H.; Bronlund, J.E.; Chatterjee, R. Using a<br />
particle-gun to measure initiation <strong>of</strong> stickiness <strong>of</strong> dairy powders.<br />
International Dairy Journal 2007, 17, 268-273.<br />
59. Ozmen, L.; Langrish, T.A.G. An Experimental Investigation <strong>of</strong> the Wall<br />
Deposition <strong>of</strong> Milk Powder in a Pilot-Scale <strong>Spray</strong> Dryer. <strong>Drying</strong><br />
<strong>Technology</strong> 2003, 21(7), 1253-1272.<br />
60. Murthi, R.A.; Paterson, A.H.J.; Pearce, D.; Bronlund, J.E. Controlling<br />
SMP stickiness by changing the wall material: feasible or not<br />
Proceedings Of Chemeca 2006, paper 209 (CD-ROM).<br />
61. Woo, M.W.; Daud, W.R.W.; Mujumdar, A.S.; Tasirin, S.M.; Talib,<br />
M.Z.M. The role <strong>of</strong> rheology characteristics in amorphous food<br />
particle-wall collisions in spray drying. Powder <strong>Technology</strong> 2009, 198,<br />
433-443.<br />
62. Palzer, S. The effect <strong>of</strong> glass transition on the desired and undesired<br />
agglomeration <strong>of</strong> amorphous food powders. Chemical Engineering<br />
Science 2005, 60, 3959-3968.<br />
63. Ferry, J.D. 1970. Viscoelastic properties <strong>of</strong> polymers. 2 nd Edition.<br />
New York: John Wiley & Sons.<br />
64. Kieviet, F.G.; Kerkh<strong>of</strong>, P.J.A.M. Measurements <strong>of</strong> particle residence<br />
time distributions in a co-current spray dryer. <strong>Drying</strong> <strong>Technology</strong> 1995,<br />
13, 1241-1248.<br />
65. Kaer, S.K.; Rosendahl, L.A.; Baxter, L.L. Towards a CFD-based<br />
mechanistic deposit formation model for straw-fired boilers. Fuel 2006,<br />
85, 833-848.<br />
66. Kota, K.; Langrish, T.A.G. Prediction <strong>of</strong> wall deposition behaviour in a<br />
pilot- scale dryer using deposition correlations for pipe flows. Journal<br />
<strong>of</strong> Zhejiang <strong>University</strong> SCIENCE A 2007, 8(2), 301-312.<br />
67. Langrish, T.A.G.; Oakley, D.E.; Keey, R.B.; Bahu, R.E.; Hutchinson,<br />
C.A. Time-dependent flow patterns in spray dryers. Chemical<br />
Engineering Research and Design 1993, 71, 355-360.<br />
68. Bayly, A.E.; Jukes, P.; Groombridge, M.; McNally, C. Airflow patterns<br />
in a counter-current spray drying tower – simulation and measurement.<br />
Proceedings <strong>of</strong> the 14 th International <strong>Drying</strong> Symposium, 2004, Sao<br />
Paulo, 22-25 August, vol.B, 775-781.<br />
69. Kota, K.; Langrish, T.A.G. Fluxes and patterns <strong>of</strong> wall deposits for<br />
skim milk in a pilot-scale spray dryer. <strong>Drying</strong> <strong>Technology</strong> 2006, 24(8),<br />
993-1001.<br />
70. Woo, M.W.; Daud, W.R.W.; Talib, M.Z.M.; Tasirin, S.M. Controlling<br />
Food Powder Deposition in <strong>Spray</strong> Dryers at Quasi-Steady Wall<br />
Thermal Condition: Wall Surface Energy Manipulation as an<br />
Alternative. Journal <strong>of</strong> Food Engineering 2009, 94, 192-198.<br />
Woo, Huang, Mujumdar, Daud – CFD modeling <strong>of</strong> spray dryers 34
71. Huang, L.X.; Mujumdar, A.S. Simulation <strong>of</strong> an industrial spray dryer<br />
and prediction <strong>of</strong> <strong>of</strong>f-design performance. <strong>Drying</strong> <strong>Technology</strong> 2007,<br />
25(4), 703-714.<br />
72. Chen, X.D.; Lake, R.; Jebson, S. Study <strong>of</strong> Milk Powder Deposition on a<br />
Large Industrial Dryer. Trans. IChemE 1993, 71(c), 180-186.<br />
73. Mazza, M.G.G.; Brandao, L.E.B.; Wildhagen, G.S. Characterization <strong>of</strong><br />
the residence time distribution in spray dryers. <strong>Drying</strong> <strong>Technology</strong><br />
2003, 21(3), 525-538.<br />
74. Chiou, D.; Langrish, T.A.G.; Braham, R. Partial crystallization<br />
behaviour during spray drying: Simulations and experiments. <strong>Drying</strong><br />
<strong>Technology</strong> 2008, 26(1), 27-38.<br />
75. Anandharamakrishnan, C.; Rielly, C.D.; Stapley, A.G.F. Effect <strong>of</strong><br />
process variable on the denaturation <strong>of</strong> whey proteins during spray<br />
drying. <strong>Drying</strong> <strong>Technology</strong> 2007, 25(5), 799-807.<br />
76. Poh, H.J.; Turangan, C.K.; Lou, J. Improvement <strong>of</strong> an industrial cocurrent<br />
spray cooler operation for a fatty acid product using tangential<br />
side-entry design – A modelling study. Proceedings <strong>of</strong> the 5 th Asia-<br />
Pacific <strong>Drying</strong> Symposium 2007, pg. 215-220.<br />
77. Huang, L.X.; Kumar, K.; Mujumdar, A.S. Use <strong>of</strong> computational fluid<br />
dynamics to evaluate alternative spray dryer chamber configurations.<br />
<strong>Drying</strong> <strong>Technology</strong> 2003, 21(3), 385-412.<br />
78. Huang, L.X.; Mujumdar, A.S. Numerical study <strong>of</strong> two-stage horizontal<br />
spray dryers using computational fluid dynamics. <strong>Drying</strong> <strong>Technology</strong><br />
2006, 24(6), 727-733.<br />
79. Huang, L.X.; Mujumdar, A.S. A computational fluid dynamic study <strong>of</strong> a<br />
low-humidity co-current spray dryer. Asia-Pacific Journal <strong>of</strong> Chemical<br />
Engineering 2007, 2(1), 12-19.<br />
80. Oakley, D.E. Scale-up <strong>of</strong> spray dryers with the aid <strong>of</strong> computational<br />
fluid dynamics. <strong>Drying</strong> <strong>Technology</strong> 1994, 12(1), 217-233.<br />
Woo, Huang, Mujumdar, Daud – CFD modeling <strong>of</strong> spray dryers 35
Woo, Huang, Mujumdar, Daud – CFD modeling <strong>of</strong> spray dryers 36
Passos, M.L., Birchal, V.S. Manipulating physical properties <strong>of</strong> powder - Volume 1, Ed.<br />
Woo, M.W., Mujumdar, A.S. and Daud, W.R.W., 2010, ISBN - 978-981-08-6270-1,<br />
Published in <strong>Singapore</strong>, pp. 37-60.<br />
Manipulating physical properties <strong>of</strong> powder<br />
Passos M.L. 1 , Birchal V.S. 2<br />
1 <strong>Drying</strong> Center - Chemical Engineering Department, Federal <strong>University</strong> <strong>of</strong> Sao Carlos, Brazil<br />
2 Chemical Engineering Department, Federal <strong>University</strong> <strong>of</strong> Minas Gerais, Brazil<br />
Chapter 2<br />
Contents<br />
Page<br />
1.0 Introduction 37<br />
2.0 Powder formation mechanism 38<br />
3.0 Main powder properties 41<br />
3.1 Moisture content 42<br />
3.2 Particle size distribution 43<br />
3.3 Density 46<br />
3.4 Stickiness 49<br />
4.0 Empirical formula to maximize product quality 52<br />
4.1 Experimental design for empirical models 54<br />
4.2 Empirical models for specific cases 56<br />
5.0 Concluding remarks 57<br />
6.0 References 58<br />
1.0 Introduction<br />
<strong>Spray</strong> drying is the most common industrial powder manufacturing<br />
technology. It consists on atomizing a liquid, solution, emulsion or suspension<br />
into a hot gas medium to dry and transform it into particles in a one step<br />
operation. Having been used by the dairy industry since the late 1850s, this<br />
technology attends now different sectors, extending from the food industry to<br />
the agrochemical, biotechnology, heavy and fine chemicals, mining and<br />
metallurgical, dying, pharmaceutical sectors among others. The statistics<br />
indicate that over 25000 spray dryers are commercially in use nowadays, with<br />
their evaporation capacity ranging from few kg/h to over 50 ton/h [1] .<br />
Passos, Birchal – Physical properties <strong>of</strong> powder 37
Since the current market requires from any manufacture sector a high<br />
powder product quality associated to low costs and reduced environment<br />
impacts, efforts to identify powder formation mechanisms are increasing<br />
toward the powder process production optimization. Note that the spray<br />
drying is the unique technique to produce almost spherical and usually hollow<br />
particles with a relatively narrow size distribution. Besides, as a friendly<br />
powder manufacture technique, spray drying allows modifying the processoperation<br />
parameters to manipulate powder properties toward desirable<br />
characteristics with improvement <strong>of</strong> the final product quality.<br />
This chapter presents and analyzes a methodology for describing the<br />
main physical properties <strong>of</strong> spray-dried powders as function <strong>of</strong> the processoperation<br />
parameters in order to manipulate these properties toward<br />
maximizing the powder product quality. To attain this objective, it is necessary<br />
first to identify briefly the main mechanisms to dry and produce a spray-dried<br />
powder. This allows anyone discriminating, not only, the operational variables<br />
that can control the powder characteristics, but also, the main physical<br />
properties that can be manipulated and controlled. In sequence, definitions<br />
and methods to measure these specific physical properties during drying<br />
operation are succinctly reviewed. Based on actual cases, it is shown how to<br />
obtain empirical equations to express the dependence <strong>of</strong> these specific<br />
powder properties on process-operation spray-dryer variables. Finally, a<br />
discussion is presented focussing on the use <strong>of</strong> these empirical equations for<br />
optimizing the spray-dryer operation in relation to the best quality <strong>of</strong> the final<br />
powder.<br />
2.0 Powder formation mechanism<br />
As well known, spray drying is a continuous process-operation, which<br />
comprises several steps, mainly atomizing <strong>of</strong> the liquid feed into droplets,<br />
mixing <strong>of</strong> these droplets with the hot drying gas, evaporating <strong>of</strong> solvent<br />
(commonly water) and separating <strong>of</strong> powder product from exhaust gas.<br />
Specific products, such as instant powdered foods, require two or three<br />
stages <strong>of</strong> drying since particle agglomeration is desirable to improve their<br />
quality. As shown in Figure 1a, in a single-stage drying, composed <strong>of</strong> a spray<br />
dryer with a pneumatic conveying system, the final product is fine nonagglomerated<br />
particles that are difficult to disperse in water. The two-stage<br />
drying process-operation, shown in Figure 1b, uses the spray dryer followed<br />
by a vibr<strong>of</strong>luidized bed dryer system, which not only dries the powder to the<br />
final moisture content generating new agglomerates by particle sliding, but<br />
also, cools gently the product improving the agglomerate stability. In the<br />
three-stage drying, besides the vibr<strong>of</strong>luidized bed system a static fluid bed,<br />
inserted into the conical base <strong>of</strong> the spray dryer, works as a dryeragglomerator<br />
[2] .<br />
Passos, Birchal – Physical properties <strong>of</strong> powder 38
Figure 1a<br />
Single-stage drying for milk powder production<br />
Figure 1b<br />
Two-stage drying for milk powder production<br />
Independently on the number <strong>of</strong> stages used for drying the solution or<br />
suspension, particle formation occurs always in the spray dryer, as soon as<br />
the atomized droplets fall into the chamber in direct contact with the hot gas<br />
(usually air). Figure 2 schematizes the drying history <strong>of</strong> a droplet containing<br />
insoluble or dissolved solids, in a spray dryer [3, 4] . At the beginning <strong>of</strong> the first<br />
drying period, the droplet temperature changes until reaching the wet bulb<br />
temperature, determining by the operation conditions. During this first period,<br />
water (solvent) evaporates as a pure liquid, with the surrounding saturated<br />
vapor film being the only resistance to heat and mass transfer between gas<br />
and droplet. Moreover, the droplet shrinks, decreasing its size and<br />
concentrating solids at its surface due to the inward movement <strong>of</strong> its<br />
boundary. Once the droplet moisture content becomes too low to keep this<br />
saturated condition, dissolved solids from solution start being deposited at the<br />
droplet surface, forming a partial porous crust around the liquid droplet. As<br />
drying proceeds, the droplet transforms into a particle with a wet core<br />
completely surrounded by the porous crust. Note that any change in the spray<br />
Passos, Birchal – Physical properties <strong>of</strong> powder 39
dryer operation conditions to those, under which the droplet shrinks slowly at<br />
a rate that assure a uniform distribution <strong>of</strong> the solid concentration, can lead to<br />
development <strong>of</strong> a full particle without a crust.<br />
Figure 2<br />
<strong>Drying</strong> history <strong>of</strong> a droplet containing solids in a spray dryer<br />
For the case illustrated in Figure 2, the second drying period starts when<br />
the porous crust covering the entire droplet surface. At this point, there is no<br />
more a droplet, but a particle constituted by a wet core and a porous crust.<br />
This period is characterized by thickening the crust towards the interior <strong>of</strong><br />
particle, as well as, by reducing the drying rate, since the porous crust<br />
constricts the vapor mass transfer from the inner core surface to the<br />
surrounding gas. Therefore, the particle temperature increases, supplants the<br />
wet bulb temperature, and tends to reach the thermal equilibrium with the gas.<br />
For cases, in which the gas operation temperature exceeds the solution<br />
boiling temperature, a bubble can be generated inside the particle when its<br />
temperature equals to this boiling point. Under this condition, vapor is<br />
intensively generated inside the particle, raising its internal pressure.<br />
Therefore, the particle inflates, or bursts, or cracks, depending on the<br />
permeability and mechanical characteristics <strong>of</strong> the crust. Consequently, by<br />
varying either the spray dryer operation parameters or the feed solution<br />
properties, many different particle morphologies can be obtained [4 -8] .<br />
In order to evaluate the crust properties, it is important to emphasize<br />
that, in some cases mainly in the food process, the crust composition differs<br />
from the droplet solid composition due to the segregation <strong>of</strong> these<br />
Passos, Birchal – Physical properties <strong>of</strong> powder 40
components during drying. Based on drying kinetics and mass transfer<br />
fundamentals, solids with smallest mass-diffusion coefficients must be<br />
concentrated at the particle surface. This segregation also explains the high<br />
concentration <strong>of</strong> free fat on the whole milk powder crust surface [5] .<br />
Simultaneously to drying and particle formation mechanisms, in many<br />
applications, the powder is subjected to agglomeration, for the purposes <strong>of</strong><br />
improving appearance and/or dispersability. Particle agglomeration can be<br />
enhanced in spray dryer systems for processes, in which it is required, as the<br />
instant powder production. Therefore, primary, secondary and tertiary<br />
agglomerations between droplets and/or particles should be intensified by<br />
respectively:<br />
(a) Using an atomizer device to generate a wider droplet size distribution. This<br />
promotes, at the atomizing zone, effective collisions between smaller and<br />
larger droplets due to their different falling velocity;<br />
(b) Recycling fines (separated from the exhausted gas) to the upper wet<br />
region <strong>of</strong> the drying chamber, where droplets are descended, as shown in<br />
Figures 1b. These fine particles are incorporated into droplets producing<br />
secondary agglomerates. Different agglomerate structures can be<br />
achieved depending on the design and location <strong>of</strong> the fine return system<br />
[9] ;<br />
(c) Inserting a fluid bed into the conical region <strong>of</strong> the spray dryer to improve or<br />
create agglomerates by rolling down wet particles.<br />
This brief description <strong>of</strong> drying and particle formation corroborates the<br />
concept <strong>of</strong> manipulating the spray dryer operation variables to achieve the<br />
desirable powder properties in order to optimize the product quality.<br />
Additionally, it leads to choose the most general powder properties that can<br />
be manipulated and controlled by the spray dryer operation. These properties<br />
can be integrated into four groups, as: (i) moisture content, including the water<br />
activity and sorption isotherms; (ii) particle size distribution incorporating the<br />
mean particle size and dispersion index, as well as, the particle shape and its<br />
superficial area; (iii) density, concerning the solid, particle and in bulk; (iv)<br />
stickiness, including the degree <strong>of</strong> particle cohesion and adhesion. Other<br />
properties, specific <strong>of</strong> the desirable product, should be added to these general<br />
ones to complete the powder quality requirements.<br />
3.0 Main powder properties<br />
The four groups <strong>of</strong> properties identified and analyzed in this chapter are<br />
the basic ones to control powder morphology. Therefore, they need to be<br />
measured and quantify as a function <strong>of</strong> the solution or suspension properties<br />
and <strong>of</strong> the spray drying operational variables (mainly the atomizer device<br />
characteristics, the solution feed flowrate and concentration, the inlet gas<br />
temperature and flowrate). Figure 3 schematizes the cause-effect<br />
relationships influencing powder quality parameters in spray drying.<br />
Passos, Birchal – Physical properties <strong>of</strong> powder 41
SPRAY DRYER DESIGN:<br />
• spray dryer geometry;<br />
• gas and droplet flow contact<br />
(concurrent, countercurrent or<br />
mixing);<br />
• one, two or three stages;<br />
• atomizer device;<br />
• gas mixing; etc.<br />
FEED CHARACTERISTICS:<br />
• composition;<br />
• solids concentration;<br />
• physical properties: density,<br />
viscosity, surface tension, etc.<br />
OPERATION CONDITIONS:<br />
• inlet gas conditions<br />
(temperature; flowrate,<br />
composition);<br />
• solution feed conditions<br />
(temperature, flowrate);<br />
• atomizer parameter<br />
specifications;<br />
time-drying history<br />
droplet-size distribution<br />
particle trajectories<br />
PARTICLE MORPHOLOGY<br />
DENSITY SIZE STICKNESS<br />
SPECIFIC ONES <br />
MOISTURE CONTENT<br />
Figure 3<br />
Cause-effect relationships influencing powder quality<br />
parameters in spray drying. (Modified from [10] ).<br />
3.1 Moisture content<br />
The residual moisture content <strong>of</strong> spray dried powder is <strong>of</strong> great important<br />
to define the product quality, since this quantifies the amount <strong>of</strong> water<br />
presented in the material. This parameter is straightly related to drying<br />
conditions and to droplet formation mechanisms. Consequently, it must vary<br />
with changes in the spray dryer operation variables (mainly the inlet air<br />
temperature), as well as, the solution or suspension feed composition and<br />
concentration. Depending on the methods used for measuring the moisture<br />
content, the different forms <strong>of</strong> water, available in the powder, can be<br />
identified, such as water weakly bounded (free or retained water), water<br />
strongly bound (hydrate water), water with weaker bonds and water imbibed<br />
in proteins. The drying oven method at a controlled temperature until constant<br />
mass <strong>of</strong> the sample is the most widely method used. Generally for food or<br />
pharmaceutical powders, this method is normalized concerning the drying<br />
temperature, sample exposure and oven type [11] . Moreover, for these<br />
powders, both, the residual moisture content and the water activity, are<br />
required in order to develop a procedure to control adequately the product<br />
shelf life, taste and texture, agglomeration, contaminant growth and microbial<br />
proliferation [12] . Water activity, expressed by the air relative humidity in<br />
Passos, Birchal – Physical properties <strong>of</strong> powder 42
equilibrium with the powder at ambient conditions or at specified conditions,<br />
can be measured by a faster reading electrical or electronic hygrometer.<br />
Water sorption isotherms (equilibrium curves between the moisture<br />
content and the water activity <strong>of</strong> a powder at different temperatures) provide a<br />
more complete moisture analysis. These curves are complex but unique for<br />
each material due to different interactions (colligative, capillary, and surface<br />
interactions) between water and solid components at different moisture<br />
contents. Measurements <strong>of</strong> these sorption curves can be divided into static<br />
and dynamic procedures. The further consists on placing a powder sample,<br />
dried (adsorption), hydrated (desorption) or raw (working), into controlled air<br />
humidity chambers at constant temperature and measuring the sample mass<br />
sequentially until establishing the equilibrium (constant mass). Although the<br />
dynamic procedure seems similar to the static one regarding the sample mass<br />
measurements, rather than using a confined controlled atmosphere, air at<br />
constant and controlled temperature and humidity flows continuously over the<br />
powder sample, enhancing the time to reach the equilibrium. Based on this<br />
dynamic procedure, complete equipment is commercially available for faster<br />
measuring water sorption isotherms <strong>of</strong> common materials [13] . Moisture<br />
sorption isotherms are the required data for modeling the droplet drying and<br />
powder formation in any one type <strong>of</strong> spray dryers.<br />
3.2 Particle size distribution<br />
Particle size distribution supplies information not only the mean size, but<br />
also, the size dispersion, the particle agglomeration and, depending on the<br />
method used for measurement, the particle shape and its superficial area.<br />
<strong>Spray</strong>-dried powder size and distribution are straightly related to the droplet<br />
size and distribution and, consequentially, depend mainly on the atomizer<br />
device and suspension feed properties [1][10][14] . Pneumatic atomizers can<br />
produce very small uniform size droplets, even with very viscous suspensions;<br />
pressure nozzles generate droplets whose sizes depend on the nozzle<br />
pressure, but with a narrow size range. Rotary atomizers are very versatile<br />
with the droplet size being controlled either by wheel revolutions or by the<br />
feed rates. Although in development, sonic atomizers, in which the ultrasonic<br />
energy is used by passing the liquid over a surface vibrated at ultrasonic<br />
frequencies, can produce very fine droplets at low flowrates. To obtain the<br />
desired powder size, the atomizer selection must be made carefully<br />
considering, as a general rule, that an increase in the energy available for<br />
atomization (i.e. air-liquid ratio in a pneumatic atomizer, nozzle pressure, or<br />
rotary atomizer speed) reduce the particle size [1][15][16] .<br />
To determine the mean particle diameter, the powder size distribution<br />
curve must be obtained experimentally. This curve represents the frequency<br />
or cumulative frequency (expressed as fraction or percentage) <strong>of</strong> occurrence<br />
<strong>of</strong> each particle size in the powder sample, as exemplified in Figure 4 [17] . As<br />
shown by the fitted curve in this figure, the lognormal distribution is the most<br />
common model for characterizing the particle size distribution <strong>of</strong> uniform<br />
Passos, Birchal – Physical properties <strong>of</strong> powder 43
spray-dried powders. This lognormal distribution curve leads to define the<br />
dispersion index <strong>of</strong> particle size distribution, i d , as [18, 19] :<br />
i d<br />
D<br />
84,1% 15,9%<br />
= (1)<br />
2D<br />
− D<br />
50%<br />
with D x% representing the size that corresponds to the X% (or 0.X) value on<br />
the curve <strong>of</strong> cumulative percentage undersize versus size (see Figure 3.4 for<br />
determination <strong>of</strong> D 50% ).<br />
cumulative undersize (-)<br />
1.0<br />
0.8<br />
0.6<br />
0.4<br />
0.2<br />
1 mo storage<br />
LN-1 mo storage<br />
6 mo storage<br />
D 50%<br />
0.0<br />
0.00 0.10 0.20 0.30 0.40 0.50<br />
particle volumetric diameter (mm)<br />
Figure 4<br />
Size distribution curve for goat milk powder as a function <strong>of</strong> the<br />
storage time. Data obtained using the laser diffraction method.<br />
(LN – lognormal distribution curve). (Modified from [17] )<br />
Depending on the method selected for measurement, different types <strong>of</strong><br />
particle size distribution curve can be obtained (i.e. by number, by surface, or<br />
by mass or volume), and, consequently, several mean particle diameters can<br />
also be defined and determined. Although there are many methods for<br />
measuring particle size distribution (see, for example, reference [18] ), those<br />
ones most useful in the powder measurements comprise two classes, the<br />
sieve analysis and the laser diffraction. Both performed in a dry or wet<br />
medium lead to the particle size distribution by mass (sieving) or volume<br />
(laser diffraction). The sieve analysis (standardized by ASTM D6913) consists<br />
<strong>of</strong> a simple shaking <strong>of</strong> the powder sample in sieves until the mass retained in<br />
each sieve becomes quasi-constant. This method is the most widely used<br />
method for larger particles (generally, from 37 µm to 4000 µm) and requires a<br />
relatively long time for measurement (5 to 30 min), as well as, a special<br />
procedure for cohesive and agglomerated powder [20, 21] . In the second class<br />
method, the diffracted light is produced when a laser beam passes through a<br />
dispersion <strong>of</strong> particles in a gas or in a liquid, thus, measuring the scattered<br />
Passos, Birchal – Physical properties <strong>of</strong> powder 44
energy versus the diffraction angle allows generating the volume size<br />
distribution curve <strong>of</strong> the powder sample [18] . This laser diffraction method<br />
(standardized by ASTM B822) is the fastest (10 s) and most precise method<br />
<strong>of</strong> analysis, is non-destructive and non-intrusive and actually used by<br />
industries. This method is applied to the particle size range from 0.1 µm to<br />
2000 µm and particularly precise for measuring sizes below 1 µm, since the<br />
light diffraction angle increases as particle size decreases.<br />
Returning to Figure 4, one can see that particle size distribution data<br />
concerning goat milk powder with 6 months <strong>of</strong> storage must not be well fitted<br />
to the lognormal distribution model, either other distribution model developed<br />
for homogeneous powders. The 6-month storage milk powder has an unusual<br />
size distribution with two peaks in the curve. This bimodal (or even multimodal)<br />
size distribution usually results from two different phenomena that<br />
occur simultaneously or subsequently during powder formation. In the case <strong>of</strong><br />
Figure 4, after 6 months <strong>of</strong> storage, the lactose crystallization seems to be<br />
occurred subsequently the drying and powder formation, since the goat milk<br />
powder sample has not been hermetically storage [17] .<br />
Although there are several ways to define the mean particle size that<br />
characterizes the whole powder distribution, the so-called Sauter mean<br />
diameter is one <strong>of</strong> the most useful mean values [18-20] . This corresponds to the<br />
particle diameter with the same volume-to-surface ratio as the entire powder,<br />
i.e.:<br />
∑<br />
∑<br />
−1<br />
3<br />
Di<br />
fi<br />
⎛ xi<br />
⎞<br />
D<br />
3,2<br />
= =<br />
2<br />
⎜∑<br />
⎟<br />
(2)<br />
Di<br />
fi<br />
⎝ Di<br />
⎠<br />
with f i representing to the number frequency <strong>of</strong> D i particle size, and x i the<br />
volume or weight fraction <strong>of</strong> D i particle.<br />
As discussed earlier, basically, the water evaporation rate and the<br />
suspension composition should affect mainly the particle shape and<br />
morphology. The parameter mostly used to quantify the particle shape is the<br />
sphericity factor, which is the ratio <strong>of</strong> the surface area <strong>of</strong> equivalent volume<br />
sphere to the surface area <strong>of</strong> the particle [19] . Only image analysis provides<br />
true powder shape information, being, nowadays, scanning electron<br />
microscope (SEM) and transmission electron microscope (TEM) the most<br />
used methods to qualify powder particle shape or particle shape distribution in<br />
powders. However, when the determination <strong>of</strong> the powder surface area is <strong>of</strong><br />
interest, SEM and TEM supply only a qualitative picture based on<br />
measurements <strong>of</strong> average pore and ligament sizes and on the assumption <strong>of</strong><br />
a structural isotropy <strong>of</strong> the substrate <strong>of</strong> interest. Brunauer Emmett Teller<br />
(BET) method represents the best quantitative alternative to measure the<br />
particle surface area, since it is based on the physical monolayer adsorption<br />
<strong>of</strong> gas molecules (nitrogen or krypton) on the particle surface. The BET<br />
methodology is well described in the standard DIN 66131 and applicable to<br />
nonporous solids or macro and mesoporous solids with pore widths higher<br />
than 2 nm. In addition, BET also features some limitations and shortcomings<br />
related to its efficiency for powder characterization, associated manly with<br />
pre-treatment procedures at elevated temperature and large quantity <strong>of</strong> the<br />
analyzed samples [20] . Another alternative method is based on the gas<br />
Passos, Birchal – Physical properties <strong>of</strong> powder 45
permeability, as the ESA (envelope surface area analyzer) available<br />
commercially that uses compressed air.<br />
3.3 Density<br />
Powder density (ρ) is one <strong>of</strong> its basic properties, defined as the ratio <strong>of</strong> mass<br />
to volume. It has economical, commercial and functional importance. A high<br />
density implies in a low volume, which favors the material transportation,<br />
handling and storage, on the other hand, a low density can sometimes be<br />
required either by operational conditions or by product quality criteria [19,22] .<br />
Since a powder is formed by individual particles, which can exhibit internal<br />
pores and/or can agglomerate to form greater particles, there are several<br />
ways to specify its density. To avoid misunderstanding concerning these<br />
definitions, the terminology adopted is followed, as well as, illustrated in<br />
Figure 5 [23] :<br />
(a) grain – meaning individual or primary particles (not linked);<br />
(b) agglomerate – referring to greater particles formed by linking one or<br />
more grains;<br />
(c) particle – referring indistinctly to an agglomerate or to a free grain;<br />
(d) internal pores or intraparticle porosity – meaning pores inside the grain<br />
or among grains, when they form agglomerates;<br />
(e) external pores or interparticle porosity – corresponding to the empty<br />
space (not filled by particles and not included internal pores) in a<br />
defined volume.<br />
Using this terminology, different powder densities can be identified, mainly the<br />
solid density, the particle density and the bulk density.<br />
Solid density<br />
The true or real solid density, ρ s , represents the mass <strong>of</strong> solid content in the<br />
particle, m s , divided by the volume actually occupied by this solid (excluding<br />
internal pores), V s , i.e.:<br />
m<br />
s<br />
ρ<br />
s<br />
=<br />
(3)<br />
Vs<br />
Helium pycnometry is one method used to determine ρ s , since helium can<br />
even penetrate the smallest pores or voids, measuring the unknown volume<br />
<strong>of</strong> a known powder mass. The final result is <strong>of</strong>ten referred to as skeletal<br />
density. The ρ s value depends straightly on the powder solid composition and,<br />
when the chemical composition <strong>of</strong> powder is evaluated, the following<br />
correlation can used to estimate ρ s [24] :<br />
−1<br />
⎛ ⎞<br />
= ⎜∑ n xi<br />
ρ ⎟<br />
s<br />
(4)<br />
⎝ i=<br />
1 ρi<br />
⎠<br />
Passos, Birchal – Physical properties <strong>of</strong> powder 46
In this Equation (4), ρ i represents the density <strong>of</strong> the i-solid component and x i<br />
its mass concentration in dry-basis (mass <strong>of</strong> i-component/dry mass <strong>of</strong> total<br />
solids). Once changes in the powder composition must occur in order to<br />
change ρ s value, meaning that ρ s is unique for each powder product.<br />
internal pore<br />
(inside the grain)<br />
Agglomerate<br />
(particle)<br />
external<br />
pore<br />
(a)<br />
grain<br />
(particle)<br />
internal pore<br />
(among the<br />
grain)<br />
(b)<br />
internal pores<br />
(inside the<br />
grain)<br />
(c)<br />
Figure 3.5<br />
SEM micrographs <strong>of</strong> whole powder milk obtained in a spray<br />
dryer. (Modified from Birchal [23] )<br />
Particle density<br />
The particle density, ρ p, represents the ratio <strong>of</strong> the mass <strong>of</strong> solids present in<br />
the particle, m s to its actual volume, V p , including all internal pores, as:<br />
ρ<br />
p<br />
m<br />
V<br />
s<br />
ip<br />
s<br />
( − γ ) = ( − γ ) ρ<br />
s<br />
s<br />
s<br />
= = =<br />
1<br />
p<br />
m<br />
V + V<br />
m<br />
1 (5)<br />
V<br />
s<br />
with V ip corresponding to the internal pore volume <strong>of</strong> the particle (grain or<br />
agglomerate) and being the volumetric concentration <strong>of</strong> these internal particle<br />
pores (γ = V ip /V p ).<br />
Passos, Birchal – Physical properties <strong>of</strong> powder 47
Therefore, the ρ p determination demands measurements <strong>of</strong> γ, the volumetric<br />
concentration <strong>of</strong> the internal pores. Mercury porosimetry is one <strong>of</strong> applied<br />
methods for this, because it uses the non-wetting properties <strong>of</strong> mercury to<br />
gain information on the porous characteristics <strong>of</strong> powder (i.e. porosity, pore<br />
volume, pore size distribution and density). During a typical analysis in a<br />
mercury porosimetry analyzer, a higher pressure is necessary to force<br />
intrusion <strong>of</strong> mercury in smaller pores, whereas mercury is intruded into larger<br />
pores at low pressures. In this way a wide dynamic range <strong>of</strong> pore sizes can be<br />
measured and a pore size distribution can be obtained starting from 4 nm<br />
(pressure = 400 MPa) up to approximately 800 µm (vacuum). However, a lowpressure<br />
mercury porosimeter (pressure range from 0.01 to 140 kPa) seems<br />
to be suitable to spray-drier powder measurements (particle size range from<br />
330 to 15 µm), as shown by Drusch and Schwarz [25] . Another alternative<br />
method to evaluate γ is the BET analysis using now the volumetric technique<br />
that provides a full adsorption-desorption isotherm with information on BET<br />
surface area, pore volume and pore size distribution. Although Hahne [20] has<br />
chosen this method to determine, her results showed the difficulty to apply<br />
this method to the whole milk powder, once there was a great tend to destroy<br />
or alter milk agglomerates during the sample preparation. Moreover, this<br />
author demonstrated that the volume <strong>of</strong> internal pores in an individual or<br />
primary milk particle is insignificant, comparing to the one <strong>of</strong> internal pores<br />
among grains in milk agglomerate. Even though tedious and time-consuming<br />
procedure, the γ value can also be determined basing on statistical analyses<br />
<strong>of</strong> particle images or micrographs, obtained by microscopy.<br />
Bulk density<br />
The bulk or apparent density, ρ b , refers to the particle packing (particle<br />
arrangement) into a vessel to form a bed, and represents the mass <strong>of</strong><br />
particles contained in a vessel, m s , divided by the bed volume formed by this<br />
mass, V bed , i.e.:<br />
ρ<br />
m<br />
m<br />
1 (6)<br />
s<br />
( − ε ) = ( 1 − ε ) ρ p<br />
= ( 1 − ε )( − γ ) ρ s<br />
s<br />
b<br />
= =<br />
1<br />
Vbed<br />
Vp<br />
in which ε is the bed porosity (or void fraction), defined as the total volume <strong>of</strong><br />
pores formed among particles divide by the total bed volume. Once the values<br />
<strong>of</strong> ρ b and ρ p are determined, the bed porosity can be found:<br />
⎛ ⎞<br />
⎜<br />
ρb<br />
ε = 1 − ⎟<br />
(7)<br />
⎝ ρ<br />
p ⎠<br />
There are two important conditions, under which ρ b must be identified<br />
and specified. The first one, corresponding to the determination <strong>of</strong> the loose<br />
bulk density, ρ b-min , represents a loose packed bed condition. The second<br />
condition, relating to the determination <strong>of</strong> the tapped bulk density, ρ b-max ,<br />
represents the maximum packing density <strong>of</strong> a powder achieved under the<br />
influence <strong>of</strong> well-defined, externally applied forces. The bed porosity, at this<br />
second condition, achieves its minimum reproductive value.<br />
The ρ b-min value can be measured by pouring, slowly and gradually, a<br />
known mass <strong>of</strong> powder into a graduated vessel. The ratio <strong>of</strong> the mass to the<br />
Passos, Birchal – Physical properties <strong>of</strong> powder 48
volume occupied may correspond to ρ b-min , if the vessel is larger enough to<br />
avoid the wall effect on the particle packing. Better procedure is pouring the<br />
powder through a vibrating sieve and allowing it to fall a fixed height (about 25<br />
cm) into a graduated cylindrical vessel [19] . Although measuring <strong>of</strong> this density<br />
is far from standardized, another alternative procedure is to inject<br />
homogeneously a gas (basically air) through the packed bed <strong>of</strong> particles until<br />
fluidization and, then, shoot down the gas flow and, immediately, measure the<br />
loose bed volume [20] .<br />
Despite the fact that many industries measure ρ b-max by tapping the<br />
powder sample manually (dropping continuously the graduated vessel<br />
containing powder a specific height until no noticeable change in the bed<br />
volume [20] ), the best procedure is to use a mechanical tapping device. With<br />
this device, the conditions <strong>of</strong> sample preparation are more reproducible.<br />
Instruments to achieve such reproducibility are available commercially with<br />
their tap density tests normalized by the American Society for Testing and<br />
Materials Standards (ASTM), International Organization for Standardization<br />
(ISO), International Dairy Federation (IDF), United States Pharmacopoeia<br />
(USP). These tests generate standardized and repeatable results <strong>of</strong><br />
measuring tapped and even packed volumes <strong>of</strong> different powders.<br />
3.4 Stickiness<br />
<strong>Spray</strong>-dried powders can be hygroscopic that, under humid conditions,<br />
clump together becoming sticky and, consequently, no free flowing powders.<br />
Such powders require special attention during packaging and storage, as<br />
many food powders [10][20-23][26-27] , and, sometimes, during spray drying<br />
operation because they not only stick to each other but, mainly, adhere to the<br />
equipment walls decreasing the drying efficiency and powder production.<br />
Typical examples are milk powders [21][27] , sugar-rich powders as fruit-juice<br />
ones [10][26] among others.<br />
To avoid the powder adherence to the walls, two different approaches<br />
have been used industrially. The first is to interfere in the suspension or<br />
emulsion composition, adding to it carrier agents (polymers and gums) that<br />
reduce the powder hygroscopicity and also protect the sensitive food<br />
components [26] . Another approach is to inject cool gas (generally air) into the<br />
dryer or to cool the walls <strong>of</strong> the spray dryer chamber for reaching walltemperatures<br />
below the sticky-point temperature <strong>of</strong> the semi-dry product [28-30] .<br />
For processing, storage and packaging, the final powder stickiness needs to<br />
be measured and well controlled.<br />
Flow <strong>of</strong> powders is governed mainly by physical properties rather than by<br />
chemical ones, and it depends on the size, shape and size distribution <strong>of</strong><br />
particles, as well as moisture content and time-consolidation. Cohesive and<br />
adhesion forces include mechanical forces arising from interlocking surface<br />
asperities and irregularities, solid bridges formed from re-crystallization,<br />
capillary forces in an adsorbed liquid layer, molecular forces as Van der<br />
Waals and electrostatic forces [31] . Although several indexes exist in the<br />
literature to quantify the powder flowability (as Jenike flow index, Hausner<br />
ratio, repose and slide angles, among others), there is no single flow tester<br />
Passos, Birchal – Physical properties <strong>of</strong> powder 49
that can be universally accepted as reliable and easy-to-use for determining<br />
this property. Therefore, two or more indexes must be measured, compared<br />
and analyzed in order to define the degree <strong>of</strong> powder stickiness.<br />
Jenike flow index<br />
Jenike shear tests, industrially used as standards for measuring powder<br />
flowability (ASTM Standard D6128-97), involve two basic steps: pre-shear<br />
and shear. After loading the powder sample into the shear cell, the pre-shear<br />
starts consisting in consolidating the sample at a specific normal stress<br />
(dependent on the initial powder bulk density) and, then, shearing it at the<br />
same normal stress. Subsequently, the shear step (also called shear to failure<br />
step) initiates with a reduction in the normal stress to a fraction <strong>of</strong> the preshear<br />
stress and, then, shearing starts. To determine the yield locus <strong>of</strong> the<br />
powder, several <strong>of</strong> these described tests must be performed, in which each<br />
sample must be first consolidated at identical normal stress (pre-shear) and<br />
then sheared (to failure) under different normal stresses. By pre-shearing at<br />
identical normal stress, each sample reaches the same state <strong>of</strong> consolidation.<br />
Therefore, each test yields the same pre-shear point, and one individual shear<br />
point in accordance with the different normal stresses applied at shear. Figure<br />
6 shows a typical diagram obtained from these tests, as well as the definition<br />
<strong>of</strong> Jenike flow-index. This index decreases with increasing powder cohesion,<br />
and when it is lower than 1 the powder flowability tends to zero (not flowing).<br />
Although this technique has proven to be reproducible and valid for different<br />
powders, shear test results are complicated to be interpreted and to be<br />
validated, requiring technical knowledge in soil mechanics [31-33] . In addition to<br />
time-consuming, these shear tests are difficult to operate and expensive for<br />
high-value powder [31, 33] . Therefore, this technique tends to be replaced by a<br />
simple one.<br />
Figure 6<br />
Schematic representation <strong>of</strong> a cohesive powder yield locus<br />
curve obtained in direct shear tests and the Jenike flow index,<br />
ff c .<br />
Passos, Birchal – Physical properties <strong>of</strong> powder 50
Hausner ratio<br />
The Hausner ratio, H R , defined as H R = ρ b-max / ρ b-min , expresses the<br />
cohesion degree <strong>of</strong> powders. As discussed by Geldart [19] , when powder with<br />
strong interparticle forces is poured into a vessel, an open powder structure is<br />
formed that prevents particles from rolling over each other. Conversely, this<br />
open structure can easily be disrupted by mechanical vibration, resulting in a<br />
closer matrix. This explains higher H R values for cohesive powders (lower<br />
ρ b-min and higher ρ b-max ). Hayes [34] has proposed the following classification for<br />
evaluating the powder flowability using this H R ratio: 1.0 < H R < 1.1 - free<br />
flowing powders; 1.1 < H R < 1.25 - medium flowing powders; 1.25 < H R < 1.4 -<br />
difficult flowing powders; H R < 1.4 - very difficult flowing powders. As this<br />
parameter is directly related to bulk densities, it can be easily obtained,<br />
however caution is needed for evaluating the results obtained because H R<br />
values may be sensitive to the procedure and/or the apparatus used [31][35] .<br />
Angle <strong>of</strong> repose and angle <strong>of</strong> slide<br />
Another simple measurement <strong>of</strong> powder flowability is the static angle <strong>of</strong><br />
repose, α R , which represents the angle formed between the side <strong>of</strong> a<br />
stationary pile <strong>of</strong> powder and the horizontal. This pile must be made by a<br />
standard procedure, in which a fixed mass <strong>of</strong> powder is poured through a<br />
conical funnel mounted with its stem 6 cm from the horizontal surface [31] . This<br />
parameter may present poor reproducibility because it depends on the<br />
powder sample history; nevertheless it is one recommended as a quantitative<br />
measure <strong>of</strong> cohesiveness <strong>of</strong> any granular material (ISO Standard 3435-1977-<br />
E). Note that the greater is the angle <strong>of</strong> repose the more cohesive is the<br />
powder. The following scale can be used for quantify the powder flowability:<br />
α R < 35° - free flowing powders; 35° ≤ α R < 45° - medium flowing powders;<br />
45° ≤ α R ≤ 55° - difficult flowing powders (cohesiveness); α R > 55° very<br />
difficult flowing powders (tending to zero flow). The slide angle is measured by<br />
placing the powder sample on a fat smooth horizontal plate, which is inclined<br />
slowly until the powder starts moving. The angle at which the movement<br />
occurs is the slip or slide angle [17] . Other most useful parameter to quantify<br />
the powder stickiness is the glass transition temperature.<br />
It is important to emphasize that other specific properties should be<br />
added to these four powder property groups to describe entirely the product<br />
quality. Tonon et al. [26] have introduced to the first two groups <strong>of</strong> properties,<br />
described in items 3.1 and 3.2, more one parameter that quantifies the<br />
anthocyanin retention in the powder product in order to analyze the<br />
antioxidant activity <strong>of</strong> this açai powder. Drusch and Schwarz [25] have used<br />
parameters <strong>of</strong> the first three groups <strong>of</strong> properties, described in items 3.1, 3.2<br />
and 3.3, adding more two other specific parameters, the final powder content<br />
<strong>of</strong> non-encapsulated fat and the lipid oxidation rate. These parameters<br />
together supply information for selecting the best starch in the formulation <strong>of</strong><br />
the wall material for microencapsulation <strong>of</strong> a fish oil rich in long-chain<br />
polyunsaturated fatty acids. Ståhl et al. [36] have set into the first two groups <strong>of</strong><br />
properties, described in items 3.1 and 3.2, the amount <strong>of</strong> insulin degradation<br />
to analyze the spray-dried insulin powder quality to be used for inhalation as<br />
function <strong>of</strong> the drying operation conditions. Healy et al. [37] , worked in the<br />
similar theme, have applied the particle engineering technique to produce the<br />
spray-dried nanoporous microparticles with the desirable product quality to<br />
attend processes <strong>of</strong> drug delivery to the respiratory human tract by oral<br />
Passos, Birchal – Physical properties <strong>of</strong> powder 51
inhalation. For that, product quality parameters have been defined following<br />
particles properties presented in items 3.2 and 3.3, complemented by the<br />
identification and quantification <strong>of</strong> the powder structural forms (from<br />
amorphous to crystalline structure).<br />
4.0 Empirical model to maximize product quality<br />
A strategy to manipulate the spray-dryer operation variables in order to<br />
obtain the desirable powder product with the best quality is presented in<br />
Figure 7. The first step is to define precisely the quality for the desirable<br />
product. For example, if the desirable product is whole milk powder for selling<br />
in the market, then, the product quality must be focussed in powder<br />
instantizing (i.e. a quick powder reconstitution in water). Associated to the<br />
physical-chemical characteristics <strong>of</strong> milk powder agglomerates, this<br />
reconstitution phenomenon involves four basic mechanisms [38] :<br />
• Immersibility, corresponding to the powder ability to break up water<br />
surface tension and submerge into the liquid;<br />
• Wettability, meaning the susceptibility to the water penetration;<br />
• Dispersibility, meaning the powder ability to disperse and mix in water,<br />
forming a homogeneous emulsion;<br />
• Solubility, representing the ability to maintain, once it is formed, a stable<br />
emulsion in water.<br />
The second step, after defining precisely the product quality, is to<br />
quantify this powder quality. Thus, it is necessary to select those powder<br />
properties that can describe this quality. Considering the example already<br />
presented, the four mechanisms, which characterize the milk instantizing, are<br />
closely related to the bulk density, the residual moisture, protein and fat<br />
contents, the powder size distribution and powder stickiness [23][38] .<br />
As shown in Figure 7, in the third step, values <strong>of</strong> the powder properties,<br />
which assure the best product quality, must be specified, as well as any<br />
operational restriction or limitation for these properties. Returning to the given<br />
example and considering the two-stage drying <strong>of</strong> milk emulsion, it is<br />
recommended that powder, which leaves the spray chamber, should present<br />
the following characteristics [23][38] :<br />
• moisture content varying from 5.3 to 6.4% (dry base) for whole milk<br />
powder and from 6.4 to 7.5% for skim milk powder;<br />
• tapped bulk density, ρ b-max , varying from 450 to 550 kg/m 3 ;<br />
• wide powder size distribution with particle diameter varying from 40 to 600<br />
mm;<br />
• cohesion between particles being high enough to build and rearrange<br />
agglomerates at the desirable narrow particle size distribution in the<br />
vibr<strong>of</strong>luidized bed system and low enough to minimize deposition <strong>of</strong><br />
particles on dryer walls. According to Hahne [20] , the recommended value<br />
<strong>of</strong> H R is about 1.4 for processing whole milk powder in vibr<strong>of</strong>luidized beds<br />
(sufficient condition to fluidize whole milk agglomerates).<br />
Passos, Birchal – Physical properties <strong>of</strong> powder 52
1. Definition:<br />
powder<br />
quality<br />
2. Selection:<br />
powder<br />
properties<br />
(to quantify the defined<br />
powder quality)<br />
3. Specification:<br />
• desirable values<br />
for powder<br />
properties<br />
• limitations and<br />
restrictions<br />
(to reach best quality)<br />
6. Development:<br />
objective function<br />
for optimization<br />
(integrating into one<br />
equation the powder<br />
production efficiency and<br />
powder quality parameters)<br />
5. Incorporation:<br />
empirical models<br />
into spray dryer<br />
integrated s<strong>of</strong>tware<br />
(integrated s<strong>of</strong>tware with<br />
fluid-solid-flow models linked<br />
to drying model)<br />
4. Development:<br />
empirical models<br />
for describing<br />
powder properties<br />
(as function <strong>of</strong> dryer<br />
operation variables)<br />
7. Selection:<br />
optimization<br />
numerical technique<br />
for maximizing the<br />
objective function<br />
(deterministic or heuristic<br />
methods )<br />
8. Incorporation:<br />
optimization<br />
algorithm into spray<br />
dryer integrated<br />
s<strong>of</strong>tware<br />
(search for operation<br />
conditions that maximize the<br />
objective function)<br />
9. Final Result:<br />
optimal operational<br />
condition for drying<br />
and producing the<br />
highest quality<br />
powder in the spray<br />
dryer<br />
Figure 7<br />
Schematic steps for optimizing the operation variables <strong>of</strong> the<br />
spray dryer concerning the drying-production efficiency and the<br />
product quality.<br />
Since the powder property variation is directly dictated by the spray dryer<br />
operation conditions, the powder quality should be quantified by the<br />
relationship between the operational process variables that best describe<br />
these properties. Therefore, in the fourth step presented in Figure 7, empirical<br />
models are developed to express these powder properties as a function <strong>of</strong> the<br />
spray dryer operational variables. The procedure to develop these empirical<br />
models is discussed in the next sub-item 4.1.<br />
These empirical models can be incorporated into a computational<br />
program, or even into CFD commercial s<strong>of</strong>tware, developed to simulate<br />
simultaneously drying and powder formation in spray dryers. This<br />
incorporation represents the fourth step in the diagram in Figure 7. By defining<br />
the objective function (fifth step in Figure 7), combining the powder production<br />
efficiency and the powder product quality in such a way that they can be<br />
maximized simultaneously, the optimization <strong>of</strong> the spray-dryer operation<br />
should be performed, following the sixth, seventh and eighth steps shown in<br />
Figure 7.<br />
Passos, Birchal – Physical properties <strong>of</strong> powder 53
4.1 Experimental design for empirical model<br />
Concerning Figures 3 and 7, it is known that many other powder<br />
properties can be selected to best describe the product quality, depending on<br />
the required product. Due to this multiplicity <strong>of</strong> choices and to the complexity<br />
<strong>of</strong> the powder product, models for describing powder properties as a function<br />
<strong>of</strong> the spray dryer operational variables are invariably empirical. Therefore,<br />
experiments must be performed to correlate these properties with the<br />
operational variables, maximizing their levels and, consequently, increasing<br />
the product quality. This item presents briefly the most useful techniques to<br />
design these experiments in order to develop more accurate empirical<br />
models.<br />
The powder properties, chosen to quantify the product quality, are, in this<br />
context, denominated response variables or dependent variables. The<br />
operational variables that should influence powder properties, called predictor<br />
variables or independent variables, are probably:<br />
• temperature, feed rate and humidity <strong>of</strong> the inlet drying gas;<br />
• concentration, feed rate and temperature <strong>of</strong> the feed emulsion or<br />
solution;<br />
• type, pressure or rotation <strong>of</strong> atomizer (according to the type);<br />
• type <strong>of</strong> air-fluid contact (concurrently, counter-currently and combined<br />
flow);<br />
• pressure inside the spray dryer chamber.<br />
After selecting the predictor variables, it is necessary to define the<br />
interesting range <strong>of</strong> study, i.e. how these variables should vary in the<br />
experiments, which are called levels. As shown in Figure 7 and discussed by<br />
Birchal et al. [38] , the methodology to establish the relation <strong>of</strong> all these<br />
variables involves:<br />
(1) identification and characterizations <strong>of</strong> the powder parameters that assure<br />
its high quality (response variables);<br />
(2) selection <strong>of</strong> the spray-dryer operational parameters that most influence<br />
quality (predictor variables);<br />
(3) design and development <strong>of</strong> experiments, choosing the most suitable<br />
technique; and<br />
(4) statistical analysis <strong>of</strong> results and correlations, leading to the best range for<br />
operating the spray dryer to produce powder at higher quality..<br />
The most recommended method <strong>of</strong> planning experiments is called<br />
Factorial Design, where predictor variables are also called factors <strong>of</strong> the<br />
experiments. The basic idea is to performance a set <strong>of</strong> experiments<br />
considering all possible variations <strong>of</strong> the factors, using a minimum number <strong>of</strong><br />
them [39] . The advantages <strong>of</strong> using this method are: it is a simultaneous<br />
method; the variables <strong>of</strong> interest that, in fact, present significant influence on<br />
the response are evaluated as well as the interaction among them; and, it is<br />
more efficient than using a design that varies one factor at each time.<br />
In factorial design, frequently it is used the 2 k factorial type (k factors at 2<br />
levels), resulting in 2 k number <strong>of</strong> experiments. This scheme is particularly<br />
Passos, Birchal – Physical properties <strong>of</strong> powder 54
useful at the beginning <strong>of</strong> study, when there are a large number <strong>of</strong> variables to<br />
be investigated [39] . The main tendencies can be observed and the variables<br />
and interactions that really influence the phenomena can be better explored in<br />
as many levels as necessary. The selected levels is codified as low (-) and<br />
high (+) ones. All the analyses assume that: the designs are completely<br />
randomized and the normality assumptions are satisfied. As there are only<br />
two levels, it is assumed that the response is approximately linear in the range<br />
<strong>of</strong> study. If only two factors (A and B) are involved, the statistical model is:<br />
ˆ = β + β A + β B + β AB<br />
(8)<br />
y<br />
0 1 2 3<br />
with ŷ representing the estimate for the response variable and β 0 , β 1 , β 2 , β 3<br />
are the model parameters: the interception, the influence <strong>of</strong> A and B in the<br />
response and the influence <strong>of</strong> A and B interaction, respectively. These<br />
parameters are called effects and are determined using the minimum square<br />
method. Performing replicates <strong>of</strong> experiments is strongly recommended,<br />
which allows the analyses <strong>of</strong> variance, including the F (Fisher distribution) t<br />
(student) and p-value. Consequently, the parameter significance can be<br />
evaluated. Also, response surface and counter plots can simplify the result<br />
interpretation.<br />
If it is not possible to do replicates, the effects significance can be<br />
evaluated by: the effects magnitude; normal probability plot and Pareto chart<br />
<strong>of</strong> the effects; main and interactions plots; and the residues verify any<br />
normality violation. However, only descriptive statistics is acceptable. No<br />
inference can be established because <strong>of</strong> the lack <strong>of</strong> degree <strong>of</strong> freedom. It only<br />
describes the data in the range <strong>of</strong> study [40] .<br />
Adding experiments replicated in the central points, provides n c -1<br />
degrees <strong>of</strong> freedom (n c = number <strong>of</strong> replicates), making it possible to<br />
determine the residue and, hence, some inference. This kind <strong>of</strong> addition can<br />
be done only when there are only numerical variables involved, which<br />
frequently occurs when studying spray drying.<br />
Frequently, there is interest in determining first and second order<br />
coefficients. In this case, it is necessary to add some points to the design. An<br />
interesting strategy is to include axial points what is called Central Composite<br />
Design. One possibility <strong>of</strong> determining the axial point levels is to choose ± α,<br />
with α = (2 k ) 1/4 . Hence, if there are two factors, = ±1,4142; three factors, α =<br />
±1,6818; four factors, α = ±2,0000, for example. A design with these axial<br />
points is named Rotational Central Composite Design. If there are two levels,<br />
it will result in 2 k factorial points + 2 k axial points + an arbitrary number <strong>of</strong><br />
central points [40] . This strategy is represented in Figure 8, considering a 2 3<br />
factorial: 2 levels, 3 factors (x 1 , x 2 and x 3 ).<br />
Another strategy is to use Box-Behnken design. This is very useful in<br />
evaluating response surfaces and uses two levels + central level in the<br />
experiments execution. It results in a fewer design points comparing to central<br />
composite design. Besides, the additional points fall in an operating zone<br />
within the determined levels while the axial points may fall beyond a safe<br />
operating limit. Figure 9 illustrates this design, considering 2 3 scheme as well.<br />
Another great advantage <strong>of</strong> this design is that it allows getting response<br />
surfaces and counter plots, leading to optimum point <strong>of</strong> operation.<br />
Passos, Birchal – Physical properties <strong>of</strong> powder 55
X 1<br />
X 3<br />
X 2<br />
Figure 8<br />
Rotational Central Composite design<br />
X 1<br />
X 3<br />
X 2<br />
Figure 9<br />
Box Behnken design<br />
In all strategies <strong>of</strong> designs, when the model does not seem to fit well, it is<br />
worthwhile trying to transform the variables involved, before trying a different<br />
model or a different design [41] . If there are k factors involved at N levels, it will<br />
result on a N k number <strong>of</strong> experiments, in a complete factorial scheme. Hence,<br />
it is almost impossible to run a complete scheme if there are 6 or more factors<br />
at 2 levels or 4 or more factors at 3 levels [40] . Besides, higher order<br />
interactions are evaluated, which is, frequently, unnecessary. In this case,<br />
fractional experiments can be used, carrying out a smaller set <strong>of</strong> experiments<br />
and considering only main effects and some interactions <strong>of</strong> lower order,<br />
which, in most <strong>of</strong> the times, domain the systems. This is called Fractional<br />
Factorial Design. It can be used 2 k-1 experiments (half fraction), 2 k-2 (1/4<br />
fraction), 2 k-3 (1/8 fraction) or less, according to the number <strong>of</strong> factors<br />
involved. Naturally, the smallest is the fraction, the smallest is the<br />
experimental resolution (order <strong>of</strong> interaction that can be obtained). It is<br />
important to make it clear that here it is given only a brief <strong>of</strong> some <strong>of</strong> the<br />
statistical techniques for developing a model. More details should be obtained<br />
in the specialized literature [39-42] .<br />
4.2 Empirical models for specific cases<br />
Some examples <strong>of</strong> modeling powder quality properties that have already<br />
developed in the literature based on techniques discussed previously (item<br />
4.1), can be seen in Table 1. Although only few works have already<br />
incorporated these empirical models into an integrated s<strong>of</strong>tware to describe<br />
the entire spray drying process in order to control the powder formation and<br />
Passos, Birchal – Physical properties <strong>of</strong> powder 56
its properties, this is a new feasible approach that begins to be developed,<br />
opening area for research and development.<br />
Table 1<br />
Statistical experiment design technique application to model<br />
powder quality in spray dryers.<br />
Design<br />
technique Factors Responses<br />
(final powder)<br />
Central<br />
composite<br />
Full-factorial<br />
Full-factorial<br />
inlet air<br />
temperature<br />
liquid feed flow<br />
rate<br />
carrier agent<br />
concentration<br />
inlet air<br />
temperature<br />
liquid feed flow<br />
rate<br />
air flow rate<br />
two-fluid nozzle<br />
gas flowrate<br />
inlet and outlet<br />
air<br />
temperatures<br />
liquid feed<br />
composition<br />
(starch, oil,<br />
glucose)<br />
process yield<br />
particle size<br />
hygroscopicity<br />
moisture content<br />
pigment content<br />
process yield<br />
particle size<br />
moisture content<br />
degradation<br />
protein, insulin<br />
(no-linear<br />
model)<br />
particle size<br />
particle surface<br />
particle density<br />
bulk density<br />
porosity<br />
lipid oxidation<br />
Main quality<br />
required<br />
minimize wall<br />
adherence<br />
maximize<br />
pigment<br />
retention<br />
reduce<br />
particle size<br />
for inhalation<br />
propose<br />
improve<br />
microencapsulation<br />
(formulation<br />
<strong>of</strong> wall<br />
components)<br />
Optimization<br />
performed<br />
no<br />
yes, statistical<br />
models<br />
(maximize<br />
process yield;<br />
minimize other<br />
responses)<br />
no<br />
Ref.<br />
26<br />
36<br />
25<br />
Full-factorial<br />
inlet air<br />
temperature<br />
liquid feed flow<br />
rate<br />
atomization<br />
speed rotation<br />
particle size and<br />
dispersion index<br />
bulk density<br />
Hausner ratio<br />
internal porosity<br />
moisture content<br />
maximize<br />
powder<br />
instantizing<br />
yes, with<br />
incorporation<br />
<strong>of</strong> empirical<br />
models to the<br />
integrated<br />
s<strong>of</strong>tware<br />
38<br />
5.0 Concluding remarks<br />
As shown and discussed in this chapter, powders can be produced in<br />
spray dryers with a desirable product quality to attend requirements from<br />
market and consumers. This is performed by manipulating the spray-dryer<br />
operational variables, using a simulation-optimization model strategy. Product<br />
quality must be defined previously and quantified by the powder properties<br />
that best describe the desirable quality. Empirical models, developed using<br />
statistical experiment design techniques, provide the key to optimize the spray<br />
dryer operation conditions in order to reach the desirable powder product at<br />
high quality.<br />
Passos, Birchal – Physical properties <strong>of</strong> powder 57
6.0 References<br />
1. Filková, I.; Mujumdar, A. S. Industrial spray drying systems. In Handbook<br />
<strong>of</strong> Industrial <strong>Drying</strong>, 3 rd edition, Mujumdar, A. S., Ed.; CRC Press Taylor<br />
and Francis Group, Boca Raton, Fl, 2006; pp.215-256.<br />
2. Pisecky, J. Evaporation and spray drying in the dairy industry. In<br />
Handbook <strong>of</strong> Industrial <strong>Drying</strong>, 2 rd edition, Mujumdar, A. S., Ed.; Marcel<br />
Dekker Inc.; New York, NY, 1995; pp.715-742.<br />
3. Birchal, V.S.; Passos, M. L. Modeling and simulation <strong>of</strong> milk emulsion<br />
drying in spray dyers. Braz. J. Cem. Eng. 2005, 22, 293-302.<br />
4. Mezhericher, M.; Levy, A.; Borde, I. Theoretical drying model <strong>of</strong> single<br />
droplets containing insoluble or dissolved solids. <strong>Drying</strong> Techn. 2007,<br />
25(6), 1.025-1032<br />
5. Kim, E.H.J.; Chen, X. D.; Pearce, D. On the mechanisms <strong>of</strong> surface<br />
formation and the surface compositions <strong>of</strong> industrial milk powders. <strong>Drying</strong><br />
Technol. 2003, 21(2), 265-278.<br />
6. Charlesworth, D. H.; Marshall Jr., W. R. Evaporating from drops<br />
containing dissolved solids. A. I. Ch. E. Journal 1960, 6(1), 9-23.<br />
7. Nešić, S. The evaporation <strong>of</strong> single droplets - Experiments and modelling.<br />
In <strong>Drying</strong>’89, Mujumdar, A.S., Ed.; Hemisphere Publishing Corp., New<br />
York, NY, 1990; pp.386–393.<br />
8. Seydel, P.; Blömer, J.; Bertling, J. Modeling particle formation at spray<br />
drying using population balances. <strong>Drying</strong> Techn. 2006, 24, 137-146.<br />
9. Refstrup, E. Recent advances in agglomeration during spray drying.<br />
http://niroinc.com/<br />
drying_dairy_food/recent_advances_agglomeration.asp (accessed March<br />
30, 2010).<br />
10. King, C. J.; Kieckbusch, T. G.; Greenwald, C. G. Food-quality factors in<br />
spray drying. In Advances in <strong>Drying</strong>, vol. 3, Mujumdar, A. S., Ed.;<br />
Hemisphere Publishing Corp., New York, NY, 1984, pp. 71-120.<br />
11. Knegt, R.J.; Brink, H. van den. Improvement <strong>of</strong> the drying oven method for<br />
the determination <strong>of</strong> the moisture content <strong>of</strong> milk powder. Int. Dairy J.<br />
1998, 8, 733-738.<br />
12. Beuchat, L. Microbial stability as affected by water activity. Cereal Foods<br />
World 1981, 26, 345-351.<br />
13. Decagon Inc. AquaSorp - moisture sorption isotherm generator.<br />
Operator’s Manual, version 3.0.<br />
http://www.decagon.com/<strong>pdf</strong>s/manuals/AquaSorp_v3.<strong>pdf</strong> (accessed<br />
March 30, 2010).<br />
14. Passos, M. L.; Mujumdar, A. S. Mathematical models for improving spray<br />
drying processes for foods. Stewart Postharvest Review. 2005, 1(4), 6:1-<br />
12.<br />
15. Masters, K. <strong>Spray</strong> <strong>Drying</strong> Handbook, 5 th ed.; Longman Group: Harlow,<br />
Essex, 1991.<br />
16. Ré, M. I. Formulating drug delivery systems by spray drying. <strong>Drying</strong><br />
Technol. 2006, 24, 433-446.<br />
17. Medeiros, U. K. L.; Medeiros, M. F. D.; Passos, M. L. Goat milk production<br />
in small agro-cooperatives. In Innovation in Food Engineering New<br />
Techniques and Products, Passos, M. L. and Ribeiro, C. P., Eds.; CRC<br />
Press Taylor and Francis Group, Boca Raton, Fl, 2010; pp.539-578.<br />
Passos, Birchal – Physical properties <strong>of</strong> powder 58
18. Svarovsky, L. Solid-liquid Separation, 4 th ed.; Butterworths: Witham,<br />
Essex, 2000.<br />
19. Geldart, D. Gas Fluidization <strong>Technology</strong>, John Wiley & Sons Ltda.:<br />
Chichester, Sussex, 1986.<br />
20. Hahne, L.C.C. Experimental studies about the particle drying and<br />
agglomerating in vibro-fluidized beds for milk powder production. Master<br />
Thesis. Federal <strong>University</strong> <strong>of</strong> Minas Gerais, 2001 (in Portuguese).<br />
21. Ilari, J-L.; Mekkaoui, L. Physical properties <strong>of</strong> constitutive size classes <strong>of</strong><br />
spray-dried skim milk powder and their mixtures. Lait. 2005, 85, 279-294.<br />
22. Westergaard, V. Milk Powder <strong>Technology</strong> – Evaporation and <strong>Spray</strong><br />
<strong>Drying</strong>. 5 th ed., Niro A/S, Copenhagen, Denmark. 2004.<br />
23. Birchal, V. S. Modeling and simulating <strong>of</strong> milk drying in spray dryers, Ph.D<br />
Thesis. Federal <strong>University</strong> <strong>of</strong> Minas Gerais, 2003 (in Portuguese).<br />
24. Pisecky, J. Bulk density <strong>of</strong> milk powders. Dairy Industries Int. 1978, 3, 4-<br />
11.<br />
25. Drusch, S.; Schwarz, K. Microencapsulation properties <strong>of</strong> two different<br />
types <strong>of</strong> n-octenylsuccinate-derivatised starch. Eur. Food Res. Technol.<br />
2006, 222, 155-164.<br />
26. Tonon, R.; Brabet, C.; Hubinger, M. Influence <strong>of</strong> process conditions on the<br />
physicochemical properties <strong>of</strong> açai (Euterpe oleraceae Mart.) powder<br />
produced by spray drying. J. Food Eng. 2008, 88, 411-418.<br />
27. Langrish, T. A. G. New engineered particles from spray dryers: research<br />
needs in spray drying. <strong>Drying</strong> Techn. 2007, 25(6), 971-983.<br />
28. Ozmen, L., Langrish, T. A. C. An experimental investigation <strong>of</strong> the wall<br />
deposition <strong>of</strong> milk powder in a pilot-scale spray dryer. <strong>Drying</strong> Techn. 2003,<br />
21(7), 1253-1272.<br />
29. Ozmen, L., Langrish, T. A. C. Comparison <strong>of</strong> glass transition temperature<br />
and sticky point temperature for skim milk powder. <strong>Drying</strong> Techn. 2002,<br />
20(6), 1177 – 1192.<br />
30. Kota K.; Langrish T. A. G. Prediction <strong>of</strong> wall deposition behaviour in a<br />
pilot-scale spray dryer using deposition correlations for pipe flows. J.<br />
Zhejiang <strong>University</strong> Sci. A, 2008, 8(2), 301-312.<br />
31. Emery, E. Flow properties <strong>of</strong> selected pharmaceutical powders. Master<br />
Thesis, <strong>University</strong> <strong>of</strong> Saskatchewan, Saskatoon, Canada, 2008.<br />
32. Fredlund, D.G.; Rahardjo, H. Soil Mechanics Unsaturated Soils. John<br />
Wiley & Sons Inc., New York, NY, 1993.<br />
33. Castellanos, A.; Valverde, J. M.; Quintanilla, M.A.S. The Sevilla powder<br />
tester: a tool for characterizing the physical properties <strong>of</strong> fine cohesive<br />
powders at very small consolidations. Kona, 2004, 22, 66-81.<br />
34. Hayes, G. D. Food Engineering Data Book, Longman Scientific and<br />
Technical, London, 1987.<br />
35. Xinde, X.; Shanjiing, Y.; Ning, H.; Bin, S. Measurement and influence<br />
factors <strong>of</strong> the flowability <strong>of</strong> microcapsules with high-content β-carotene.<br />
Chin. J. Chem. Eng. 2007, 15(4), 579-585.<br />
36. Ståhl, K.; Claesson, M.; Lilliehorn, P.; Lindén, H.; Bäckström, K. The effect<br />
<strong>of</strong> process variables on the degradation and physical properties <strong>of</strong> spray<br />
dried insulin intended for inhalation. Int. J. Pharm. 2002, 233, 227-237.<br />
37. Healy, A.M.; McDonald, B. F.; Tajber, L.; Corrigan, O. I. Characterization<br />
<strong>of</strong> excipient-free nanoporous microparticles (NPMPs) <strong>of</strong><br />
bendr<strong>of</strong>lumethiazide. European J. Pharm. Biopharm. 2008, 69, 1182-<br />
1186.<br />
Passos, Birchal – Physical properties <strong>of</strong> powder 59
38. Birchal, V.S.; Passos, M. L.; Wildhagen, G.R.S.; Mujumdar, A.S. Effect <strong>of</strong><br />
spray-dryer operating variables on the whole milk powder. <strong>Drying</strong> Techn.<br />
2005, 23(3), 611-636.<br />
39. Montgomery, D. C. Design and analysis <strong>of</strong> experiments. 6ed., John Wiley<br />
& Sons Inc., New York, NY, 2005.<br />
40. Rodrigues, M.I.; Iemma, A.F. Experiment Design and Process<br />
Optimization: a sequential design strategy. Casa do Pão, Campinas, SP,<br />
2005 (in Portuguese).<br />
41. Box, G.E.P; Hunter, J.S. Statistics for Experimenters: An Introduction to<br />
designs, Data Analysis and Model Building. Wiley. New York, N.Y, 1978.<br />
42. Box, G.E.P; Drapper, N.R. Empirical Model – Building and Response<br />
Surfaces. John Wiley & Sons, New York, N.Y., 1987.<br />
Passos, Birchal – Physical properties <strong>of</strong> powder 60
Langrish, T.A.G. <strong>Spray</strong> drying and crystallization - Volume 1, Ed. Woo, M.W.,<br />
Mujumdar, A.S. and Daud, W.R.W., 2010, ISBN - 978-981-08-6270-1, Published in<br />
<strong>Singapore</strong>, pp. 61-76.<br />
<strong>Spray</strong> drying and crystaliization<br />
Chapter 3<br />
Langrish T.A.G.<br />
Department <strong>of</strong> Chemical and Biomolecular Engineering<br />
<strong>University</strong> <strong>of</strong> Sydney, Australia<br />
Contents<br />
Page<br />
1.0 Introduction 61<br />
1.1 Effect on particle-wall deposition 62<br />
2.0 Parallel-flow design equations 65<br />
2.1 Equations for droplet trajectories 66<br />
2.2 Mass balance equations for the droplets 67<br />
2.3 Heat balance equations for the droplets 68<br />
2.4 Balance equations for the drying medium 69<br />
2.5 Particulate drying kinetics 70<br />
3.0 Crystallization in drying 70<br />
3.1 A physical transformation 70<br />
3.2 Outcomes from using the simulation 73<br />
4.0 References 73<br />
1.0 Introduction<br />
The benefits <strong>of</strong> crystallization-in-drying can be simply stated as giving an<br />
understanding <strong>of</strong> the basic form or state <strong>of</strong> the solids that arise after the drying<br />
process and how the drying process can be used to not only control the<br />
particle moisture content but also the solid form.<br />
Regarding the industrial motivation for studying this process, it is<br />
possible to imagine a number <strong>of</strong> particle production methods that might<br />
contribute to manufacturing new engineered powders, as illustrated in Figure<br />
1. Concentrating now on the use <strong>of</strong> crystallization during drying as a method<br />
to create particular solids structures from spray-dried products, Figure 2<br />
illustrates the situation that a particular final moisture content may be<br />
produced through a number <strong>of</strong> different routes, and each different route may<br />
create different degrees <strong>of</strong> crystallinity and hence different solids structures.<br />
Langrish – <strong>Spray</strong> drying and crystallization 61
1.1 Effect on particle-wall deposition<br />
On the basis <strong>of</strong> the Williams-Landel-Ferry findings [1] , the rate <strong>of</strong> this<br />
solid-phase crystallization process accelerates when the particle temperature<br />
is above the glass-transition temperature <strong>of</strong> the particle. This consideration<br />
implies that trying to crystallize materials inside spray dryers needs to<br />
consider the combination <strong>of</strong> heat and mass transfer processes, as illustrated<br />
in Figures 3 and 4. Figure 3 shows that there are several different outcomes<br />
for particles that hit the walls <strong>of</strong> spray dryers. In relatively low temperature<br />
drying (low relative to the glass-transition temperature <strong>of</strong> the particles), the<br />
amorphous particles from the atomizer are likely to remain amorphous as they<br />
travel through the gas. Providing that the particle temperatures are below<br />
their glass-transition temperatures, the amorphous particles will remain glassy<br />
and bounce <strong>of</strong>f the walls <strong>of</strong> the spray dryer (case 1). At higher temperatures,<br />
the temperatures <strong>of</strong> the amorphous particles may exceed their glass-transition<br />
temperatures, making the amorphous particles sticky and rubbery so that they<br />
are more likely to stick to the walls <strong>of</strong> the spray dryer, decreasing the yield or<br />
recovery from spray drying (case 2). The amorphous particles that stick to the<br />
walls may then crystallize as they are present on the walls. However, at even<br />
higher temperatures, there is an opportunity for the particle temperatures to<br />
exceed the glass-transition temperatures sufficiently for the particles to<br />
crystallize before the particles hit the dryer walls. This situation means that<br />
the crystallized particles are likely to bounce <strong>of</strong>f the walls, increasing the yield<br />
again (case 3). Hence, for a fixed liquid feed rate, concentration and<br />
composition <strong>of</strong> solids in the liquid, initial droplet size, gas flow rate and<br />
humidity, increasing the inlet gas temperature is likely to increase the particle<br />
temperatures throughout the dryer, initially increasing the yields with better<br />
drying, which decreases the particle moisture contents and increases the<br />
glass-transition temperatures <strong>of</strong> the particles (case 1). Then, with further<br />
increases in the particle temperatures above the glass-transition temperatures<br />
<strong>of</strong> the particles, the yields are likely to decrease as the particles become<br />
stickier (case 2). Finally, at high enough temperatures, the particles are likely<br />
to crystallize, increasing the yields as crystallized particles bounce <strong>of</strong>f the<br />
dryer walls (case 3). In summary, we are likely to see the yields or recoveries<br />
from spray drying increase, then decrease, and finally increase again as the<br />
inlet gas temperature to the dryer is increased.<br />
Experimental evidence exists to support these assertions, and Figure 4<br />
includes real data for the spray drying <strong>of</strong> sucrose [2] that follows this predicted<br />
trend in terms <strong>of</strong> experimental observations. These data were obtained from<br />
a laboratory-scale spray dryer (Buchi 290) when spray drying sucrose. The<br />
region where the particles are very sticky and adhere to the dryer walls and<br />
cohere to particles already on the walls is described as “the stickiness<br />
barrier”.<br />
Langrish – <strong>Spray</strong> drying and crystallization 62
Free-flowing,<br />
stable powders,<br />
good yields<br />
Crystallization<br />
in drying:<br />
stability<br />
Surface coating:<br />
free flowing,<br />
good yields<br />
Figure 1<br />
Combinations <strong>of</strong> particle engineering techniques for better<br />
engineered particles.<br />
moisture content<br />
initial state<br />
Different routes to final moisture<br />
content, different degrees <strong>of</strong><br />
crystallinity, different solids structures<br />
final state<br />
time<br />
Figure 2<br />
Different drying trajectories in spray drying for giving different<br />
solid structures while giving the same final moisture contents.<br />
Langrish – <strong>Spray</strong> drying and crystallization 63
These considerations regarding the effects <strong>of</strong> particle and glasstransition<br />
temperatures mean that materials with very low glass-transition<br />
temperatures might be expected to crystallize during spray drying even with<br />
low inlet or outlet gas temperatures. Indeed, this is the case, with ascorbic<br />
acid (vitamin C) having a glass-transition temperature under -40 o C [3] but<br />
crystallizing completely under all spray-drying conditions, even those involving<br />
inlet air temperatures as low as 110 o C [4] .<br />
Atomizer<br />
Dry, low<br />
temperature<br />
glassy<br />
amorphous<br />
particle<br />
bounces <strong>of</strong>f<br />
wall<br />
Droplet<br />
Case 1: “Low”<br />
temperature,<br />
amorphous<br />
Wall<br />
Atomizer<br />
Droplet<br />
Dry, higher<br />
temperature<br />
sticky<br />
amorphous<br />
particle sticks<br />
to wall<br />
Wall<br />
Case 2: “Higher”<br />
temperature,<br />
amorphous<br />
Dry, higher<br />
temperature<br />
sticky<br />
amorphous<br />
particle<br />
crystallizes<br />
before it hits<br />
the wall<br />
Atomizer<br />
Droplet<br />
Amorphous particle<br />
Crystalline particle<br />
bounces <strong>of</strong>f wall<br />
Wall<br />
Case 3: “Even higher”<br />
temperature, crystalline<br />
Figure 3<br />
Different trajectories for spray-dried particles in spray dryers.<br />
With higher inlet air temperatures and consequently higher particle<br />
temperatures leading to greater particle crystallization in spray dryers [5][6] ,<br />
there may be some suspicion that these high temperatures may lead to the<br />
spray-dried material being degraded as a result <strong>of</strong> the crystallization process.<br />
However, less than 5% degradation has been found for the spray drying <strong>of</strong><br />
sucrose [2] and ascorbic acid [4] . The underlying reasons why the amount <strong>of</strong><br />
degradation is so small can be understood by assessing the nature and extent<br />
<strong>of</strong> the temperature dependence <strong>of</strong> the solid-phase crystallization process [7] as<br />
quantified by the Williams-Landel-Ferry equation [1] . The logarithmic (base<br />
10) and exponentiation (10^) terms in this equation mean that this equation<br />
predicts increases in the solid-phase crystallization rate that involve orders <strong>of</strong><br />
magnitude increases in the crystallization rate with only a few degrees<br />
increase in particle temperature (Figure 5). This extremely rapid increase in<br />
predicted crystallization rate with increasing temperature should be contrasted<br />
with the normal behaviour <strong>of</strong> most reactions, including most degradation ones,<br />
that the rate doubles approximately with each ten degree increase in<br />
temperature. Hence the temperature dependence <strong>of</strong> the solid-phase<br />
crystallization process as predicted by the Williams-Landel-Ferry equation [1]<br />
Langrish – <strong>Spray</strong> drying and crystallization 64
could be described as “super Arrhenius”. The practical outcome <strong>of</strong> this<br />
situation is simply that the material is more likely to crystallize before it<br />
degrades, as has been found experimentally.<br />
50<br />
40<br />
3% Pump Rate<br />
5% Pump Rate<br />
10% Pump Rate<br />
Yield, %<br />
30<br />
20<br />
10<br />
0<br />
The<br />
Stickiness<br />
Barrier<br />
30 50 70 90 110 130 150<br />
Outlet gas temperature, o C<br />
Figure 4<br />
Yield <strong>of</strong> the spray-dried products at different outlet gas<br />
temperatures for the spray drying <strong>of</strong> sucrose in a Buchi 290<br />
spray dryer [2]<br />
So far, the discussion has focussed on what can be done to crystallize<br />
materials, but keeping materials amorphous is also potentially <strong>of</strong> interest.<br />
Amorphous material is more porous [8] , more soluble [9-12] , more bioavailable<br />
[11][13-15] and more sorptive [5][6][16] . Reducing the extent <strong>of</strong> crystallization during<br />
spray drying may be achieved by keeping the difference between the particle<br />
and the glass-transition temperatures as low as possible, but other methods<br />
are also possible. Formulatiing the material to be dried with additional<br />
proteins and/or fats will reduce the crystallization rates <strong>of</strong> sugars, since<br />
the\proteins and fats act to reduce the rate at which the sugar molecules<br />
rearrange themselves into a crystal matrix [17] .<br />
A key question is how to simulate the process <strong>of</strong> crystallization-in-drying<br />
within spray dryers so that it can either be maximized or minimized, and an<br />
answer to this question is explored in the following sections.<br />
2.0 Parallel-flow design equations<br />
The following framework treats spray dryers as having the gas and solids<br />
flowing in parallel to each other, and is more appropriate for tall-form spray<br />
dryers than for short-form ones, due to the overall flow patterns, as discussed<br />
above. Truong, Bhandari & Howes [18] have given a clear description <strong>of</strong><br />
equations for these situations, and these equations are largely reproduced in<br />
the following sections. The approach, and the equations in it, was originally<br />
Langrish – <strong>Spray</strong> drying and crystallization 65
eported by Keey & Pham [19]. This approach has been used by a number <strong>of</strong><br />
authors [6][18] . The subscripts p, a, s have been used to represent the droplet,<br />
air and solids, respectively in the following equations.<br />
)<br />
le<br />
a<br />
c<br />
s<br />
g<br />
(lo<br />
/k gl a ss<br />
k cr<br />
1.E+10<br />
1.E+09<br />
1.E+08<br />
1.E+07<br />
1.E+06<br />
1.E+05<br />
1.E+04<br />
1.E+03<br />
1.E+02<br />
1.E+01<br />
1.E+00<br />
0 10 20 30 40 50 60<br />
T-T glass (K)<br />
.Figure 5<br />
Predicted temperature dependence <strong>of</strong> the solid-phase<br />
crystallization process predicted from the Williams-Landel-Ferry<br />
equation [1] in terms <strong>of</strong> the increase in crystallization rate (k cr )<br />
compared with the crystallization rate at the glass-transition<br />
temperature (k g ) as a function <strong>of</strong> the difference between the<br />
particle (T) and the glass-transition (T glass ) temperatures.<br />
2.1 Equation for droplet trajectories<br />
Droplet axial, radial and tangential momentum balances give the droplet<br />
trajectory equations. The velocity (m s -1 ) <strong>of</strong> the particles and the air are<br />
represented by U p and U a , respectively. The subscripts x, r and t represent the<br />
axial, radial and tangential components, respectively, and the axial distance<br />
from the atomiser has the symbol h.<br />
( U − U )<br />
dU ⎡⎛ ⎞<br />
px<br />
a<br />
3 aCDU<br />
⎤<br />
R px ax 1<br />
⎢⎜<br />
ρ ρ<br />
= 1 − ⎟g<br />
−<br />
⎥<br />
dh<br />
⎢⎣<br />
⎝ ρ<br />
p ⎠ 4 ρ pd<br />
p ⎥⎦<br />
U<br />
dU ⎡<br />
pr 3 ρaCDU<br />
R<br />
( U<br />
pr<br />
−U<br />
ar<br />
) ⎤ 1<br />
= ⎢−<br />
⎥<br />
dh ⎢⎣<br />
4 ρ<br />
pd<br />
p ⎥⎦<br />
U<br />
px<br />
( U −U<br />
)<br />
dU pt<br />
⎡ 3 ρaCDU<br />
R pt at<br />
⎤ 1<br />
= ⎢−<br />
⎥<br />
dh ⎢⎣<br />
4 ρ pd<br />
p ⎥⎦<br />
U<br />
px<br />
px<br />
(1)<br />
(2)<br />
(3)<br />
Langrish – <strong>Spray</strong> drying and crystallization 66
The density is ρ (kg m -3 ), d p is the droplet diameter (m), U R is the relative<br />
velocity between the droplet and the air (m s -1 ), and C D is the drag coefficient.<br />
The air and the particle or droplet are referred to by the subscripts a and p,<br />
respectively. Equations given by Rhodes (1998) allow U R and C D to be<br />
calculated, as follows:<br />
U<br />
R<br />
( U −U<br />
) + ( U −U<br />
) 2<br />
+ ( U −U<br />
) 2<br />
px<br />
2 ax pr ar<br />
pt at<br />
= (4)<br />
0.687<br />
( 1 0.15 Re )<br />
24<br />
C<br />
D<br />
= +<br />
p<br />
(5)<br />
Re<br />
p<br />
By definition, the particle Reynolds number is given by the equation:<br />
ρaU<br />
Rd<br />
p<br />
Re<br />
p<br />
=<br />
(6)<br />
µ<br />
a<br />
where the viscosity is µ (kg m -1 s -1 ). The calculation <strong>of</strong> the radial distance, r,<br />
<strong>of</strong> droplets as a function <strong>of</strong> axial distance (h) from the atomiser is carried out<br />
as follows.<br />
U<br />
dr pr<br />
= (7)<br />
dh<br />
U<br />
px<br />
2.2 Mass balance equations for the droplets<br />
The unsteady-state mass balance for the droplets may be based on the<br />
concept <strong>of</strong> a characteristic drying curve [20] , as follows:<br />
dm p<br />
dh<br />
Ap<br />
K p<br />
= −ξ ( pvs<br />
− pvp<br />
)<br />
(8)<br />
U px<br />
The mass <strong>of</strong> the particle or droplet is m p (kg), p vs is the partial pressure<br />
<strong>of</strong> the surface <strong>of</strong> the droplet (Pa), p vb is the partial pressure <strong>of</strong> water vapour in<br />
the bulk air (Pa), ξ is the relative drying rate (-), A p is the droplet surface area<br />
(m 2 ), and K p is the mass-transfer coefficient (partial pressure based) (kg m -2 s -<br />
1<br />
Pa -1 ). The droplet surface area (A p ) can be calculated as follows.<br />
A<br />
2<br />
p πd P<br />
= (9)<br />
Shrinkage changes the droplet diameter. For some materials, such as<br />
salt, which do not form hollow particles, the assumption <strong>of</strong> balloon shrinkage<br />
without crust or skin formation (reasonable for salt [21] ) allows the droplet<br />
diameter, d p , to be updated, as follows.<br />
Langrish – <strong>Spray</strong> drying and crystallization 67
⎛ ρ 1000 ⎞<br />
pi<br />
−<br />
d p<br />
= d pi<br />
⎜ ⎟<br />
1000<br />
⎝ ρ<br />
p<br />
− ⎠<br />
1<br />
3<br />
(10)<br />
ρ<br />
p<br />
1+<br />
X<br />
=<br />
ρs<br />
1+<br />
X<br />
ρ<br />
w<br />
ρ<br />
s<br />
(11)<br />
The variables that have not been defined previously are d pi , the initial droplet<br />
diameter (m), ρ pi , the initial droplet density (kg m -3 ), and X is the moisture<br />
content (dry-basis). The following equations define the gas-phase masstransfer<br />
coefficient:<br />
M<br />
wKm<br />
K<br />
p<br />
= (12)<br />
M P<br />
a<br />
K<br />
m<br />
ρ D Sh<br />
d<br />
a v<br />
= (13)<br />
p<br />
K p is the mass-transfer coefficient (partial pressure based, in kg m -2 s -1 Pa -1 ),<br />
K m is the mass-transfer coefficient (kg m -2 s -1 ), D v is the diffusivity <strong>of</strong> water in<br />
air (m 2 s -1 ), Sh is the Sherwood number, M w is the molecular weight <strong>of</strong> water<br />
(g mol -1 ), M a is the molecular weight <strong>of</strong> air (g mol -1 ), and P is the total pressure<br />
(Pa). The following equation may be used to estimate the diffusivity (Perry’s<br />
Chemical Engineering Handbook, 1997):<br />
D<br />
v<br />
1.17564 × 10<br />
=<br />
−9<br />
× T<br />
P<br />
1.75<br />
abs<br />
× 101325<br />
(14)<br />
The following equations define the Schmidt number (Sc) and allow the<br />
Sherwood number to be estimated:<br />
Sc<br />
µ<br />
ρ D<br />
a<br />
= (15)<br />
a<br />
v<br />
Sh<br />
0.5 0.33<br />
= 2.0<br />
+ 0.6Re<br />
p<br />
Sc<br />
(16)<br />
where T abs is the absolute temperature <strong>of</strong> the droplet or particle (K).<br />
2.3 Heat balance equations for the droplets<br />
For the droplet or particle, the unsteady-state heat balance is given by the<br />
equation [18] :<br />
Langrish – <strong>Spray</strong> drying and crystallization 68
dT<br />
p<br />
dh<br />
πd<br />
=<br />
p<br />
k<br />
a<br />
Nu<br />
m<br />
p<br />
( Ta<br />
− Tp<br />
) +<br />
dh<br />
( C<br />
ps<br />
+ XC<br />
pw<br />
) U<br />
px<br />
s<br />
dm<br />
U<br />
px<br />
H<br />
fg<br />
(17)<br />
The following equations define the Prandtl number (Pr) and allow the Nusselt<br />
number (Nu) to be estimated by the Ranz-Marshall equation:<br />
µ<br />
C pa a<br />
Pr = (18)<br />
ka<br />
0.5 0.33<br />
= 2.0<br />
0.6 Re<br />
p<br />
Pr<br />
(19)<br />
Nu +<br />
Other product and particle properties are calculated as follows:<br />
Xmp<br />
m<br />
s<br />
= (20)<br />
100<br />
H<br />
fg<br />
6<br />
2<br />
2.792×<br />
10 −160T<br />
abs<br />
− 3.43T<br />
abs<br />
= (21)<br />
Here k a is the thermal conductivity <strong>of</strong> humid air (W m -1 K -1 ), H fg is the latent<br />
heat <strong>of</strong> water evaporation (J kg -1 ), m s is the mass <strong>of</strong> solids in the droplet (kg)<br />
and C p is the specific heat capacity (J kg -1 K -1 ).<br />
2.4 Balance equations for the drying medium<br />
For the drying air, the mass-balance equation equates the mass <strong>of</strong> moisture<br />
lost by the droplets or particles with the mass <strong>of</strong> moisture gained by the gas:<br />
dYb<br />
dh<br />
⎛ dm<br />
p ⎞<br />
Σ<br />
droplets<br />
⎜ − ndroplets<br />
dh<br />
⎟<br />
=<br />
⎝ ⎠<br />
(22)<br />
G<br />
The mass flow rate <strong>of</strong> the dry air is G (kg s -1 ), and n droplets is the flow rate <strong>of</strong><br />
droplets (number s -1 ). The corresponding heat-balance equation, again<br />
balancing the energy lost by the droplets or particles with the gain in humid<br />
heat capacity and heat loss from the dryer, is:<br />
dH<br />
dh<br />
h<br />
1 ⎛<br />
= − ⎜<br />
G<br />
Σ<br />
⎝<br />
droplets<br />
⎛<br />
⎜m<br />
⎝<br />
s<br />
( C + XC )<br />
ps<br />
pw<br />
dTp<br />
⎞ UA Ta<br />
−<br />
dh<br />
⎟<br />
⎠ L<br />
( − T )<br />
amb<br />
⎞<br />
⎟<br />
n<br />
⎠<br />
droplets<br />
(23)<br />
The enthalpy <strong>of</strong> the humid air is H h (J kg -1 ), UA is the heat-transfer coefficient<br />
for heat loss from the dryer, and L is the length <strong>of</strong> the spray-drying chamber.<br />
Langrish – <strong>Spray</strong> drying and crystallization 69
2.5 Particulate drying kinetics<br />
Correct quantitative prediction <strong>of</strong> the droplet and particle behaviour in the<br />
dryer requires proper modelling <strong>of</strong> the drying behaviour <strong>of</strong> the droplets. The<br />
temperature and moisture content <strong>of</strong> the droplets and particles affect all<br />
subsequent reactions, including crystallization. It is important to allow<br />
properly for hindered drying due to the presence <strong>of</strong> the solids. Various<br />
approaches exist in the literature, including the characteristic drying curve<br />
[19][22] , A shortcut solution to the diffusion equation [23][24] and other diffusion<br />
models [25][26] , Receding-plane type models [20] and others that include both<br />
convection and diffusion as transport processes [27] and reaction engineering<br />
approaches [28][29] . Both a characteristic drying curve (CDC) and the reaction<br />
engineering approach (REA) have been used to simulate drying behaviour<br />
and compared [28] with experimental data for whole and skim milk droplets,<br />
finding that the predictions from the REA model are closer to the experimental<br />
results from using CDC.<br />
Although the predicted results from the REA model were closer to the<br />
experiments than those predicted by the CDC model, the difference was<br />
small, remaining under 5% for both models. Chen & Lin [28] recognised that<br />
the CDC model provided a good approximation to the experimental results,<br />
despite its simplicity. In addition, they recognised that the REA model<br />
includes initially incorrect activation energies, higher than the actual one,<br />
because the milk droplets initially behave in the same way as water, where<br />
the activation energy <strong>of</strong> drying is close to zero. The REA model overpredicts<br />
this value, thus underestimating the initial drying rate and predicting droplet<br />
temperatures that rise faster than in reality. This initial period <strong>of</strong> time, where<br />
over-prediction <strong>of</strong> the activation energy occurs, was found by Chen & Lin to<br />
be approximately the first 10% <strong>of</strong> the total drying time. Patel & Chen [29] used<br />
a parallel-flow approach to compare the two models, suggesting that the REA<br />
model gave better predictions at high relative humidities and high feed<br />
concentrations, but that the two models were similar under other conditions.<br />
3.0 Crystallization in drying<br />
3.1 A physical transformation<br />
The extent <strong>of</strong> crystallization <strong>of</strong> a powder has a pr<strong>of</strong>ound effect on<br />
properties relating to both use and handling. Studies <strong>of</strong> the properties <strong>of</strong><br />
powders [30] , have shown that fully crystalline powders have improved<br />
flowability and decreased wall deposition, whereas completely amorphous<br />
powders have the greatest bioavailability and adsorptive capacity [31] at the<br />
expense <strong>of</strong> flowability and stability [32] . A particle with a crystalline surface but<br />
an amorphous interior will retain much <strong>of</strong> the adsorptive capacity and<br />
bioavailability <strong>of</strong> an amorphous particle, with the crystalline flowability and<br />
decreased deposition characteristics. Hence the ability to control the degree<br />
Langrish – <strong>Spray</strong> drying and crystallization 70
<strong>of</strong> crystallization will have significant benefits for those using spray-dried<br />
products as well as those operating the processes.<br />
Background<br />
Water-induced crystallization <strong>of</strong> lactose in storage has been known for a<br />
long time [33][34] , but recently we have shown that water-induced crystallization<br />
<strong>of</strong> lactose occurs in spray dryers [5][6] , due to the high temperatures involved<br />
and the control <strong>of</strong> humidity and product moisture content that is possible in<br />
this equipment. We have also shown [35] that water-induced crystallization<br />
occurs for a wide range <strong>of</strong> materials, including sucrose, c<strong>of</strong>fee, tea, skim milk,<br />
maltodextrin and hibiscus extract. Most recently, we have shown [2] that<br />
sucrose can be fully crystallized inside a laboratory-scale (Buchi) spray dryer<br />
(small scale).<br />
Basic Theory<br />
Actual measurements <strong>of</strong>, and correlations for, the rate <strong>of</strong> crystallisation <strong>of</strong><br />
polymers, organic glasses and inorganic were reported by Williams, Landel<br />
and Ferry [1] (WLF) and used to form the WLF equation. Roos and Karel [36]<br />
were able to apply the equation to food polymers, such as lactose. They<br />
found that the ratio (r) <strong>of</strong> the time for crystallisation (θ cr ) (time taken for the<br />
material to become 100% crystalline) at any temperature (T p ) to the time for<br />
crystallisation (θ g ) at the glass-transition temperature (T gt ) could be correlated<br />
by the following equation (the WLF equation):<br />
⎛ ⎞ −<br />
cr<br />
r ⎜<br />
ϑ 17.44<br />
log ⎟<br />
10<br />
= log10<br />
=<br />
⎝ ϑg<br />
⎠ 51.6 +<br />
( Tp<br />
− Tgt<br />
)<br />
( T − T )<br />
p<br />
gt<br />
(24)<br />
Since the ratio, r, decreases when crystallisation becomes more rapid,<br />
the inverse <strong>of</strong> this ratio is a measure <strong>of</strong> the relative rate <strong>of</strong> crystallisation,<br />
compared with the crystallisation rate at the glass-transition temperature. The<br />
inverse <strong>of</strong> this ratio can be described as the “impact” <strong>of</strong> the particle<br />
temperature, T p , and the glass-transition temperature, T gt , which is a function<br />
<strong>of</strong> the particle moisture content, X, through the Gordon-Taylor equation. Both<br />
the particle temperature, T p , and the particle moisture content, X, change<br />
through the dryer, as described in the previous sections, so the glasstransition<br />
temperature, T gt , also changes as the droplets and particles dry out<br />
when they move through the dryer.<br />
The Gordon-Taylor equation [37] can be used to predict the glasstransition<br />
temperature <strong>of</strong> food mixtures and pharmaceutical solids as a<br />
function <strong>of</strong> the composition and the glass-transition temperatures <strong>of</strong> the<br />
individual components that make up the mixture:<br />
T<br />
gt<br />
w1<br />
Tgt1<br />
+ k w2<br />
Tgt2<br />
= (25)<br />
w + k w<br />
1<br />
2<br />
where, w 1 and w 2 are the respective weight fractions <strong>of</strong> the two<br />
components, T gt1 is the glass-transition temperature <strong>of</strong> one component, T gt2 is<br />
the glass-transition temperature <strong>of</strong> the other component, and k is a curvature<br />
constant, which can be determined empirically. One <strong>of</strong> these components<br />
Langrish – <strong>Spray</strong> drying and crystallization 71
may be the solid material that is spray dried, while the other might be the<br />
moisture in the particle, and the equation can be extended to three or more<br />
components in the particle (Arvanitoyannis et al., 1993). This equation is<br />
based on the assumption <strong>of</strong> perfect volume additivity, that is, the liquids mix<br />
without any change in volume, and there is no specific interaction between the<br />
components <strong>of</strong> the mixture. The equation has been used by many workers to<br />
predict that the glass-transition temperature decreases with increasing<br />
moisture content, as is found experimentally. The glass-transition<br />
temperature is affected by the nature and composition <strong>of</strong> the components<br />
[36][38] . The weight fraction <strong>of</strong> water, w, is related to the moisture content, X,<br />
expressed on a dry basis, through the equation w = X / (1 + X).<br />
Both the particle temperature and the particle moisture content change<br />
through the dryer, and these changes are predicted by the simulation. These<br />
changes mean that the local value <strong>of</strong> the “impact”, the inverse <strong>of</strong> the ratio <strong>of</strong><br />
crystallisation times, needs to be integrated over the residence time for each<br />
particle in the dryer. In effect, this procedure treats the WLF equation (24) as<br />
representing the inverse <strong>of</strong> a rate equation for crystallisation, where the<br />
inverse <strong>of</strong> the ratio is equivalent to a relative rate for crystallisation, and the<br />
inverse <strong>of</strong> the ratio is integrated over the residence time <strong>of</strong> each particle in the<br />
dryer to predict the overall increase in crystallinity. It is important to note that<br />
the WLF equation (equation 24) makes no distinction between nucleation and<br />
crystal growth, meaning that it is implicitly assumed that nucleation <strong>of</strong> the<br />
material is non-rate limiting.<br />
Particle moisture<br />
content, gas<br />
humidity, kg/kg<br />
solid or gas<br />
Gas humidity, kg/kg<br />
Solids moisture content, kg/kg<br />
Distance through<br />
Figure 6<br />
Typical drying prediction form the parallel flow design equations<br />
Langrish – <strong>Spray</strong> drying and crystallization 72
3.2 Outcomes from using the simulation<br />
Figure 6 shows the typical drying prediction obtained form the parallel<br />
flow model. Chiou et al. [5][6] have found that this simulation predicted the<br />
correct trends in terms <strong>of</strong> lactose crystallinity when lactose was spray dried in<br />
a Buchi B-290 spray dryer. Islam and Langrish [2] and Islam et al. [4] have<br />
found that the simulation also predicts the correct trends when spray drying<br />
lactose, sucrose and ascorbic acid, since the order <strong>of</strong> their glass-transition<br />
temperatures (a key part <strong>of</strong> the Gordon-Taylor equation) is 101 o C for lactose,<br />
around 60-65 o C for sucrose and -50 o C for ascorbic acid. However, the<br />
simulation clearly does not allow for recirculation <strong>of</strong> particles, so its<br />
quantitative accuracy is likely to be modest.<br />
4.0 References<br />
1. Williams, M.L.; Landel, R.F.; Ferry, J.D. The temperature dependence<br />
<strong>of</strong> relaxation mechanisms in amorphous polymers and other glassforming<br />
liquids. Journal <strong>of</strong> the American Chemical Society 1955,<br />
77(14), 3701-3707.<br />
2. Islam, Md.I.; Langrish, T.A.G. Comparing the crystallization <strong>of</strong> sucrose<br />
and lactose in spray dryers. Transactions I.Chem.E., Foods and<br />
Bioproducts Engineering 2009, 87(2), 87-95.<br />
3. Migliardo, F.; Branca, C.; Magazu, S.; Migliardo, P.; Coppolino, S.;<br />
Villari, A.; Micali, N. Quasielastic and inelastic neutron scattering study<br />
<strong>of</strong> vitamin c aqueous solutions. Physica A: Statistical Mechanics and<br />
Its Applications 2002, 304(1-2), 294-298.<br />
4. Islam, Md.I.; Sherrell, R.; Langrish, T.A.G. An investigation <strong>of</strong> the<br />
relationship between glass-transition temperatures and the crystallinity<br />
<strong>of</strong> spray-dried powders. paper accepted for publication in <strong>Drying</strong><br />
<strong>Technology</strong> (accepted for publication 25 September 2009).<br />
5. Chiou, D.; Langrish, T.A.G. A comparison <strong>of</strong> crystallisation approaches<br />
in spray drying. Journal <strong>of</strong> Food Engineering 2008, 88(2), 177-185.<br />
6. Chiou, D.; Langrish, T.A.G.; Braham, R. Partial crystallisation<br />
behaviour during spray drying: simulations and experiments. <strong>Drying</strong><br />
<strong>Technology</strong> 2008, 26(1), 27-38.<br />
7. Langrish, T.A.G. Assessing the rate <strong>of</strong> solid-phase crystallization for<br />
lactose: the effect <strong>of</strong> the difference between material and glasstransition<br />
temperatures. Food Research International 2008, 41(6),<br />
630-636.<br />
8. Trivedi, P.; Axe, L. Ni and Zn sorption to amorphous versus crystalline<br />
iron oxides: macroscopic studies. Journal <strong>of</strong> Colloid and Interface<br />
Science 2001, 244(2), 221-229.<br />
9. Blagden, N.; De Matas, M.; Gavan, P.T.; York, P. Crystal engineering<br />
<strong>of</strong> active pharmaceutical ingredients to improve solubility and<br />
dissolution rates”, Advanced Drug Delivery Reviews 2007, 59(7), 617-<br />
630.<br />
Langrish – <strong>Spray</strong> drying and crystallization 73
10. Pokharkar, V.B.; Mandpe, L.P.; Padamwar, M.N.; Ambike, A.A.;<br />
Mahadik, K.R.; Paradkar, A. Development, characterization and<br />
stabilization <strong>of</strong> amorphous form <strong>of</strong> a low Tg drug. Powder <strong>Technology</strong><br />
2006, 167(1), 20-25.<br />
11. Choi, W.S.; Kim, H.I.; Kwak, S.S.; Chung, H.Y.; Chung, H.Y.;<br />
Yamamoto, K.; Oguchi, T.; Tozuka, Y.; Yonemochi, E.; Terada, K.<br />
Amorphous ultrafine particle preparation for improvement <strong>of</strong><br />
bioavailability <strong>of</strong> insoluble drugs: grinding characteristics <strong>of</strong> fine<br />
grinding mills. International Journal <strong>of</strong> Mineral Processing 2004,<br />
74(SUPPL), 165-172.<br />
12. Hancock, B.C.; Parks, M. What is the true solubility for amorphous<br />
pharmaceuticals Pharmaceutical Research 2000, 17(4), 397-404.<br />
13. Briggner, L.; Buckton, G.; Bystrom, K.; Darcy, P. The use <strong>of</strong><br />
isothermal microcalorimetry in the study <strong>of</strong> changes in crystallinity<br />
induced during the processing <strong>of</strong> powders. International Journal <strong>of</strong><br />
Pharmaceuticals 1994, 105(2), 125-135.<br />
14. Buckton, G.; Darcy, P. The influence <strong>of</strong> additives on the<br />
recrystallisation <strong>of</strong> amorphous spray dried lactose. International<br />
Journal <strong>of</strong> Pharmaceuticals 1995, 121(1), 81-87.<br />
15. Hancock, B.C.; Zografi, G. Characteristics and significance <strong>of</strong> the<br />
amorphous state in pharmaceutical systems. International Journal <strong>of</strong><br />
Pharmaceuticals 1997, 86(1), 1-12.<br />
16. Lehto, V.-P.; Tenho, M.; Vaha-Heikkila, K.; Harjunen, P.; Paallysaho,<br />
M.; Valisaari, J.; Niemela, P.; Jarvinen, K. The comparison <strong>of</strong> seven<br />
different methods to quantify the amorphous content <strong>of</strong> spray dried<br />
lactose. Powder <strong>Technology</strong> 2006, 167(2), 85-93.<br />
17. Fitzpatrick, J.J.; Barry, K.; Cerqueira, P.S.M.; Iqbal, T.; O’Neill, J.;<br />
Roos, Y.H. Effect <strong>of</strong> composition and storage conditions on the<br />
flowability <strong>of</strong> dairy powders. International Dairy Journal 2007, 17(4),<br />
383-392.<br />
18. Truong, V.; Bhandari, B.R.; Howes, T. Optimization <strong>of</strong> co-current spray<br />
drying process <strong>of</strong> sugar-rich foods. Part I - Moisture and glass<br />
transition temperature pr<strong>of</strong>ile during drying. Journal <strong>of</strong> Food<br />
Engineering 2005, 71(1), 55-65.<br />
19. Keey, R.B.; Pham, Q.T. Behaviour <strong>of</strong> spray dryers with nozzle<br />
atomizers. Chemical Engineer (London), July/August, 1976, 311, 516-<br />
521.<br />
20. Keey, R.B.; Suzuki, M. On the characteristic drying curve. Int. J. Heat<br />
Mass Transfer 1974, 17(12), 1455-1464.<br />
21. Langrish, T.A.G.; Zbicinski, I. The Effects <strong>of</strong> Air Inlet Geometry and<br />
<strong>Spray</strong> Cone Angle on the Wall Deposition Rate in <strong>Spray</strong> Dryers.<br />
Transaction <strong>of</strong> IChemE 1994, 72(A), 420-430.<br />
22. Langrish, T.A.G.; Kockel, T.K. The implementation <strong>of</strong> a characteristic<br />
drying curve for milk powder using a Computational Fluid Dynamics<br />
simulation”, Chem. Engng. J. 2001, 84(1), 69-74.<br />
23. Liou, J.K.; Bruin, S. An approximate method for the nonlinear diffusion<br />
problem with a power relation between the diffusion coefficient and<br />
concentration. 1. Computation <strong>of</strong> desorption times. 2. Computation <strong>of</strong><br />
the concentration pr<strong>of</strong>ile. Int. J. Heat Mass Transfer 1982, 25(8), 1209-<br />
1229.<br />
24. Kieviet, F.G.1997. Modelling Quality in <strong>Spray</strong> <strong>Drying</strong>”, Ph.D. Thesis,<br />
T.U. Eindhoven, The Netherlands, pp. 121-156.<br />
Langrish – <strong>Spray</strong> drying and crystallization 74
25. Adhikari, B.; Howes, T.; Bhandari, B.R.; Truong, V. Surface stickiness<br />
<strong>of</strong> drops <strong>of</strong> carbohydrate and organic acid solutions during convective<br />
drying: experiments and modelling. <strong>Drying</strong> <strong>Technology</strong> 2003, 21(5),<br />
839-873.<br />
26. Chen, X.D. Heat-mass transfer and structure formation during drying<br />
<strong>of</strong> single food droplets. <strong>Drying</strong> <strong>Technology</strong> 2004, 22(1&2), 179-190.<br />
27. Seydel, P.; Sengespeick, A.; Blömer, J.; Bertling, J. Experiment and<br />
mathematical modeling <strong>of</strong> solid formation at spray drying. Chem. Eng.<br />
Technol. 2004, 27(5), 505-510.<br />
28. Chen, X.D.; Lin, S.X.Q. Air drying <strong>of</strong> milk droplets under constant and<br />
time-dependent conditions. AIChE Journal 2005, 51(6), 1790–1799.<br />
29. Patel, K.C.; Chen, X.D. Prediction <strong>of</strong> spray-dried product quality using<br />
two simple drying kinetic models. Journal <strong>of</strong> Food Process<br />
Engineering 2005, 28(6), 567-594.<br />
30. Bhandari, B.R.; Datta, N.; Howes, T. Problems associated with spray<br />
drying <strong>of</strong> sugar-rich foods. <strong>Drying</strong> <strong>Technology</strong> 1997, 15(2), 671-684.<br />
31. Price, R.; Young, P.M. Visualization <strong>of</strong> the crystallization <strong>of</strong> lactose<br />
from the amorphous state. Journal <strong>of</strong> Pharmaceutical Sciences 2003,<br />
93(1), 155-164.<br />
32. Chan, H.-K.; Chew, N.Y.K. Novel alternative methods for the delivery<br />
<strong>of</strong> drugs for the treatment <strong>of</strong> asthma. Advanced Drug Delivery Reviews<br />
2003, 55(7), 793-805.<br />
33. King, N. The physical structure <strong>of</strong> dried milk. Dairy Science Abstracts<br />
1965, 27(3), 91-104.<br />
34. Bushill, J.H.; Wright, W.B.; Fuller, C.H.F.; Bell, A.V. The crystallization<br />
<strong>of</strong> lactose with particular reference to its occurrence in milk powder.<br />
Journal <strong>of</strong> the Science <strong>of</strong> Food and Agriculture 1965, 16(10), 622-628.<br />
35. Chiou, D.; Langrish, T.A.G. Crystallisation <strong>of</strong> amorphous components<br />
in spray-dried powders. <strong>Drying</strong> <strong>Technology</strong> 2007, 25(9), 1423-1431.<br />
36. Roos, Y.H.; Karel, M. Differential Scanning Calorimetry study <strong>of</strong> phase<br />
transitions affecting the quality <strong>of</strong> dehydrated materials. Biotechnology<br />
Progress 1990, 6(2), 159-163.<br />
37. Gordon, M.; Taylor, J.S. Ideal copolymers and the second-order<br />
transitions <strong>of</strong> synthetic rubbers. I Non-crystalline copolymers. Journal<br />
<strong>of</strong> Applied Chemistry 1952, 2(9), 493-500.<br />
38. Jouppila, K.; Roos, Y.H. Water sorption and time-dependent<br />
phenomena <strong>of</strong> milk powders. Journal <strong>of</strong> Dairy Science 1994, 77(7),<br />
1798-1808.<br />
Langrish – <strong>Spray</strong> drying and crystallization 75
Langrish – <strong>Spray</strong> drying and crystallization 76
Yoon, S.S. Lagrangian-based stochastic dilute spray modelling for drying applications -<br />
Volume 1, Ed. Woo, M.W., Mujumdar, A.S. and Daud, W.R.W., 2010, ISBN - 978-981-<br />
08-6270-1, Published in <strong>Singapore</strong>, pp. 77-112.<br />
Lagrangian-based Stochastic Dilute <strong>Spray</strong><br />
Modelling for <strong>Drying</strong> Applications<br />
Chapter 4<br />
Yoon S.S.<br />
School <strong>of</strong> Mechanical Engineering, Korea <strong>University</strong>,<br />
Anamdong, 5-Ga, Sungbukgu, Seoul, 136-713, Korea<br />
Contents<br />
Page<br />
1.0 Introduction 78<br />
2.0 Modelling description 83<br />
2.1 Particle size distribution 84<br />
2.2 <strong>Spray</strong> transport equation 85<br />
Conservation <strong>of</strong> mass and species 86<br />
Conservation <strong>of</strong> momentum 86<br />
Conservation <strong>of</strong> energy 88<br />
2.3 Evaluation <strong>of</strong> film properties 89<br />
2.4 Turbulence models 90<br />
2.5 Primary atomization 92<br />
2.6 Secondary atomization 93<br />
2.7 Binary collision model 96<br />
Coalescence-Separation Model by Ashgriz & Poo 97<br />
Bouncing Model by Estrade et al. 100<br />
Coalescence-Separation Model by O’Rourke 100<br />
Satellite Model by Munnannur and Reitz 102<br />
Post-Collision Properties for Liquid Binary Drops 103<br />
2.8 Particle-wall impact 104<br />
Bouncing 105<br />
Sliding 106<br />
Splashing 106<br />
Surface roughness 107<br />
3.0 Conclusion 107<br />
4.0 Acknowledgement 107<br />
5.0 References 107<br />
Yoon – Lagrangian modeling <strong>of</strong> dilute spray 77
1.0 Introduction<br />
<strong>Spray</strong> modeling has been a great interest in various fields <strong>of</strong> engineering,<br />
such as internal-combustion (IC) engine, pulverized coal power plant, solid<br />
rocket propellant, spray drying and cooling, ink-jet printing, crop spraying,<br />
meteorology, spray painting and coating, fire suppression, humidification,<br />
medicine inhalation and treatment devices, industrial cleaning, water<br />
treatment, and so on [1]. It is one class <strong>of</strong> the many classes <strong>of</strong> multiphase<br />
modeling that are associated with more general and wider ranges <strong>of</strong> multicomponent<br />
(both in scale and phase) flow physics. Multiphase flow, in<br />
general, implies the involvement <strong>of</strong> two or more phases, such as liquid, gas<br />
(or bubble), solid, and even electrostatic and magnetic fields.<br />
Bubble rising in a soda glass is a typical example <strong>of</strong> a (i) gas-liquid<br />
system. Pulverized coal powders for power plant applications are a typical (ii)<br />
solid-gas system. An electrostatic spray is a triple-phase system that involves<br />
liquid, gas, and electrostatics. A typical (iii) liquid-gas flow can be found in fire<br />
suppression and in IC fuel injection systems. A pneumatic pipe transport<br />
system for ocean mining applications typically involves the (iv) solid and liquid<br />
phases. A spray drying application initially involves a (v) liquid-gas system in<br />
the upstream, which later transforms into a solid-gas system due to the drying<br />
<strong>of</strong> the sprayed products, as shown in Figure 1. The spray modeling<br />
techniques reviewed in this report deal with liquid-gas or/and solid-gas<br />
systems in conjunction with (ii), (iii), and (v).<br />
Figure 1<br />
Description <strong>of</strong> the major physical processes inside a typical<br />
counter-current flow spray dryer<br />
Yoon – Lagrangian modeling <strong>of</strong> dilute spray 78
Modeling a multiphase flow poses a great computational challenge<br />
because the standardized sets <strong>of</strong> governing equations for coupled or<br />
interacting flow systems are still debatable. As for sprays, modeling the<br />
“small-scale” atomization phenomenon itself is a highly complex free-surface<br />
problem. The “large-scale” particle dynamics simulation (PDS) is possible only<br />
after receiving inputs regarding the small-scale atomization. Differences<br />
between the “small-scale” and the “larger-scale” atomization processes and<br />
their appropriate modeling are categorized in Figure 2.<br />
Figure 2<br />
Guideline for spray modelling: sub-models may vary depending<br />
on the scale and the nature <strong>of</strong> the physical processes<br />
Yoon – Lagrangian modeling <strong>of</strong> dilute spray 79
As for the small-scale phenomena, capturing the fundamental<br />
instabilities that trigger the disintegration <strong>of</strong> the exiting liquid jet, which forms<br />
millions <strong>of</strong> particles (or drops), is an extremely challenging problem, especially<br />
for a high-speed jet, and this phenomenon is known as “primary” atomization.<br />
On the other hand, the atomization mechanism <strong>of</strong> a low-speed jet, as in inkjet<br />
printing, has been well understood through numerous instability theories and<br />
modelings. [2-11]. Various computational models, such as the boundary<br />
element method (BEM) [12-21], volume <strong>of</strong> fluid (VOF) [22-28], and the levelset<br />
method (LSM) [29-30], have given successful modeling <strong>of</strong> primary<br />
atomization, as shown in Figure 3.<br />
a<br />
b<br />
Figure 3<br />
Modeling “small-scale” primary atomization using various<br />
models; (a) boundary element method [20] and (b) volume <strong>of</strong> fluid<br />
[28] . Images are re-printed under the permission <strong>of</strong> Wiley,<br />
Elsevier, and ILASS, respectively.<br />
Once particles are detached from the exiting liquid, particles travel in gas<br />
and deform because <strong>of</strong> aerodynamic drag, and eventually, they breakup, and<br />
this breakup is known as “secondary” atomization. A simple ordinary<br />
differential equation (ODE) replicating a forced harmonic oscillator describes<br />
the deformation <strong>of</strong> a particle and its eventual breakup [31]. This ODE breakup<br />
model is simple enough to be coupled with PDS. More rigorous computations<br />
have been carried out by using BEM, VOF, and LSM for modeling breakup<br />
processes [12-30]. However, these models are impractical to couple with PDS<br />
due to their inordinate computational loads.<br />
As for the large scale PDS, there are two major approaches, namely, the<br />
Eulerian-Eulerian approach and the Lagrangian-Eulerian approach. Basically,<br />
the physics <strong>of</strong> particle flow and that <strong>of</strong> the continuum gas phase, and their<br />
interaction (such as mass, momentum, and energy exchange) should be<br />
properly taken into account in modeling two-phase spray flows. Here, the<br />
continuum gas phase is always solved on an Eulerian reference frame, while<br />
the dispersed or discrete particle flow can be solved either on an Eulerian or<br />
Lagrangian frame <strong>of</strong> reference [32-38].<br />
Yoon – Lagrangian modeling <strong>of</strong> dilute spray 80
A spray system is either “dilute” or “dense,” depending on the particle<br />
number density at a fixed domain size. For example, a rule <strong>of</strong> thumb is that<br />
the spray system is dilute if the liquid phase volume is 10% or less than that <strong>of</strong><br />
gas. Generally, the Lagrangian and Eulerian approaches are preferred for<br />
dilute and dense systems, respectively, although this preference is a matter <strong>of</strong><br />
choice and not <strong>of</strong> principle. For a dilute spray system, drag and lift are the<br />
main driving force <strong>of</strong> the entire spray system. Conversely, for a dense spray<br />
system, particle collision is the main driving mechanism. To quantitatively<br />
distinguish the two systems, a dilute spray is assumed if τ v
Figure 5<br />
Lagrangian approach for dense spray inside fluidized bed. The<br />
simulation shows the effect <strong>of</strong> gas pressure Pamb=1, 10, 21, 30,<br />
and 40 bar. [40]<br />
Figure 6<br />
Fludization regime change depending on the magnitude <strong>of</strong> the<br />
fluidizing gas<br />
In this report, the Largrangian-based dilute spray modeling in a<br />
“stochastic” sense is reviewed. This means that many <strong>of</strong> the mathematical<br />
formulations are based on probability functions. This modeling method was<br />
originally pioneered by O’Rourke [43] for use in IC-engine applications and<br />
has been widely used in most commercial codes, such as KIVA, CFX, Fluent,<br />
Star-CD, etc. General descriptions <strong>of</strong> particle phase transport equations (i.e.,<br />
conservation <strong>of</strong> mass, momentum, and energy) are reviewed. Explanation on<br />
the interaction between the particle phase turbulence model and the k-ε<br />
RANS (Reynolds-Averaged Navier-Stokes) turbulence for the Eulerian phase<br />
is also provided. Various PDFs (probability density function) are introduced to<br />
model the initial particle size distribution. The actual computational load is<br />
Yoon – Lagrangian modeling <strong>of</strong> dilute spray 82
amenable with the stochastic approach that assumes “parcels,” which carry<br />
numerous particles. The difference between the parcel PDFs and particle<br />
PDFs are explicitly explained in this report. The basic mechanism <strong>of</strong> the<br />
aerodynamic breakup model <strong>of</strong> O’Rourke and Amsden [31], namely the TAB<br />
(i.e., Taylor analogy breakup) model, is provided. Within a locally-dense<br />
region, the binary collision between two particles may result in coalescence,<br />
bouncing, or separation. The collision physics <strong>of</strong> coalescence and grazing is<br />
modeled by the formulation <strong>of</strong> Brazier-Smith [44]. A general approach for the<br />
particle-wall interaction is also reviewed.<br />
t=0.5s t=1.0s t=1.5s t=2.0s t=2.5s t=3.0s<br />
Figure 7 Eulerian approach for dense spray inside fluidized bed [41]<br />
2.0 Modelling description<br />
A two-phase system can be formulated by several approaches using<br />
either space averaging [45-52] or probabilistic descriptions [43, 53-54]. The<br />
approach taken here is based on spatial or phase-averaging. The specifics <strong>of</strong><br />
phase-averaging are summarized in DesJardin and Gritzo [55]. In this<br />
approach, the governing equations <strong>of</strong> mass, momentum and energy are<br />
averaged in space by introducing additional terms that account for mass,<br />
momentum and energy transfer from the particles to the gas phase. These<br />
source terms are determined from the liquid phase transport equations, which<br />
track the dynamics <strong>of</strong> particles as they are transported in the carrier gas. The<br />
following subsections describe the modeling approaches for the Largrangian<br />
particle-phase only while details on its coupling with the Eulerian gas-phase is<br />
well described in Crowe [39].<br />
Yoon – Lagrangian modeling <strong>of</strong> dilute spray 83
2.1 Particle size distribution<br />
In computational descriptions <strong>of</strong> a particulate flow, it is usually impossible<br />
to track all <strong>of</strong> the individual particles, and thus, alternative approaches are<br />
typically employed. One approach is to track parcels [56]. In the conservation<br />
equations describing these parcels to accurately represent the evolution <strong>of</strong> all<br />
particles, the particles in a parcel generally are restricted to a fixed diameter.<br />
If the number <strong>of</strong> particles in each parcel is identical, then the size distribution<br />
<strong>of</strong> the parcel should follow the size distribution <strong>of</strong> the particles. However, it is<br />
computationally more expedient to set the mass <strong>of</strong> each parcel to be identical<br />
for all parcels. Thus, the number <strong>of</strong> particles per parcel is inversely<br />
proportional to the particle mass. Equivalently, the number <strong>of</strong> particles per<br />
parcel is proportional to D -3 where D is the diameter <strong>of</strong> the particle. In this<br />
case, the parcel distribution, f c (D), differs from the particle distribution, f p (D).<br />
3<br />
f<br />
c<br />
( D)<br />
= AD f<br />
p<br />
( D)<br />
(1)<br />
where A is a scaling factor used to properly normalize f c (D). O’Rourke<br />
[43] provides the corresponding parcel distribution for a given chi-square (χ 2 )<br />
distribution while Hewson and Yoon [57] provide the corresponding parcel<br />
distributions for the Rosin-Rammler, log-normal, and Gaussian distributions,<br />
respectively. These PDFs are summarized in Table 1, and the corresponding<br />
expressions for the size distributions <strong>of</strong> particles and parcels are listed in<br />
Table 2.<br />
Table 1<br />
The PDFs for particle and parcel for the Rosin-Rammler, lognormal,<br />
Gaussian, and Nukiyama-Tanasawa distributions.<br />
Rosin-<br />
Rammler<br />
Particle PDF, f p<br />
f<br />
p,<br />
rr<br />
q<br />
D<br />
( D)<br />
= q<br />
X<br />
−1<br />
q<br />
q<br />
⎡ ⎛ D ⎞<br />
⎥ ⎥ ⎤<br />
exp⎢−<br />
⎜ ⎟<br />
⎢⎣<br />
⎝ X ⎠ ⎦<br />
where q is the dispersion coefficient.<br />
X = D10 / Γ( 1/ q + 1)<br />
where Γ is the complete Gamma function.<br />
Log-normal<br />
2<br />
1 ⎡ ⎛ ( ln D − ln D ) ⎞⎤<br />
⎢ ⎜<br />
ln<br />
f p<br />
= −<br />
⎟<br />
,ln<br />
( D)<br />
exp<br />
⎥<br />
*<br />
* 2<br />
2πσ<br />
lnD<br />
⎢⎣<br />
⎝ 2σ<br />
ln ⎠⎥⎦<br />
where *2<br />
D = exp(ln D)<br />
= D / exp(0.5σ<br />
)<br />
Gaussian ( )<br />
Nukiyama-<br />
Tanasawa<br />
ln<br />
*<br />
σ is the dimensionless standard<br />
ln<br />
deviation <strong>of</strong> the logarithm <strong>of</strong> the diameter.<br />
2<br />
1 ⎡ D − D ⎤<br />
f<br />
p,<br />
g<br />
( D)<br />
= exp⎢−<br />
⎥<br />
2<br />
2πσ<br />
⎢⎣<br />
2σ<br />
⎥⎦<br />
where σ is the dimensional standard<br />
deviation <strong>of</strong> the diameter.<br />
D is the mean diameter.<br />
f<br />
p,<br />
nt<br />
( D)<br />
p<br />
= ant<br />
D exp<br />
10<br />
c<br />
[ − bD ]<br />
where<br />
is the normalizing<br />
( p + 1) / c<br />
cb<br />
ant<br />
=<br />
⎡ p + 1⎤<br />
Γ<br />
⎢<br />
⎣ c ⎥<br />
⎦<br />
factor. The coefficients, b, c, and p are the<br />
dimensional parameters.<br />
ln<br />
Parcel PDF, f c<br />
3<br />
fc , rr( D)<br />
= Arr<br />
D f<br />
p,<br />
rr(<br />
D)<br />
1<br />
A rr<br />
=<br />
3 ⎛ 3 ⎞<br />
X Γ⎜<br />
+ 1⎟<br />
⎝ q ⎠<br />
3<br />
fc , ln( D)<br />
= Aln<br />
D f<br />
p,<br />
ln(<br />
D)<br />
*2 1<br />
A<br />
ln<br />
= 1/ exp[ 3x<br />
+ (9/ 2) σ<br />
ln<br />
] =<br />
3<br />
* 2<br />
D exp(9σ<br />
where<br />
x = lnDln<br />
3<br />
fc , g<br />
( D)<br />
= Ag<br />
D f<br />
p,<br />
g<br />
( D)<br />
3<br />
A D = A =<br />
g<br />
*<br />
g<br />
*2<br />
a ' = exp( −0.5/<br />
σ )<br />
c'<br />
⎛<br />
erf ⎜<br />
⎝<br />
=<br />
*<br />
ln<br />
2π<br />
ln<br />
/ 2)<br />
*3 *<br />
*2<br />
( 2σ<br />
+ σ ) a'<br />
+ π / 2( 3σ<br />
+ 1)( 1+<br />
c'<br />
)<br />
1 ⎞, note erf is the error function.<br />
⎟<br />
2σ<br />
⎠<br />
*<br />
σ = σ / D<br />
where ( ) * is the dimensionless quantity.<br />
3<br />
f D)<br />
A D f ( )<br />
c , nt<br />
( =<br />
nt p,<br />
nt<br />
D<br />
A<br />
nt<br />
( p+<br />
4) / c<br />
cb<br />
=<br />
⎡ p + 4 ⎤<br />
ant<br />
Γ⎢<br />
⎥<br />
⎣ c ⎦<br />
Yoon – Lagrangian modeling <strong>of</strong> dilute spray 84
An alternative method for predicting the particle size can be suggested<br />
by utilizing the linear theories particularly the Kelvin-Helmoltz and Rayleigh-<br />
Taylor instability theories. Further details <strong>of</strong> this alternative method are<br />
provided in Section 2.3.<br />
Table 2<br />
The size distributions for particle and parcel for the Rosin-<br />
Rammler, log-normal, Gaussian, and Nukiyama-Tanasawa<br />
distributions.<br />
Rosin-<br />
Rammler<br />
Particle size<br />
1/ q<br />
⎛ ⎡ 1 ⎤⎞<br />
D = X ⎜ln<br />
⎢<br />
⎟<br />
⎝ ⎣1−<br />
RN ⎥<br />
⎦ ⎠<br />
RN is the random number ranging from 0<br />
to 1.<br />
[ ]<br />
Parcel size<br />
1/ q<br />
⎛<br />
− 1⎡3<br />
⎤⎞<br />
D = X ⎜ P 1, RN ⎟<br />
⎢ +<br />
q<br />
⎥<br />
⎝ ⎣ ⎦⎠<br />
where P -1 is the inverse <strong>of</strong> the incomplete<br />
gamma function (see Ref. [76]).<br />
[ ]<br />
*2<br />
[ + 2σ<br />
]<br />
Log-normal * −1<br />
* −1<br />
*2<br />
D=<br />
Dln<br />
exp 2σ lnerf<br />
( 2RN−1)<br />
D = Dln exp 2σ lnerf<br />
( 2RN−1)<br />
+ 3σ<br />
ln<br />
Gaussian<br />
*<br />
D = D+<br />
2σ erf( 2RN−1)<br />
Ag<br />
*<br />
2<br />
* 2<br />
RN = σ a'<br />
( 1 + 2σ<br />
) − b'<br />
( D −1)<br />
Nukiyama-<br />
Tanasawa<br />
⎧1<br />
− 1 ⎡ p + 1 ⎤⎫<br />
D = ⎨ P ,1 RN ⎬<br />
⎩b<br />
⎢<br />
−<br />
c ⎥<br />
⎣<br />
⎦⎭<br />
1/ c<br />
{ }+<br />
2π<br />
*<br />
σ<br />
*<br />
{( 2 − 2D<br />
) b'<br />
−2a'<br />
+ 2π<br />
σ ( c'<br />
+ d'<br />
)}+<br />
2<br />
3 *<br />
π<br />
3 σ<br />
* d<br />
2<br />
b'<br />
{ a ' −b'<br />
} + { c'<br />
+ '}<br />
*<br />
⎛ ( D −1)<br />
exp<br />
⎜ −<br />
*<br />
⎝ 2σ<br />
=<br />
2<br />
2<br />
⎞<br />
⎟<br />
⎠<br />
*<br />
⎛ D −1⎞<br />
d'<br />
= erf<br />
⎜<br />
⎟<br />
*<br />
⎝ 2σ<br />
⎠<br />
note: This expression is implicit that it needs to be<br />
solved iteratively. Explicit expression for the<br />
parcel size <strong>of</strong> the Gaussian distribution cannot be<br />
obtained.<br />
⎧1<br />
− 1 ⎡ p + 4 ⎤⎫<br />
D = ⎨ P ,1 RN ⎬<br />
⎩b<br />
⎢<br />
−<br />
c ⎥<br />
⎣<br />
⎦⎭<br />
1/ c<br />
2.2 <strong>Spray</strong> transport equation<br />
A stochastic separated flow (SSF) model [39] is used to represent the<br />
liquid phase <strong>of</strong> the flow. The SSF model is implemented using Lagrangian<br />
particles, which represent individual groups <strong>of</strong> particles referred to as parcels<br />
[56]. The dynamics <strong>of</strong> these particles are governed by a set <strong>of</strong> ordinary<br />
differential equation (ODE’s) accounting for the conservation <strong>of</strong> mass,<br />
momentum and energy. The derivations <strong>of</strong> these ODE’s can be found in<br />
several excellent literatures on particle transport [56,58] and so are not<br />
repeated in this report. Also, the transport equations introduced in this chapter<br />
are most suitable for a pure liquid drop, although they can indeed be applied<br />
to a solid particle or a liquid drop carrying solid particles inside. For the spray<br />
drying application, readers should be aware that a dissolved substance or<br />
agglomerates inside a liquid drop may impede the evaporation process for<br />
which the current transport equations lose some degree <strong>of</strong> accuracy.<br />
A “thin-film” assumption [58] is used to approximate the two-phase<br />
liquid-gas interface at the surface <strong>of</strong> each particle. The following subsections<br />
summarize the transport equations for evaporating particles. In these<br />
equations, the subscripts “p”, “g”, and “f” denote the properties <strong>of</strong> the particle<br />
(or drop), gas and film, respectively, as shown in Figure 8.<br />
Yoon – Lagrangian modeling <strong>of</strong> dilute spray 85
Figure 8<br />
Property variations in particle using a thin skin model<br />
Conservation <strong>of</strong> mass and species<br />
The loss <strong>of</strong> mass from evaporation <strong>of</strong> the liquid particle is described<br />
using the following transport equation:<br />
dm<br />
dt<br />
p<br />
µ<br />
= m& = −π D B Sh<br />
(2)<br />
f<br />
p p m f<br />
Sc<br />
f<br />
where m&<br />
p<br />
is the mass <strong>of</strong> the particle and ρ<br />
f<br />
and µ<br />
f<br />
are the density and<br />
dynamic viscosity <strong>of</strong> the film in thermodynamic state. The film is defined as<br />
the liquid-gas interface on the particle surface, as shown in Figure 8. The<br />
parameter, B = ( Y −Y ) /( Y − Y ) , is the Spaulding or mass transfer number<br />
m f g p f<br />
and characterizes the concentration gradients at the film interface. The<br />
Sherwood number, Sc = h D / D , accounts for evaporation due to<br />
f m p mf<br />
convection and is expressed in terms <strong>of</strong> the particle Reynolds number, and<br />
film Schmidt number, Sc = v / D using the Ranz-Marshall correction [59]:<br />
f f mf<br />
( )<br />
1/ 2 1/3<br />
Sc<br />
f<br />
= 2 ⎡<br />
⎣1 + Re<br />
p<br />
Sc<br />
f<br />
/ 3⎤<br />
⎦ log 1 + Bm / Bm<br />
. The properties at the film still need to<br />
be specified and will be discussed in the evaluation <strong>of</strong> the film’s<br />
thermophysical state in Section 2.2.<br />
Conservation <strong>of</strong> momentum<br />
The momentum equations for a small rigid sphere in non-uniform flow<br />
were derived by Maxey and Riley [60]. The momentum source terms for these<br />
equations include aerodynamic drag, static pressure gradient, virtual-mass,<br />
Basset, Saffman lift and body forces [61]. The full unsteady momentum<br />
equation for non-rotating, non-interactive, non-deforming, spherical liquid or<br />
solid particles [60], is<br />
Yoon – Lagrangian modeling <strong>of</strong> dilute spray 86
du<br />
pi<br />
m<br />
p<br />
= FD<br />
+ F<br />
,<br />
i P<br />
+ F<br />
i A<br />
+ F<br />
i H<br />
+ F<br />
i L<br />
+ F<br />
i B<br />
(3)<br />
i<br />
dt<br />
where<br />
m<br />
p<br />
is the particle mass,<br />
u<br />
p<br />
is the particle velocity, and t is time. The<br />
i<br />
forces on the right-hand side <strong>of</strong> this equation are defined as<br />
F<br />
F<br />
F<br />
Di<br />
F<br />
Pi<br />
Ai<br />
Hi<br />
F<br />
F<br />
Li<br />
Bi<br />
π<br />
= C<br />
4<br />
H<br />
= 2.72D<br />
π<br />
= D<br />
6<br />
3<br />
p<br />
D<br />
2<br />
p<br />
2<br />
p<br />
0<br />
( S S )<br />
( u − u )<br />
π 2<br />
= ρgDpCD<br />
ug<br />
− u<br />
(Aerodynamic Drag)<br />
i pi<br />
gi<br />
pi<br />
8<br />
π Du<br />
3 gi<br />
= ρgDp<br />
(Pressure Gradient)<br />
6 Dt<br />
π Du<br />
3⎛<br />
g<br />
du<br />
i p ⎞<br />
i<br />
= C<br />
Aρg<br />
Dp<br />
(Added Mass)<br />
6<br />
⎜ −<br />
Dt dt<br />
⎟<br />
⎝<br />
⎠<br />
( u − u )<br />
( u − u )<br />
( ρ − ρ ) g δ (Body Force),<br />
p<br />
ρ µ<br />
g<br />
g<br />
π<br />
ρ µ<br />
g<br />
g<br />
g<br />
t<br />
∫<br />
j<br />
d<br />
dτ<br />
lk<br />
ij<br />
S<br />
gi<br />
t − τ<br />
ij<br />
1/ 4<br />
kl<br />
pi<br />
g j<br />
dτ<br />
p j<br />
(History)<br />
(Saffman Lift)<br />
(4)<br />
where<br />
ρ<br />
g<br />
,<br />
D<br />
p<br />
, and<br />
µ<br />
g<br />
, and<br />
gi<br />
u are the gas density, viscosity, and velocity, and<br />
ρ<br />
p<br />
,<br />
u<br />
p<br />
are the particle density, diameter, and velocity, respectively.<br />
i<br />
g<br />
j<br />
and the local carrier gas strain<br />
1<br />
S = ∂u<br />
/ ∂x<br />
+ ∂u<br />
/ ∂x<br />
. Additionally, the two<br />
Gravitational acceleration is represented by<br />
rate tensor is defined as ( )<br />
ij<br />
2<br />
substantial derivatives <strong>of</strong> the gas velocity in these expressions are defined as<br />
i<br />
j<br />
j<br />
i<br />
Du<br />
Dt<br />
du<br />
dt<br />
gi<br />
gi<br />
∂u<br />
=<br />
∂t<br />
gi<br />
∂u<br />
=<br />
∂t<br />
gi<br />
+ u<br />
+ u<br />
g j<br />
p j<br />
∂u<br />
∂x<br />
∂u<br />
gi<br />
gi<br />
∂x<br />
j<br />
j<br />
.<br />
(5)<br />
The original equation developed in Ref. [60] is only formally correct in the<br />
limit <strong>of</strong> zero particle Reynolds number, Re = ρ u − u D / . The additional<br />
p<br />
g<br />
g p p<br />
µ<br />
i i g<br />
coefficients C<br />
D<br />
, C<br />
A<br />
, and C<br />
H<br />
in Eqs. (6) are added to adjust the respective<br />
terms for finite Reynolds numbers [62]. The coefficient <strong>of</strong> drag, C<br />
D<br />
, is<br />
modeled using the standard drag coefficient relations for a sphere in uniform<br />
flow [58-60],<br />
C D<br />
2/3<br />
⎧ 24 ⎛ Re ⎞ 1<br />
p<br />
⎪ + for Re<br />
p<br />
< 1000<br />
= ⎨Re ⎜<br />
p<br />
6 ⎟<br />
⎝ ⎠<br />
⎪<br />
⎩0.424 for Rep<br />
≥1000<br />
(6)<br />
Yoon – Lagrangian modeling <strong>of</strong> dilute spray 87
More sophisticated treatments could be pursued to account for non-spherical<br />
particles [63-66].<br />
When using the SSF model, the particle locations change according to a<br />
force balance, the Newton’s second law, with the resultant leading to particle<br />
acceleration [60]. The full particle momentum equation contains a number <strong>of</strong><br />
terms that can be categorized as either steady force or unsteady force. The<br />
unsteady forces approaches zero for a particle in a stationary flow field, but<br />
still <strong>of</strong>ten remain small with respect to the steady forces in commonlyencountered<br />
unsteady flows. For this reason, the unsteady terms are <strong>of</strong>ten<br />
safely neglected in particle simulations since they can be complex and<br />
computationally expensive to calculate. Therefore, as discussed by Faeth<br />
[58], if the ratio <strong>of</strong> particle to gas densities is large ( ρ / ρ 200 ), then the<br />
predominate forces consist <strong>of</strong> only the drag,<br />
F<br />
D j<br />
p<br />
, and body forces,<br />
g<br />
F<br />
B j<br />
, and<br />
this condition leads to a considerable simplification <strong>of</strong> the momentum<br />
equations to the form below:<br />
du<br />
p j<br />
π 2<br />
mp = FD ( )<br />
j<br />
+ Fb j<br />
= ρ<br />
g<br />
DpCD ug j<br />
− u<br />
p<br />
u<br />
j g<br />
u<br />
j<br />
−<br />
p<br />
g<br />
j<br />
+<br />
jmp<br />
(7)<br />
dt<br />
8<br />
where<br />
u<br />
p i<br />
and<br />
ug j<br />
are the particle and gas phase velocities, D<br />
p<br />
, is the particle<br />
diameter, and ρ<br />
g is the gas phase density. The last term on the right hand<br />
side is the body force term due to gravity.<br />
Conservation <strong>of</strong> energy<br />
The particle energy, in terms <strong>of</strong> particle temperature, T<br />
p<br />
, is related to the<br />
heat transfer due to convection ( Q & c<br />
) and evaporation ( Q & e<br />
) processes and has<br />
the form:<br />
dT<br />
µ<br />
f<br />
C<br />
p<br />
p f<br />
mpCv = Q & ( )<br />
p<br />
c<br />
+ Q & e<br />
= π Dp Tg − Tp Nu<br />
f<br />
+ mphlg<br />
dt<br />
Pr<br />
& (8)<br />
f<br />
where C<br />
v p<br />
is the liquid particle specific heat, h<br />
lg , is the heat <strong>of</strong> vaporization<br />
and Pr = C µ / k is the film’s Prandtl number. The thermal transfer number,<br />
f p f f f<br />
B = C ( T − T ) / h , characterizes the temperature gradient at the film<br />
t p f g f l g<br />
surface and can be expressed in terms <strong>of</strong> the Spaulding number under<br />
Le<br />
steady-state heat and mass transfer conditions as: B = (1 + B )<br />
f<br />
− 1, where<br />
Le = Sc / Pr = k /( ρ C D ) is the film’s Lewis number [67]. The film’s<br />
f f f f f p f m f<br />
Nusselt number, ( Nu = h D / k ), characterizes the heat transfer due<br />
f p p f<br />
convection and is modeled similar to the Sherwood number as:<br />
1/ 2 1/3<br />
Nu = 2 1+ Re Sc / 3 log 1 + B / B .<br />
( ) ( )<br />
f p f m m<br />
t<br />
m<br />
Yoon – Lagrangian modeling <strong>of</strong> dilute spray 88
2.3 Evaluation <strong>of</strong> film properties<br />
In order to account for the mass and momentum <strong>of</strong> a particle and the<br />
heat exchange between the gas and the evaporating single particle (or drop)<br />
as in Eqs. (2)-(8), the film properties <strong>of</strong> species A in conjunction with Figure<br />
8 should be estimated. Drop evaporation always occurs in spray drying<br />
applications when the relative humidity is less than unity; evaporation takes<br />
place if the saturation pressure <strong>of</strong> a liquid drop is greater than the vapor<br />
pressure <strong>of</strong> the environment. To increase the evaporation rate, one may heat<br />
up the sprayed drops so that their saturation temperature increases, which in<br />
turn also increases the saturation pressure and decreases the relative<br />
humidity.<br />
During the evaporation process <strong>of</strong> a single liquid particle, liquid mass is<br />
evaporated from the surface and diffuses as a vapor or film, properties <strong>of</strong><br />
which can be found by utilizing the Spalding’s thin-skin (or film) model [67].<br />
The mass flux balance <strong>of</strong> the model assumes that the total gaseous Mass<br />
Flux <strong>of</strong> Fuel Species (MFFS) leaving the particle surface is equal to the sum<br />
<strong>of</strong> MFFS due to the bulk velocity <strong>of</strong> the mixture at the surface and MFFS due<br />
to mass diffusion. In addition, the basic assumptions <strong>of</strong> this thin-skin model<br />
are as follows: (i) the particle regression process is relatively slow; (ii) uniform<br />
temperature distribution exists around and within the particle surface; (iii) both<br />
particle and vapor are spherical in shape; (iv) the internal circulation, such as<br />
the Hill’s vortex, within the particle is neglected; and (v) a complete saturation<br />
condition exists at the film. From Figure 8, the temperature and species<br />
distributions in and around the particle are broken into three regions. These<br />
regions consist <strong>of</strong> the temperature and species conditions at the particle<br />
center ( Y , T ), at the film interface or particle surface ( Y , Y , T ) , and in the<br />
Ap<br />
p<br />
Af<br />
Bf<br />
f<br />
surrounding gas ( Y , Y , T ) . Using this thin-skin model, along with the<br />
Ag<br />
Bg<br />
g<br />
assumption <strong>of</strong> the Clausius-Clapeyron relation to describe the change in<br />
saturation conditions, an iterative procedure can be devised to determine the<br />
film’s thermophysical properties as follows:<br />
1. Guess an initial value for<br />
Y<br />
A f<br />
2. Determine mass (Spaulding) and thermal transfer numbers:<br />
Le<br />
B = ( Y −Y ) /( Y −Y<br />
) and B = (1 + B )<br />
f<br />
− 1.<br />
m Af Ag Ad Af<br />
t<br />
3. Calculate film temperature assuming saturation conditions:<br />
T = T − B h C .<br />
f g t lg<br />
/<br />
A pA f<br />
4. Calculate the heat <strong>of</strong> vaporization using the relation from Watson [68-<br />
69]:<br />
0.38<br />
hlg = hlg = [( T )/( )]<br />
A A C<br />
−T A f<br />
TC −T<br />
A ref where T<br />
C is the critical temperature<br />
A<br />
ref<br />
for species A and<br />
hlg Aref<br />
m<br />
is a user specified reference heat <strong>of</strong><br />
vaporization for species A at a given reference temperature, T<br />
ref<br />
, and<br />
partial pressure P<br />
A ref<br />
.<br />
5. Calculate saturation partial pressure using the Clausius-Clapeyron<br />
relation:<br />
Yoon – Lagrangian modeling <strong>of</strong> dilute spray 89
⎛⎛<br />
1 1 ⎞<br />
ln( P / P ) = −h −<br />
/ R<br />
⎜⎜<br />
⎟<br />
⎝⎝<br />
⎠<br />
species A.<br />
Note: If P > P , then<br />
Af Aref lg A<br />
A<br />
Tf<br />
Tref<br />
A f<br />
⎞<br />
where<br />
⎟<br />
⎠<br />
R<br />
A<br />
is the gas constant for<br />
PA f<br />
is set equal to P and iterate using Clausius-<br />
Clapeyron and Watson relations to find T<br />
f , i.e., the fluid is boiling at<br />
the particle surface.<br />
6. Recalculate species mass fraction using partial pressures:<br />
PA<br />
f MW<br />
⎡ Y<br />
A<br />
A<br />
1−Y<br />
f<br />
A ⎤<br />
f<br />
YA<br />
= where MW<br />
f<br />
mix<br />
= +<br />
f<br />
P MWmix<br />
⎢ MW<br />
f<br />
⎣ A<br />
MWB<br />
⎥⎦<br />
7. Compare the calculated from step 6 with the guessed value from<br />
YA f<br />
step 1. And repeat steps 1-6 using the Newton-Raphson-Secant<br />
iteration until convergence.<br />
8. Once convergence is achieved, then calculate the mixture film surface<br />
density:<br />
⎛ PA<br />
f P − P ⎞<br />
A<br />
ρmix<br />
= +<br />
/ T<br />
f<br />
f<br />
.<br />
⎜ RA<br />
R ⎟<br />
⎝<br />
B ⎠<br />
−1<br />
2.4 Turbulence model<br />
For a particle-laden flow, the intrinsic characteristics <strong>of</strong> a two-phase flow<br />
(such as particle inertia, dissipation due to particle drag, effective viscosity,<br />
velocity fluctuation due to wake dynamics and self-induced vortex shedding,<br />
instabilities arising from shear and density gradients) cause turbulence. As to<br />
which characteristic is dominant is contingent on the relative strengths and<br />
scales (both in length and time) <strong>of</strong> the individual mechanisms. Whatever the<br />
reason, once turbulence exists, its effect on the dispersion <strong>of</strong> a parcel<br />
containing numerous particles should be properly taken into account.<br />
However, the time-averaged solution from RANS formulations for the gas<br />
phase lacks information regarding phenomenological details <strong>of</strong> turbulence<br />
because the solution is time-averaged and not instantaneously recorded.<br />
These unresolved turbulent motions are especially significant for the release<br />
<strong>of</strong> a high pressure spray that generates high levels <strong>of</strong> turbulent kinetic energy.<br />
Thus, turbulence models should be introduced in the course <strong>of</strong> particle<br />
trajectories to account for the unresolved turbulent eddies or local fluctuations<br />
in the velocity field and thus to mimics the particle dispersion while the rest <strong>of</strong><br />
the thermo-physical variables are set equal to their corresponding timeaveraged<br />
information.<br />
There are a few well-known approaches which model the particle<br />
dispersion phenomenon arising from turbulence. The eddy lifetime (τ e )<br />
approach has been widely used in many Lagrangian-based particle<br />
turbulence dispersion models [70-73] because <strong>of</strong> its simplicity. This eddy<br />
lifetime approach assumes that particles are responsive only to the low<br />
frequency fluctuation <strong>of</strong> the turbulent eddies. Another approach by Blumcke<br />
[74] introduces velocity fluctuations with the aid <strong>of</strong> the explicitly specified autocorrelation<br />
functions, R(τ) and R(∆x), which are also the functions <strong>of</strong> integral<br />
Yoon – Lagrangian modeling <strong>of</strong> dilute spray 90
scales such as eddy lifetime and characteristic length-scale [75]. This autocorrelation<br />
approach requires the use <strong>of</strong> a digital filter that estimates the<br />
fluctuation quantities via a random generator. The approach by Berlemont et<br />
al. [32] differs from the eddy lifetime approach in that the suggested model<br />
explicitly introduces any shape (whether it is linear or exponential) <strong>of</strong> the<br />
Lagrangian time correlation function by using their correlation matrix<br />
technique. Here, in this report, the “eddy lifetime” is reviewed because <strong>of</strong> its<br />
simplicity and popularity.<br />
The parcel turbulence model accounts for the effects <strong>of</strong> turbulent<br />
eddies perturbing the parcel trajectory and is based on the random walk<br />
model <strong>of</strong> Gosman and Ioannides [70], as modified by Shuen et al. [71]. The<br />
model assumes a Gaussian probability density function (PDF) for isotropic<br />
gas phase fluctuations that are parameterized by a zero mean and a variance<br />
that is proportional to the kinetic energy,<br />
PDF<br />
1 ⎛ u′<br />
⎞<br />
= exp<br />
−<br />
2πσ<br />
⎜<br />
2σ<br />
⎟<br />
⎝ ⎠<br />
g j<br />
u ′ g 2<br />
2<br />
j<br />
(9)<br />
which can be integrated and randomly sampled for each velocity component<br />
using the expression,<br />
u erf RN<br />
−1<br />
'<br />
g j<br />
= 2 σ (2 −1)<br />
(10)<br />
where the RMS is set equal to σ = 2 k / 3 and RN is a random number<br />
between 0 and 1. The sampled fluctuating velocities are used to determine<br />
one <strong>of</strong> two outcome events. First, the particle is light enough to be captured<br />
by the turbulent eddy and transported as a fluid particle over a time period<br />
equal to the eddy lifetime. Second, the particle has sufficient momentum to<br />
follow a ballistic trajectory and cross the eddy. The total time the particle<br />
interacts with the turbulent eddy (whose lifetime is τ<br />
eddy<br />
) and the particle cross<br />
trajectory time ( τ drift<br />
) are the minimum <strong>of</strong> τ drift and τ eddy , as indicated below<br />
[71]:<br />
( drift eddy )<br />
τ = min τ , τ<br />
τ<br />
τ<br />
eddy<br />
drift<br />
3 3/ 4 k k<br />
= Cµ<br />
or CT<br />
2 ε ε<br />
⎛<br />
L<br />
⎞<br />
e<br />
= −τ<br />
p<br />
ln ⎜1−<br />
uur uur ⎟<br />
⎜ τ<br />
p<br />
u′′ p<br />
− u′′<br />
⎟<br />
⎝<br />
g<br />
⎠<br />
(11)<br />
where L<br />
e<br />
is the characteristic turbulent eddy length-scale, τ<br />
p<br />
is the particle<br />
uur r uur<br />
response time obtained by linearizing the Eq. (3), u′′ g<br />
= u g + u′<br />
g<br />
is the<br />
uur uur<br />
instantaneous gas velocity, and the u′′ p<br />
− u′′<br />
g is the velocity at the start <strong>of</strong> the<br />
interaction. They are defined as below:<br />
Yoon – Lagrangian modeling <strong>of</strong> dilute spray 91
3/2 3/2<br />
3/4 k 2 k<br />
µ<br />
or<br />
T<br />
L = e<br />
C C<br />
ε 3 ε<br />
(12)<br />
4 ρg<br />
Dp<br />
τ<br />
p<br />
= uur uur<br />
3 ρ C u′′ − u′′<br />
p D p g<br />
This turbulence time scale (τ) is used to determine the time step required<br />
to resolve the turbulence effect within the particle sub-cycling time marching<br />
uur uur<br />
steps. When Le > τ<br />
p<br />
u′′ p<br />
− u′′<br />
g , the characteristic eddy length is greater than the<br />
particle travel distance (i.e., the Stokes number is less than unity), implying<br />
that the eddy has captured the particle and the particle residence time in the<br />
eddy is equal to the eddy’s lifetime and, thus, the particle time step can be set<br />
uur uur<br />
equal to the eddy lifetime; ∆ t<br />
p<br />
= τ<br />
eddy<br />
. If Le < τ<br />
p<br />
u′′ p<br />
− u′′<br />
g , then a particle crosses<br />
the turbulent eddy and therefore Eq. (11) should be applied;<br />
∆ t = τ = min τ , τ .<br />
( )<br />
p drift eddy<br />
Disintegration <strong>of</strong> a liquid jet emanating from a nozzle exit is attributed to<br />
several instability sources such as turbulence [76], cavitation [77], boundary<br />
layer instability [18,78,79], shear-driven KH-type instability [80], and buoyancy<br />
RT-type instability [81]. Among these, the KH-type instability is the most<br />
common one employed in spray modeling simply because it is believed that<br />
the shear instability between the emanating jet and the surrounding gas is the<br />
dominant destabilization source for primary atomization. The instability arises<br />
because <strong>of</strong> the relative velocity between a liquid jet and surrounding air. In the<br />
case <strong>of</strong> the RT instability, the wave growth rate is zero if the density <strong>of</strong> two<br />
fluids is identical; i.e., ρl = ρg<br />
, in which case the jet is unconditionally stable<br />
and there is no wave formation.<br />
The drop size prediction by the KH theory is modified by an empirical<br />
constant that yields the initial drop size (D p ) and breakup time (τ KH ) as below<br />
[80]:<br />
D<br />
τ<br />
p<br />
KH<br />
= 9λ<br />
KH<br />
= 3.726 (40) a<br />
ω λ<br />
(13)<br />
r,<br />
KH<br />
KH<br />
where ω<br />
r,<br />
KH<br />
is the growth rate <strong>of</strong> the most unstable wave whose length is<br />
. The nozzle or jet radius is d nozz /2=a.<br />
λ<br />
KH<br />
2.5 Primary atomization<br />
ω<br />
0.34 + 0.38We<br />
3<br />
1.5<br />
⎛ ρla<br />
⎞ g<br />
r, KH ⎜ 0.5 ⎟ =<br />
0.6<br />
σ<br />
l<br />
⎝<br />
⎠ ( 1+ Z )( 1+<br />
1.4T<br />
)<br />
0.5 0.7<br />
( 1 0.45Z<br />
)( 1 0.4T<br />
)<br />
0.6<br />
1.67<br />
( 1+<br />
0.87Weg<br />
)<br />
λ + +<br />
KH<br />
= 9.02<br />
a<br />
(14)<br />
Yoon – Lagrangian modeling <strong>of</strong> dilute spray 92
where<br />
Z = We 0.5 l<br />
/ Re l<br />
,<br />
0.5<br />
T = ZWe g<br />
,<br />
We<br />
2<br />
l<br />
= ρlurela<br />
/ σ<br />
l<br />
Weg l<br />
= We ε , ε = ρ / ρ ,<br />
Re<br />
l<br />
= urela / ν<br />
l<br />
. One may consider using the RT theory if the jet system is<br />
dominated by buoyancy, for which acceleration <strong>of</strong> the light fluid toward the<br />
heavy fluid plays a key role in causing atomization [81]:<br />
D<br />
τ<br />
p<br />
KH<br />
2π<br />
= λRT<br />
= ( 1.5)<br />
(15)<br />
kRT<br />
8<br />
=<br />
ω<br />
Where<br />
k<br />
ω<br />
RT<br />
r,<br />
RT<br />
r,<br />
RT<br />
( ρ − ρ )<br />
ac l g<br />
= (16)<br />
3σ<br />
=<br />
2<br />
l<br />
3 3σ<br />
l<br />
( − )<br />
( ρl<br />
− ρg<br />
)<br />
⎡ac ρl ρ ⎤<br />
⎣<br />
g ⎦<br />
1.5<br />
where a c is the acceleration <strong>of</strong> the interface from a light fluid (i.e., gas) to a<br />
heavy fluid (i.e., liquid).<br />
g<br />
l<br />
2.6 Secondary atomization<br />
As a drop moves through a gas, the pressure gradient causes its<br />
spherical shape to change and distort. As the distortion continues, the drop<br />
becomes an ellipsoid, or disk-shaped, until an upper limit is reached and<br />
breakup begins. This distortion plays a significant role in altering the drop’s<br />
drag and drag coefficient as well as being the precursor to breakup.<br />
Neglecting deformation can lead to erroneously low drag and thus, incorrect<br />
drop trajectories.<br />
Many models for this drop-breakup process are in use today, such as the<br />
Taylor analogy breakup (TAB) and drop deformation and breakup (DDB), and<br />
Clark models. Their breakup models are based on an analogy to a springmass<br />
system. The surface tension and gas aerodynamic forces are<br />
analogous to the resorting force <strong>of</strong> the spring and the external force on the<br />
mass, respectively. The liquid viscosity acts as the damping force. Other<br />
existing models <strong>of</strong> particle breakup include the wave breakup model <strong>of</strong> Reitz<br />
et al. [80,82], the Taylor Analogy Model (TAB) <strong>of</strong> O’Rourke and Amsden [31]<br />
and the extensions [83] and the stochastic spectral relaxation model <strong>of</strong><br />
Gorokhavski et al. [84-85]. Here the breakup models <strong>of</strong> TAB, DDB, and Clark<br />
are reviewed. The second order ordinary governing equation for the TAB<br />
model can be written as:<br />
Yoon – Lagrangian modeling <strong>of</strong> dilute spray 93
ρ u − u C σ C µ dy<br />
m = m − m y − m<br />
(17)<br />
dt C r r r dt<br />
2<br />
d y C<br />
p j g<br />
F g j<br />
k d l<br />
p 2 p 2 p 3 p 2<br />
b<br />
ρl eq<br />
ρl eq<br />
ρl eq<br />
where ρ<br />
l<br />
, µ<br />
l<br />
and σ are the liquid particle density, viscosity and surface<br />
tension, respectively. The model constants, which are calibrated by combining<br />
theoretical considerations on particle oscillation frequencies with experimental<br />
data, have the values <strong>of</strong> C F =1/3, C b =1/2, C k =8 and C d =5 [86]. The left-handside<br />
<strong>of</strong> Eq. (17) represents the inertial term. The first, second, and third terms<br />
in the right-hand-side represent the driving force, spring, and damper terms,<br />
respectively. Equation (17) can also be re-written into the following form:<br />
K<br />
2<br />
d y N dy<br />
2<br />
dt<br />
eq<br />
dt Weeq<br />
5 8 2<br />
+ + y = (18)<br />
Re 3<br />
where K and N are the are the liquid-to-gas ratio <strong>of</strong> density and dynamic<br />
viscosity ratio; i.e., K = ρ / ρ , and N = µ / µ , respectively. The Reynolds<br />
l<br />
g<br />
and Weber numbers are defined as: Re = u r / ν and We<br />
l<br />
g<br />
eq rel eq g<br />
= ρ u r / σ ,<br />
2<br />
eq g rel eq<br />
where r eq and σ are the spherical drop’s initial (or equilibrium) radius and<br />
surface tension. The dimensionless displacement, y, is defined as:<br />
y = ∆r / r or ( r − r ) / r , as measured from the equilibrium edge to the edge<br />
p eq p eq eq<br />
<strong>of</strong> the elongated displacement (resulted from drag) in the major axis, as<br />
shown in Figure 9. The TAB model assumes that the breakup occurs if and<br />
only if the amplitudes <strong>of</strong> oscillation <strong>of</strong> the north and south poles equal the drop<br />
radius, yielding C b =1/2 in Eq. (17).<br />
Clark [87] re-defined the dimensionless displacement, y, with respect to<br />
the displacement <strong>of</strong> the center <strong>of</strong> mass <strong>of</strong> the half drop, r cm , instead <strong>of</strong> the<br />
equilibrium radius, r eq . Clark’s linearized model for the drop oscillation<br />
phenomenon is:<br />
( K 1)<br />
( N )<br />
2 2<br />
2<br />
d y 9π<br />
+ 1 dy 9π<br />
⎛ 4 ⎞ 2<br />
+ + + ⎜ y − ⎟ =<br />
4 Re 4 ⎝ 3π<br />
⎠ π<br />
2<br />
dt<br />
eq<br />
dt Weeq<br />
(19)<br />
Ibrahim [83] also suggested a nonlinear breakup model, known as DDB,<br />
which was derived under the assumption that the drop kinetic energy and<br />
viscous dissipation are negligible as the drop approaches to the breakup<br />
mode. The nonlinear ordinary differential equation for the DDB model is:<br />
2 2<br />
−6<br />
d y 4N 1 dy 27π<br />
⎧⎪<br />
⎛ 3π<br />
⎞ ⎫⎪<br />
3<br />
K + + y 1 2 y<br />
2 2<br />
⎨ − ⎜ ⎟ ⎬ =<br />
dt Reeq<br />
y dt 16We<br />
eq ⎪⎩<br />
⎝ 4 ⎠ ⎪⎭<br />
8<br />
(20)<br />
which needs to be solved numerically because <strong>of</strong> its nonlinear form. The<br />
fourth order Runge-Kutta method can be applied to solve this nonlinear<br />
differential equation <strong>of</strong> the DDB model. The analytic solution <strong>of</strong> both TAB and<br />
Clark’s models can be obtained because they are linear differential equations.<br />
Here, to further investigate the details <strong>of</strong> the TAB model (for the reason <strong>of</strong> its<br />
popularity), the analytical solution to Eq. (17) is that <strong>of</strong> a simple harmonic<br />
Yoon – Lagrangian modeling <strong>of</strong> dilute spray 94
oscillator where y and y& at time t are advanced to t +∆ t using the following<br />
relations [86].<br />
Weeq ⎧⎪<br />
⎛ Weeq ⎞ 1 ⎛ y( t) −Weeq<br />
/ C ⎞ ⎫⎪<br />
⎛ ∆t<br />
⎞<br />
y ( t + ∆ t)<br />
= + ⎨⎜<br />
y( t) − ⎟cos( ωt) + ⎜ y&<br />
( t) + ⎟sin( ω∆t) ⎬exp⎜ − ⎟<br />
C ⎩⎪<br />
⎝ C ⎠ ω ⎝ τ<br />
b ⎠ ⎭⎪<br />
⎝ τ<br />
b ⎠<br />
(21)<br />
Weeq / C − y( t) ⎧⎪<br />
1 ⎛ y( t) −Weeq / C ⎞ ⎛ Weeq<br />
⎞ ⎫⎪<br />
⎛ ∆t<br />
⎞<br />
y& ( t + ∆ t)<br />
= + ⎨ ⎜ y&<br />
( t) + ⎟cos( ω∆t) − ⎜ y( t) − ⎟sin( ω∆t) ⎬ω<br />
exp ⎜ − ⎟<br />
τ<br />
b ⎩⎪<br />
ω ⎝ τ<br />
b ⎠ ⎝ C ⎠ ⎭⎪<br />
⎝ τ<br />
b ⎠<br />
(22)<br />
In Eqs. (21) and (22), C = C C / C = 12 is a grouping <strong>of</strong> the TAB modeling<br />
constants,<br />
2<br />
b<br />
2<br />
lreq /( Cd l<br />
)<br />
k b F<br />
τ = ρ µ is the particle oscillation relaxation time, and<br />
ω = C σ /( ρ r ) − (1/ τ ) is the particle oscillation frequency. It should be<br />
3 2<br />
k l b<br />
noted that, in the O’Rourke and Amsden’s original paper, there is a<br />
typographical error; y( t ) and y& ( t)<br />
in the cos( ω∆ t)<br />
term from Eq. (22) are<br />
incorrectly switched in their original paper, but are corrected in this report.<br />
The implementation details <strong>of</strong> Eqs. (21) and (22) are provided in Ref. [86]<br />
and expanded on here for additional clarify. The numerical procedure consists<br />
2<br />
<strong>of</strong> first calculating the value <strong>of</strong> ω . For very small particles, ω < 0 and<br />
distortions in the particle are negligible. For this case, y( t +∆ t)<br />
and y&<br />
( t +∆t)<br />
2<br />
are simply set equal to zero. When ω > 0 , the oscillation amplitude <strong>of</strong> the undamped<br />
oscillation is first determined using the relation:<br />
( ( )<br />
eq<br />
/ ) ( ( ) / )<br />
2 2<br />
A = y t − We C + y& t ω (i.e., assume τ<br />
b<br />
→ ∞ and add the squares <strong>of</strong><br />
the factors in front <strong>of</strong> the sine and cosine terms <strong>of</strong> Eq. (21)). If A + We / C < 1,<br />
then the amplitude <strong>of</strong> the disturbance cannot cause particle breakup over a<br />
time period, t +∆ t ; that is, set y( t +∆ t)<br />
=1 in Eq. (21), allow τ<br />
b<br />
→ ∞ , and then<br />
combine the sine and cosine terms into a single cosine term with phase, Φ,<br />
y( t + ∆ t) = We / C + Acos<br />
ω∆ t + Φ . In this case, Eqs. (21) and (22) are<br />
as: ( )<br />
eq<br />
used to update the values <strong>of</strong> y and y& for the current time step. If<br />
A+ We / C > 1, then breakup is possible and the breakup time, t<br />
bu<br />
, is<br />
determined by solving for the smallest root <strong>of</strong> the equation:<br />
We / C + Acos ω∆ t + Φ = 1, where Φ is determined from the relations:<br />
eq<br />
( )<br />
( eq )<br />
cos( Φ ) = y( t) − We / C / A and sin( Φ ) = − y& ( t)/( ) [86]. If ∆ t < tbu<br />
, then no<br />
breakup occurs and y and y& are updated. If t bu<br />
Aω<br />
< ∆ t , then breakup occurs, as<br />
illustrated in Figure 9, with the size and number <strong>of</strong> the newly formed particles<br />
determined from mass and energy conservation principles [31].<br />
eq<br />
Yoon – Lagrangian modeling <strong>of</strong> dilute spray 95
3<br />
⎛ 8K<br />
ρlr( t)<br />
6K<br />
− 5<br />
rp<br />
( t + ∆ t) = rp<br />
( t) ⎜1+ +<br />
y&<br />
⎝ 20 σ 120<br />
⎡ rp<br />
( t)<br />
⎤<br />
np<br />
( t + ∆ t)<br />
= ⎢ ⎥<br />
⎢⎣<br />
rp<br />
( t + ∆t)<br />
⎥⎦<br />
3<br />
2<br />
⎞<br />
⎟<br />
⎠<br />
−1<br />
(23)<br />
The model constant K in Eq. (23) represents the ratio <strong>of</strong> the total energy in<br />
the distorted particle to the particle oscillation energy in the fundamental mode<br />
and has the value <strong>of</strong> K=10/3 [31].<br />
Figure 9<br />
Taylor analogy breakup model<br />
2.7 Binary collision model<br />
Collisions between drops can result in the following regimes: (i)<br />
bouncing, (ii) permanent coalescence, (iii) separation (or grazing), and (iv)<br />
shattering; see Figure 10. These regimes are listed in the order <strong>of</strong> increasing<br />
the relative speed between the colliding binary drops [88]. Bouncing results<br />
from the gas film trapped between two colliding drops at relatively low collision<br />
speed. Permanent coalescence occurs when two drops combine into one<br />
single drop. At relatively high collision speed, separation follows a temporary<br />
coalescence, resulting in the formation <strong>of</strong> a string <strong>of</strong> two or more drops [89].<br />
Shattering may occur at the high speed collision, resulting in the disintegration<br />
<strong>of</strong> two drops and subsequent formation <strong>of</strong> a cloud <strong>of</strong> numerous satellite drops.<br />
These aforementioned collision regimes significantly differ depending<br />
on the liquid properties; water drop binary collision is quite different from<br />
hydrocarbon binary collision. The models reviewed in this section are<br />
applicable only for the water drop collision. The model should be modified<br />
according to the collision regimes if it is to be used for the analysis <strong>of</strong> the<br />
hydrocarbon drop collision [90-91].<br />
Yoon – Lagrangian modeling <strong>of</strong> dilute spray 96
Figure 10<br />
Various collision regimes in the order <strong>of</strong> increasing the relative<br />
sped between the colliding binary drops.<br />
Coalescence-Separation Model by Ashgriz & Poo<br />
Three major collision phenomena (or regimes) are considered herein:<br />
coalescence, reflexive separation, and stretching separation. Coalescence<br />
refers to the phenomenon <strong>of</strong> two drops combining into a single drop. Reflexive<br />
separation refers to two drops combining temporarily and then repelling each<br />
other, resulting in rebounding. Stretching separation occurs at a relatively high<br />
value <strong>of</strong> the impact parameter (defined as “χ” in Figure 11(a)), at which most<br />
<strong>of</strong> the mass <strong>of</strong> the colliding drops manages to flow toward their initial<br />
trajectory direction. Because <strong>of</strong> the nature <strong>of</strong> their <strong>of</strong>f-centered collision (large<br />
value <strong>of</strong> χ), the collision triggers the spinning <strong>of</strong> both drops. The following<br />
model by Ashgriz and Poo [89] gives the criteria that distinguish one regime<br />
from another and, therefore, the status <strong>of</strong> the post-collision can be obtained<br />
analytically.<br />
To illustrate the most general scenario for a binary collision, the<br />
necessary parameters are introduced in Figure 11(a). The subscript “s” and<br />
“l” refer to small and large drops, respectively. The relative quantity is denoted<br />
with “r.” d and u are the diameters and velocities <strong>of</strong> the drops. b is the<br />
distance between the centers <strong>of</strong> the drops before the collision. β is the angle<br />
between the trajectory <strong>of</strong> the small drop and the center-to-center line. γ is the<br />
angle between the trajectory <strong>of</strong> the small drop and the relative velocity vector.<br />
χ is the impact parameter, the projection <strong>of</strong> the separation distance between<br />
the droplet center in the direction normal to that <strong>of</strong> u, or χ can be thought <strong>of</strong> as<br />
the distance from the center <strong>of</strong> one drop to the relative velocity vector placed<br />
on the center <strong>of</strong> the other drop. B is the dimensionless impact parameter. The<br />
relative velocity <strong>of</strong> the two colliding drops is:<br />
u = u + u − 2u u cosα<br />
(24)<br />
2 2<br />
r l s l s<br />
Yoon – Lagrangian modeling <strong>of</strong> dilute spray 97
Where<br />
2χ<br />
2bsin<br />
β −γ<br />
B = = d + d d + d<br />
l s l s<br />
⎛ −1<br />
u ⎞<br />
l<br />
γ = sin ⎜ sinα<br />
⎟<br />
⎝ ur<br />
⎠<br />
(25)<br />
As B approaches zero, head-on collision occurs, and as B approaches unity,<br />
grazing or <strong>of</strong>f-centered collision occurs. A small value <strong>of</strong> B results in reflexive<br />
separation and a large value <strong>of</strong> B results in stretching separation. If B<br />
exceeds unity, two drops pass by and not collide. Thus the range <strong>of</strong> B is 0 ≤ B<br />
≤ 1.<br />
(a)<br />
(b)<br />
Figure 11<br />
(a) Schematic <strong>of</strong> the colliding binary drops. (b) Schematic <strong>of</strong><br />
bouncing binary drops.<br />
Reflexive separation results when the effective reflexive kinetic energy<br />
(K r ) is larger than 75% <strong>of</strong> its nominal surface energy:<br />
3 3<br />
( ) 2/3<br />
K ≥ 0.75σπ<br />
d + d<br />
(26)<br />
r l s<br />
Where<br />
⎡<br />
2 2 3<br />
2/3<br />
( ) ( )<br />
( ) ( 6<br />
)<br />
⎤<br />
We<br />
Kr<br />
= σπ d ⎢<br />
l<br />
1+ ∆ − 1+ ∆ + ∆ η<br />
2 1<br />
+ η ⎥<br />
2<br />
⎢<br />
3<br />
12∆<br />
1+ ∆<br />
⎥<br />
⎣<br />
⎦<br />
∆ = d / d<br />
s<br />
l<br />
2 2<br />
( ) ( ) 1/2<br />
η1 = 2 1−ξ 1−ξ<br />
− 1<br />
2<br />
2<br />
( ) ( ) 1/2<br />
2 2 2 3<br />
η = ∆ −ξ ∆ −ξ<br />
− ∆<br />
( )<br />
ξ = 1 + ∆ B / 2<br />
(27)<br />
Yoon – Lagrangian modeling <strong>of</strong> dilute spray 98
This criterion can be rewritten in terms <strong>of</strong> the Weber number by setting<br />
the equal sign in Eq. (26).<br />
∆<br />
We<br />
6 2 3<br />
∆ + + + ∆ − + ∆ =<br />
η η 3⎡4 1 7 1 ⎤ 0<br />
⎥⎦<br />
( ) ( ) ( ) ( 2 1 2<br />
3<br />
⎢<br />
1+ ∆<br />
⎣<br />
)2/3<br />
(28)<br />
This Eq. (28) distinguishes the regime <strong>of</strong> reflexive separation from the<br />
regime <strong>of</strong> coalescence; the regimes above and below the line from Eq. (28)<br />
are those <strong>of</strong> coalescence and reflexive separation, respectively. On the other<br />
hand, when the total effective stretching kinetic energy (K si ) is larger than the<br />
surface energy <strong>of</strong> the region <strong>of</strong> interaction, stretching separation occurs:<br />
K<br />
si<br />
≥ S<br />
(29)<br />
si<br />
Where<br />
⎧ 3<br />
⎫<br />
1 2 2 ⎪ ∆<br />
3 2 3 ⎪<br />
Ksi = ρU Vl ⎨ ⎡<br />
2 ( 1 ) ( 1 x )( φs φl<br />
) ⎤<br />
2 3 ⎣<br />
+ ∆ − − + ∆<br />
⎦⎬<br />
⎪<br />
⎩( 1+ ∆ )<br />
⎪<br />
⎭<br />
(30)<br />
3<br />
( ) ⎤<br />
1/2<br />
Ssi = σ ⎡<br />
⎣<br />
2πVl dlτ ∆ φs + φl<br />
⎦<br />
⎧ 1 2<br />
1<br />
1 −<br />
3<br />
( 2 ∆ − τ ) ( ∆ + τ ) for h > d<br />
⎪ 4∆<br />
2<br />
φs<br />
= ⎨ 2<br />
⎪ τ<br />
1<br />
3<br />
( 3 ∆ − τ ) for h < d<br />
⎪⎩<br />
4∆<br />
2<br />
⎧ 1 2<br />
1<br />
1 −<br />
3<br />
( 2 − τ ) ( 1 + τ ) for h > d<br />
⎪ 4∆<br />
2<br />
φl<br />
= ⎨ 2<br />
⎪ τ<br />
1<br />
( 3 − τ ) for h < dl<br />
⎪⎩ 4 2<br />
1<br />
h = ( dl<br />
+ ds<br />
)( 1−<br />
B)<br />
2<br />
V = φ V<br />
V<br />
si s s<br />
= φ V<br />
li l l<br />
l<br />
s<br />
s<br />
Here the subscript “i” stands for “interacting” region. V represents the volume<br />
<strong>of</strong> the interacting regions. h is the width <strong>of</strong> the overlapping region. Eq. (30)<br />
can be rewritten in terms <strong>of</strong> the Weber number by setting the equal sign in Eq.<br />
(29).<br />
2<br />
( + ∆ 3 ) ⎡<br />
⎣<br />
( + ∆)( − B)( ∆ 3 φs<br />
+ φl<br />
)<br />
2 3 2 3<br />
∆ ⎡( 1+ ∆ ) − ( 1− B )( φs<br />
+ ∆ φl<br />
) ⎤<br />
4 1 3 1 1<br />
We =<br />
⎣<br />
⎦<br />
⎤<br />
⎦<br />
1/2<br />
(31)<br />
Yoon – Lagrangian modeling <strong>of</strong> dilute spray 99
This Eq. (31) distinguishes the regime <strong>of</strong> stretching separation from that <strong>of</strong><br />
coalescence; the regimes below and above the line from Eq. (28) are those <strong>of</strong><br />
coalescence and stretching separation, respectively.<br />
Bouncing Model by Estrade et al.<br />
Estrade et al. [92] gives a criterion for the bouncing regime. Their model<br />
criterion assumes that a drop’s initial kinetic energy <strong>of</strong> deformation does not<br />
exceed the energy required to produce the limit deformation. The model also<br />
assumes a short delay time during deformation, no energy exchange between<br />
gas and drop and little dissipative energy.<br />
If<br />
⎧We<br />
< Wecrit<br />
→<br />
⎨<br />
⎩We<br />
> Wecrit<br />
→<br />
Bouncing<br />
Coalescence<br />
(32)<br />
Where<br />
We<br />
χ<br />
crit<br />
2<br />
( 1 )( 4φ<br />
′ 12)<br />
∆ + ∆ −<br />
=<br />
χ<br />
l<br />
( )<br />
2<br />
( 1−<br />
B )<br />
⎧ 1 2<br />
1 − ( 2 − τ ) ( 1 + τ ) if τ > 1.0<br />
⎪ 4<br />
l<br />
= ⎨<br />
⎪ 1 2<br />
τ −τ τ ≤<br />
⎪⎩ 4<br />
3 if 1.0<br />
−2/3 1/3<br />
⎛ 3 ⎞ ⎛ 3 ⎞<br />
φ′ = 2 + 1 + + 1<br />
⎝ φ ⎠ ⎝ φ ⎠<br />
⎜ 2 ⎟ ⎜ 2 ⎟<br />
(33)<br />
∆ = d<br />
( 1 B)( 1 )<br />
τ = − + ∆<br />
s<br />
/ d<br />
l<br />
The value <strong>of</strong> the shape factor, φ′ , depends on φ which is the critical ratio<br />
<strong>of</strong> the smallest height, h, and the largest radius, r, as φ = h / r , as depicted in<br />
Figure 11. Thus, φ′ is a function <strong>of</strong> the particles properties and the<br />
surrounding gas. The range <strong>of</strong> the critical ratio is 0 < φ < 2 . If deformation is<br />
severe and nearly a “pancake” or “disk” is formed subsequent to the head-on<br />
collision, φ → 0 . If the head-on collision is so insignificant that nearly no<br />
deformation results, then φ → 2 because h approaches the particle diameter,<br />
namely h → 2r<br />
.<br />
Coalescence-Separation Model by O’Rourke<br />
The collision model by O’Rourke [43] accounts for grazing and<br />
coalescence <strong>of</strong> the colliding binary drops; it does not account for the<br />
shattering effect that may be important in high-speed collision scenarios [88].<br />
The collision model is based on the stochastic parcel method, which assumes<br />
the collision <strong>of</strong> the two parcels residing in the same computational cell. It is<br />
also assumes that the particles inside each parcel are uniformly distributed<br />
over the computational cells where the particles reside. The particles with the<br />
larger diameters are named “collectors” while the particles with the smaller in<br />
Yoon – Lagrangian modeling <strong>of</strong> dilute spray 100
diameters are called “donors.” The expected frequency <strong>of</strong> collisions between<br />
one collector and all the donor particles is governed by a Poisson process<br />
with frequency parameter λ having the following function form.<br />
n<br />
π<br />
( ) 2<br />
s<br />
f = rs rl us ul<br />
V<br />
+ −<br />
cell<br />
r<br />
r<br />
(34)<br />
The subscripts “l” and “s” refer to the properties for the collectors (large) and<br />
donors (small) and, respectively. V cell is the volume <strong>of</strong> the computational cell<br />
and n s is the number <strong>of</strong> donors. For a Poisson process, the likelihood that a<br />
collector undergoes n collisions is defined with the following probability<br />
density function (PDF) distribution,<br />
n<br />
n n<br />
−<br />
PDF = e , where n = f ∆ t<br />
(35)<br />
n!<br />
Here, n refers to the averaged number <strong>of</strong> collisions that a collector<br />
undergoes with donors. ∆t represents the computational time step. When no<br />
n<br />
collision occurs, the value <strong>of</strong> PDF approaches PDF → e − . The value <strong>of</strong> PDF<br />
is determined by sampling a random number, ranging 0 < RN1<br />
< 1 . If<br />
RN1 < PDFo<br />
, then no collision results. On the other hand, if RN1 > PDFo<br />
, then a<br />
second random number, 0 < RN2<br />
< 1, is chosen to determine whether<br />
coalescence or grazing collision occurs.<br />
The model outcome <strong>of</strong> the collision is based on the experimental and<br />
theoretical works <strong>of</strong> Brazier-Smith et al. [44] on the collision <strong>of</strong> water particles.<br />
In the Brazier-Smith study, three regimes (i.e., bouncing, coalescence, and<br />
separation) <strong>of</strong> particle collision are identified and found to be dependent on<br />
x = RN r + r , defined as the perpendicular distance<br />
the impact parameter, ( )<br />
2 l s<br />
between the center <strong>of</strong> one particle and the undeflected trajectory <strong>of</strong> the other<br />
[44]; see Figure. 11(a). This impact parameter <strong>of</strong> each particle is represented<br />
stochastically because individual particles inside a parcel are not tracked<br />
during computation, but only parcels are tracked in Lagrangian simulation.<br />
The O’Rourke collision model assumes the follow post-collision state (see<br />
Figure 12);<br />
o<br />
If<br />
⎧x<br />
< xcrit<br />
→<br />
⎨<br />
⎩ x > xcrit<br />
→<br />
Coalescence<br />
Separation or grazing<br />
(36)<br />
The collision model <strong>of</strong> O’Rourke [43] only accounts for grazing collision<br />
without satellite particle formation. According to O’Rourke, the critical impact<br />
parameter, x crit , is:<br />
⎡ 1 ⎤<br />
xcrit = ( rl + rs<br />
) min ⎢ 2.4 f ( γ ) , 1.0 ⎥<br />
⎣ Wes<br />
⎦<br />
(37)<br />
Yoon – Lagrangian modeling <strong>of</strong> dilute spray 101
f γ = γ − 2.4γ + 2.7γ<br />
represents a curve-fit based on the data by<br />
where ( )<br />
4<br />
Brazier-Smith et al for water drop collision. The ratio <strong>of</strong> the collector to donor<br />
is γ = rl / rs = dl / ds<br />
or γ = 1/ ∆ = dl<br />
/ ds<br />
, and the Weber number is<br />
r r 2<br />
We = ρ u − u r / σ .<br />
s liq l s s<br />
Once the outcome <strong>of</strong> the collision is known (suppose it is coalescence),<br />
then the number <strong>of</strong> coalescences for each collector is determined by<br />
satisfying the relation below:<br />
n−1<br />
∑ PDF( k) ≤ RN ≤ ∑ PDF( k)<br />
(38)<br />
1<br />
k= 0 k=<br />
0<br />
n<br />
Coalescence if x < x crit<br />
Separation or Grazing collision if x > x crit<br />
Figure 12 Collision criterion <strong>of</strong> binary drops by O’Rourke [43]<br />
Satellite Model by Munnannur and Reitz<br />
In the reflexive and stretching separation regimes, satellites (r sat ) are<br />
formed as a result <strong>of</strong> elongation <strong>of</strong> temporarily coalesced drops into a<br />
ligament (r lig ) which eventually breaks up into satellites. Based on the<br />
Rayleigh’s linear jet breakup theory, all satellites formed are assumed to have<br />
the same size as r sat =1.89r lig , assuming that the nonlinear effect is negligible.<br />
Readers should be warned that multiple crests per wavelength due to<br />
nonlinearity can result in several satellites, which in turn yield r sat 0 → Separation occurs<br />
≤ 0 → Grazing collision without fragmentation<br />
(39)<br />
Where<br />
C<br />
vs<br />
=<br />
K − S − E<br />
K + S + E<br />
si si diss<br />
si si diss<br />
(40)<br />
Once separation occurs, the time scale, which represents the ratio <strong>of</strong> the<br />
capillary time scale to the elongation time scale <strong>of</strong> the fluid ligament, is<br />
Yoon – Lagrangian modeling <strong>of</strong> dilute spray 102
introduced to determine whether there will be a single satellite or multiple<br />
satellites<br />
If<br />
⎧τ<br />
⎨<br />
⎩τ<br />
reflex<br />
reflex<br />
> 2 → Multiple satellites<br />
≤ 2 → A single satellite<br />
(41)<br />
2<br />
where τ<br />
reflex<br />
= 0.75k2 We0<br />
, k 2 =0.45, and We0 = ρl (2 r0<br />
) urel / σ<br />
l<br />
. If a single satellite<br />
is formed between the two end-drops, the drop radius is:<br />
⎡⎛<br />
4 ⎞<br />
r0<br />
= ⎢⎜<br />
⎟ r + r<br />
⎣⎝<br />
3 ⎠<br />
( ) 1/3<br />
3 3 ⎤<br />
ψ<br />
l l<br />
ψ<br />
s s<br />
⎥<br />
⎦<br />
(42)<br />
If multiple satellites are formed, then the satellites radius is r = 1.89r<br />
where<br />
ligament radius can be computed by solving the equation below:<br />
sat<br />
lig<br />
⎛ 0.75 ⎞<br />
⎜ ⎟<br />
⎝ 2 ⎠<br />
( α )<br />
1/ 2<br />
1 0<br />
3.5 2<br />
lig lig<br />
k We r + r − 1 = 0<br />
(43)<br />
where k 1 =8.5 and α=0.44, and rlig<br />
= rlig<br />
/ r0<br />
. Note, the ligament (as a cylinder)<br />
is situated between the two end-drops. Prior to ligament stretching, the<br />
ligament is a fat cylinder whose radius is r 0 and its length is also r 0 and, thus,<br />
3<br />
its volume is V = π r . After the ligament is stretched to a thin cylinder, it<br />
lig<br />
0<br />
eventually breaks up into multiple satellites, and their total volume is<br />
3<br />
expressed as Vsat = Nsat (4 / 3) π rsat<br />
. Because mass conserves as Vlig = Vsat<br />
, the<br />
total number <strong>of</strong> the satellites is:<br />
N<br />
sat<br />
3 ⎛ r<br />
⎞<br />
0<br />
= ⎜ ⎟<br />
4 rsat<br />
⎝<br />
⎠<br />
3<br />
(44)<br />
Post-Collision Properties for Liquid Binary Drops<br />
Once the type <strong>of</strong> collision and the number <strong>of</strong> particles in the collision are<br />
determined, then properties <strong>of</strong> the collector and donor parcels are updated<br />
based on mass, momentum and energy principles, which are detailed in refs.<br />
[86] and [43]. These relations are summarized below for, first, a collision event<br />
resulting in coalescence, in which the colliding donor (small) particles are<br />
coalesced with the collector (larger) particle and, thus, n coll number <strong>of</strong> donors<br />
is zero in the donor parcel, where n coll refers to the number <strong>of</strong> collisions.<br />
m = m = m + m n<br />
new<br />
t t l s coll<br />
new 1<br />
Tl = ( Tl ml + Tsms ncoll<br />
)<br />
(45)<br />
m<br />
t<br />
rnew<br />
1 r r<br />
u = m u + m u n<br />
m<br />
( )<br />
l l l s s coll<br />
t<br />
Yoon – Lagrangian modeling <strong>of</strong> dilute spray 103
⎛<br />
new 6m<br />
⎞<br />
t<br />
dl<br />
= ⎜<br />
πρ ⎟<br />
⎝ liq ⎠<br />
new<br />
n = n − n<br />
s s coll<br />
1/3<br />
Here, the “new” superscript variables and<br />
m<br />
t<br />
denotes the parcel<br />
properties and the total mass <strong>of</strong> the collector particles after collision. n l and n s<br />
refer to the number <strong>of</strong> large and small particles inside a computational parcel.<br />
If (n coll n l ) > n s , then there are physically not enough particles in the donor<br />
parcel to accommodate all <strong>of</strong> the collisions with the particles in the collector<br />
parcel. In this case, n coll is reset to n s /n l and the mass <strong>of</strong> the particles<br />
associated with the particle parcel is set equal to zero and eventually removed<br />
from the calculation.<br />
In a grazing collision event, only momentum exchange is considered<br />
since the time scales associated with heat exchange are much longer than<br />
the collision event. The particle velocities after collision are set as follows [43];<br />
⎧ r 1 ⎧<br />
new ⎪ r r r r ⎛ b − b ⎞⎫<br />
crit ⎪<br />
⎪us = ⎨msus + mlul + ml ( us − ul<br />
) ⎜ ⎟⎬<br />
⎪ ms + ml ⎪ ⎝ rs + rl − bcrit<br />
⎠⎪<br />
If nl<br />
> ns,<br />
⎩<br />
⎭<br />
⎨ r r<br />
⎪ rnew<br />
nsul + ( nl − ns ) ul<br />
⎪ul<br />
=<br />
⎩<br />
nl<br />
⎧r 1 ⎧<br />
new ⎪ r r r r ⎛ b − b ⎞⎫<br />
crit ⎪<br />
⎪us = ⎨msus + mlul + ms ( ul − us<br />
) ⎜ ⎟⎬<br />
⎪ ms + ml ⎪ ⎝ rs + rl − bcrit<br />
⎠⎪<br />
If nl<br />
< ns<br />
,<br />
⎩<br />
⎭<br />
⎨ r r<br />
⎪ rnew<br />
nlus + ( ns − nl ) us<br />
⎪ul<br />
=<br />
⎩<br />
ns<br />
(46)<br />
2.8 Particle-wall impact<br />
Often, traveling particles collide with solid surrounding walls and the<br />
particle impact phenomena are investigated for various practical reasons: if<br />
particles do not deposit onto the surface (whether it is because <strong>of</strong> the liquid’s<br />
high surface tension, hydrophobic substrate, a thin air-film, or the Leidenfrost<br />
effect), painting/coating quality becomes rather poor. For spray cooling<br />
applications, the particle rebound phenomenon decreases the cooling<br />
efficiency. In automobile applications, excessive fuel spray impingement onto<br />
walls <strong>of</strong> the IC engine forms a liquid film whose fuel-rich burning leads to<br />
unwanted pollutants. At high impact speeds, particles break up (<strong>of</strong>ten referred<br />
to as “splashing”) into satellites, leaving scattered marks in the impacted<br />
region; this is detrimental for inkjet printing applications that requires a clean<br />
dot-printing onto a substrate. On the other hand, for spray drying applications,<br />
splashing should be promoted to produce powders by spraying monodisperse<br />
drops onto various substrates. In these aforementioned applications,<br />
the particle impact phenomena should be controlled and understood properly<br />
to delineate their impact physics in the stochastic spray model.<br />
Yoon – Lagrangian modeling <strong>of</strong> dilute spray 104
Traditionally, surface tension, viscosity, and substrate roughness (i.e.,<br />
We, Re, and R a ,) are the primary parameters that describe drop impact<br />
phenomena [94]. Bouncing occurs when the surface tension force greatly<br />
exceeds the dynamic force. When the dynamic force overcomes the surface<br />
tension force, the particle spreads upon impact and can splash if the dynamic<br />
force is too excessive; otherwise it simply spreads. In this report, outlines for<br />
the (i) bouncing, (ii) sticking, (iii) splashing phenomena are briefly are<br />
reviewed and the relevant references for the description <strong>of</strong> their detailed<br />
modeling approaches are suggested (see Figure 13).<br />
Figure 13<br />
Configuration states during particle impact consisting <strong>of</strong> preimpact<br />
(i.e., incoming stage), impact (i.e., maximum diameter),<br />
and post-impact (i.e., sticking, bouncing, and splashing)<br />
Bouncing<br />
Bouncing is commonly observed during a low speed impact, where the<br />
surface tension effect is pronounced. This phenomenon is <strong>of</strong> low interest<br />
because most <strong>of</strong> the present applications are concerned with high-speed<br />
impacts. Furthermore, it is <strong>of</strong> relatively low interest to industries, as opposed<br />
to sticking and splashing phenomena, because it has few practical<br />
applications. However, bouncing does occur in drop or spray impact and,<br />
thus, its mechanism needs to be correctly understood for accurate impact<br />
modeling. Aziz and Chandra [95] noted: If the surface energy <strong>of</strong> a drop at its<br />
maximum spreading is greater than the dissipation energy, then the drop<br />
rebounds; otherwise, the drop will stick. Mao et al. [96] also suggested a<br />
rebound criterion with the dimensionless rebound energy, E r * as an implicit<br />
function <strong>of</strong> the maximum spread factor and the equilibrium contact angle. If<br />
E r * >0, then the drop rebounds; otherwise, it sticks. More recently, Mukherjee<br />
and Abraham [97] presented a numerical simulation <strong>of</strong> rebounding using the<br />
lattice-Boltzmann model; but their study was limited to a case where the<br />
density ratios between the drop and surrounding gas were only 5 and 10.<br />
Ideally, the density ratio should reach an order <strong>of</strong> ~10 3 for water-drop impact<br />
Yoon – Lagrangian modeling <strong>of</strong> dilute spray 105
in air. Park et al. [98] used the boundary integral method to model the<br />
rebounding phenomenon for a range <strong>of</strong> air pressures.<br />
Sticking<br />
Among various subjects on drop impact, sticking has received much<br />
attention because <strong>of</strong> its broad applications such as inkjet-printing, coating,<br />
painting, and spray cooling. The maximum spreading diameter <strong>of</strong>ten needs to<br />
be predicted to estimate the coating area-coverage or painting performance.<br />
The accurate prediction includes the competition between the drop’s inertia<br />
and surface tension energy and viscous dissipation energy. Chandra and<br />
Avedisian [99] predicted the maximum spreading diameter using an energy<br />
conservation concept. Healy et al. [100] compared various suggested models<br />
for experimental data (Ford and Furmidge, [101], Stow and Hadfield, [102])<br />
and concluded that the model by Yang [103] yielded the best result. Mao et al.<br />
[96] also provided a correlation for the maximum spreading diameter as a<br />
function <strong>of</strong> the Reynolds, Weber number, and contact angle. Gong [104] also<br />
suggested another spreading model, but his results were not quantitatively<br />
compared with the results <strong>of</strong> other existing models. Sikalo et al. [105] utilized<br />
the VOF (Volume-<strong>of</strong>-Fluid) model for the maximum spreading diameter for<br />
highly viscous glycerin drops; their numerical results were compared with the<br />
experimental data <strong>of</strong> Stow and Hadfield [102]. For fire modeling applications,<br />
the sticking might be the source term for a fuel fire as a pool forms, and is,<br />
therefore, <strong>of</strong> interest. For solid propellant fires, the sticking can provide<br />
substantial deposition heat transfer to an object.<br />
Splashing<br />
Splash occurs for a relatively high speed impact, where inertia dominates<br />
over surface tension or/and viscosity. Various splash criteria were <strong>of</strong>fered by<br />
Yarin and Weiss [106], Mundo et al. [107], and Cossali et al. [108]. Because<br />
<strong>of</strong> the dependence <strong>of</strong> splash on surface tension and viscosity, splashed<br />
droplets or satellites are normally scaled with the Weber, number and<br />
Reynolds or Ohnesorge (Oh) number (i.e., impingement characteristic<br />
parameter, K crit =aWe b Re c , where a, b, and c are constants; as for a drop onto<br />
film for example, K crit = Oh -0.4 We = We 0.8 Re 0.4 = 2100 + 5880 (δ * ) 1.44 , where<br />
δ * = film thickness, non-dimensionalized by parent drop diameter, D p ), and so<br />
is the splashed liquid amount. At moderate impact speed, a corona is<br />
normally formed during spreading and the capillary waves along the rim <strong>of</strong><br />
the corona in the azimuthal direction appear and eventually they snap-<strong>of</strong>f, a<br />
phenomenon known as “corona splash.” When the substrate is wet (liquid<br />
film), a rising corona sheet or crown is <strong>of</strong> larger relative size due to the mass<br />
added by the film. The related work on this topic includes: Stow and Stainer<br />
[109], Marmanis and Thoroddsen [110], Rioboo et al. [111], Xu et al. [112],<br />
Xu [113], and Kalantari and Tropea [114]. The splashed droplets size<br />
appears to obey a log-normal distribution, according to Stow and Hadfield<br />
[102]. Post-impact characteristics <strong>of</strong> the splashed droplets, such as their<br />
speed and size, were also studied by Cossali et al. [108] and Roisman et al.<br />
[115].<br />
Yoon – Lagrangian modeling <strong>of</strong> dilute spray 106
Surface roughness<br />
Stow and Hadfield [102], Mundo et al. [107,116], Range and Feuillebois<br />
[117], Rioboo et al. [111] noted that the splashing criteria could change with<br />
surface roughness. Cossali et al. [108] provided an empirical fit for K crit for a<br />
dry surface, based on the previous data; K crit =649+3.76/R * , where R * is the<br />
surface roughness, non-dimensionalized by D p . When the surface is<br />
sufficiently rough, “prompt splash” occurs, which is immediately followed by<br />
spreading. Breakthrough research was conducted by Xu et al. [112], who first<br />
showed that splash is a function <strong>of</strong> air pressure while conventional wisdom<br />
suggested that splash is dependent only on substrate roughness and the<br />
drop’s physical properties. Their finding provides a new degree <strong>of</strong> freedom in<br />
controlling splash.<br />
3.0 Conclusion<br />
A general description <strong>of</strong> the particle phase transport equation (i.e.,<br />
conservation <strong>of</strong> mass, momentum, and energy) was reviewed on the basis <strong>of</strong><br />
Eulerian-Lagrangian particle tracking method. In this modeling approach,<br />
suitable for the dilute two-phase flow system, the particle phase is modeled on<br />
a Lagrangian reference frame and the gas phase is modeled on an Eulerian<br />
reference frame. Explanation on the interaction between the particle phase<br />
turbulence model and the k-ε RANS (Reynolds-Averaged Navier-Stokes)<br />
turbulence for the Eulerian phase was also provided. A stochastic approach<br />
utilizing PDFs was adopted for several sub-models, such as drop size<br />
distribution, turbulence, and binary collision. Furthermore, various models for<br />
the particle-wall interaction were reviewed.<br />
4.0 Acknowledgement<br />
This research was supported by Research Center <strong>of</strong> Break-through<br />
<strong>Technology</strong> Program through the Korea Institute <strong>of</strong> Energy <strong>Technology</strong><br />
Evaluation and Planning (KETEP) funded by the Ministry <strong>of</strong> Knowledge<br />
Economy (2009-3021010030-11-1). The author also acknowledges that a<br />
partial support was made for this project by the <strong>National</strong> Research Foundation<br />
<strong>of</strong> Korea NRF Grant (NRF-2010-D00013). The author is indebted to Pr<strong>of</strong>. Paul<br />
DesJardin at <strong>University</strong> <strong>of</strong> Buffalo for his support in writing this review chapter.<br />
5.0 References<br />
1. Chigier, C. Challenges for Future Research in Atomization and <strong>Spray</strong> <strong>Technology</strong>:<br />
Arthur Lefebvre Memorial Lecture. Atomization and <strong>Spray</strong>s 2006, 16, 727–736.<br />
2. Drazin, P.G.; and Reid, W.H. Hydrodynamic Stability. Cambridge <strong>University</strong> Press,<br />
New York, NY 1981, 14–28.<br />
3. Rayleigh W.S. On the Instability <strong>of</strong> Jets, Proceedings <strong>of</strong> London Mathematical Society<br />
Lecture Note Series 1878, 10 (4)<br />
4. Weber , C. Zum Zerfall eines Flussigkeitsstrahles. Angewandte Zeitschrift fur<br />
Mathemetischelogik und Mechnika 1931, 11, 138–245.<br />
Yoon – Lagrangian modeling <strong>of</strong> dilute spray 107
5. Batchelor ,G.K. Collected Works <strong>of</strong> G. I. Taylor. Cambridge <strong>University</strong> Press,<br />
Cambridge, MA, 1958.<br />
6. Ponstein. J. Instability <strong>of</strong> Rotating Cylindrical Jets. Applied Sciencific Research 1959,<br />
8 (6), 425–456.<br />
7. Levich, V.G. Physicochemical Hydrodynamics. Prentice Hall, Englewood Cliffs, NJ<br />
1962, 639–646<br />
8. Sterling, A.M.; Sleicher, C.A. The Instability <strong>of</strong> Capillary Jets. Journal <strong>of</strong> Fluid<br />
Mechanics 1975, 68 (3), 477–495.<br />
9. Wu, K. J.; Reitz, R. D.; Bracco, F.V. Measurements <strong>of</strong> Particle Size at the <strong>Spray</strong> Edge<br />
near the Nozzle in Atomizing Liquid Jets. Physics <strong>of</strong> Fluids 1986, 29 (4), 941–951.<br />
10. Brennen, C. Cavity Surface Wave Patterns and General Appearance. Journal <strong>of</strong> Fluid<br />
Mechanics 1970, 44 (1), 33–493.<br />
11. Yoon, S.S.; Heister, S. D. Categorizing linear theories for atomizing round jets,<br />
Atomization and <strong>Spray</strong>s 2003, 13, 499-516.<br />
12. Longuet-Higgins, M.S.; Cokelet, E.D. The deformation <strong>of</strong> steep surfaces waves on<br />
water. I. A numerical method <strong>of</strong> computation. Proceedings <strong>of</strong> the Royal Society <strong>of</strong><br />
London Series A-mathematical and Physical Science 1976, 350, 1-26.<br />
13. Lundgren, T.S.; Mansour, N.N. Oscillations <strong>of</strong> Particles in Zero Gravity with Weak<br />
Viscous Effects. Journal <strong>of</strong> Fluid Mechanics 1988, 194, 479-510.<br />
14. Hilbing, J.H.; Heister, S.D.; Spangler, C.A.; Boundary Element Method for<br />
Atomization <strong>of</strong> a Finite Liquid Jet. Atomization and <strong>Spray</strong>s 1995, 5, 621-638.<br />
15. Heister, S.D. Boundary Element Methods for Two-Fluid Free Surface Flows.<br />
Engineering Analysis Boundary with Elements 1997, 19, 309-317.<br />
16. Yoon, S.S.,; Heister, S.D.; Analytic Solution for Fluxes at Interior Points for the 2D<br />
Laplace Equation. Engineering Analysis Boundary with Elements 2000, 24, 155-160.<br />
17. Yoon, S.S.; Heister, S.D.; Epperson, J.T.; Sojka, P.E.; Modeling Multi-jet Mode<br />
Electrostatic Atomization using Boundary Element Methods. Journal <strong>of</strong> Electrostatics<br />
2001, 50, 91-108.<br />
18. Yoon, S.S.; Heister, S.D. A Nonlinear Atomization Model Based on a Boundary Layer<br />
Instability Mechanism. Physics <strong>of</strong> Fluids 2004, 16, 47-61.<br />
19. Yoon, S.S. Particle Distributions at the Liquid Core <strong>of</strong> a Turbulent <strong>Spray</strong>. Physics <strong>of</strong><br />
Fluids 2005, 035103.<br />
20. Park, H.; Yoon, S.S.; Heister, S.D. A Nonlinear Atomization Model for Computation <strong>of</strong><br />
Particle-Size Distributions and Complete <strong>Spray</strong> Simulation, International Journal for<br />
Numerical Methods in Fluids 2005, 48, 1219-1240.<br />
21. Park, H.; Heister, S.D. Nonlinear Simulation <strong>of</strong> Free Surfaces and Atomization in<br />
Pressure Swirl Atomizers. Physics <strong>of</strong> Fluids 2006, 18, 052103.<br />
22. Ashraf, A. I.; Milind, A. J. Nonlinear Breakup Model for a Liquid Sheet Emanating<br />
From a Pressure-Swirl Atomizer. Journal <strong>of</strong> Engineering for Gas Turbines and Power<br />
2007, 129, 945-953.<br />
23. Boeck, T.; Li, J.; López-Pagés, E.; Yecko, P.; Zaleski, S. Ligament formation in<br />
sheared liquid–gas layers. Theoretical and Computational Fluid Dynamics 2007, 21,<br />
59–76.<br />
24. Huawei, H.; Kamiel, G. A Numerical Study <strong>of</strong> Entrainment Mechanism in<br />
Axisymmetric Annular Gas-Liquid Flow 2007, 129, 293-301.<br />
25. Ishimoto, J.; Ohira, K.; Okabayashi, K.; Chitose, K. Integrated numerical prediction <strong>of</strong><br />
atomization process <strong>of</strong> liquid hydrogen jet. Cryogenics 2008, 48, 238–247.<br />
26. Mandal, A.; M, A. Jo; J, Xue; A, A. Ibrahim. Flow <strong>of</strong> power-law fluids in simplex<br />
atomizers. International Journal <strong>of</strong> Heat and Fluid Flow 2008, 29, 1494–1503.<br />
27. Siamas, G.A.; Jiang, X.; Wrobel, L.C. A numerical study <strong>of</strong> an annular liquid jet in a<br />
compressible gas medium. International Journal <strong>of</strong> Multiphase Flow 2008, 34, 393–<br />
407<br />
28. Lebas, R.; Menard, T.; Beau, P.A.; Berlemont, A.; Demoulin, F.X.; Numerical<br />
simulation <strong>of</strong> primary break-up and atomization: DNS and modeling study.<br />
International Journal <strong>of</strong> Multiphase Flow 2009, 35, 247-260.<br />
29. Pan, Y; Suga, K. A numerical study on the breakup process <strong>of</strong> laminar liquid jets into<br />
a gas, physics <strong>of</strong> fluid 2006, 18, 052101.<br />
30. Gorokhovski, M.; Herrmann, M. Modeling Primary Atomization. Annual. Review <strong>of</strong><br />
Fluid Mechanics 2008, 40, 343-366.<br />
31. O’Rourke, P.J.; Amsden, A.A., The Tab Method for Numerical Calculation <strong>of</strong> <strong>Spray</strong><br />
Particle Breakup. SAE Technical 1987, 872089.<br />
Yoon – Lagrangian modeling <strong>of</strong> dilute spray 108
32. Berlemont, A.; Desjonqueres, P; Gouesbet, G. Particle lagrangian simulation in<br />
turbulent flows. International Journal <strong>of</strong> Multiphase Flow 1990, 16 (1), 19-34.<br />
33. Berlemont, A.; Grancher., M.S.; Gouesbet, G.; On the Lagrangian simulation <strong>of</strong><br />
turbulence influence on particle evaporation. International Journal <strong>of</strong> Heat and Mass<br />
Transfer 1991, 34, 280-2812.<br />
34. Berlemont, A.; Grancher, M.S.; Gouesbet, G. Heat and mass transfer coupling<br />
between vaporizing particles and turbulence using a Lagrangian approach.<br />
International Journal <strong>of</strong> Heat and Mass Transfer 1995, 38, 3023-3034.<br />
35. Berlemont, A.; Achim, P.; Chang, Z.; Lagrangian approaches for particle collisions:<br />
The colliding particle velocity correlation in the multiple particles tracking method and<br />
in the stochastic approach. physics <strong>of</strong> fluids 2001, 13 (10), 1396845.<br />
36. Crowe, C.T.; Sharma, M.P.; Stock, D.E. The particle-source-in cell (PSI-CELL) model<br />
for gas-particle flows. Journal <strong>of</strong> Fluids Engineering 1977, 99, 325-332.<br />
37. Crowe, C.T.; Chung, J.N.; Troutt, T.R. Particle mixing in free shear flows. Progress in<br />
energy and combustion Science 1988, 14, 171-194.<br />
38. Crowe, C.T.; Troutt, R.; and Chung, J.N. Numerical models for two-phase turbulent<br />
flows. Annual Review Fluid Mechanics 1996, 28, 1143.<br />
39. Crowe, C.; Sommerfeld, M.; Tsuji, Y. Multiphase Flows with Particles and Particles.<br />
CRC Press, New York, NY, 1998.<br />
40. Li, J.; Kuipers, J.A.M. On the origin <strong>of</strong> heterogeneous structure in dense gas–solid<br />
flows. Chemical Engineering Science 2005, 60, 1251 – 1265.<br />
41. Helland, E.; KOccelli, R.; Tadrist, L. Numerical study <strong>of</strong> cluster formation in a gasparticle<br />
circulating fluidized bed. Powder <strong>Technology</strong> 2000, 110, 210-221<br />
42. Lee. M.W. Numerical Studies on the Behavior Characteristics <strong>of</strong> Bi-dispersed Particle<br />
in Gas-Solid Fluidized Bed. M.S., Korea <strong>University</strong> 2009.<br />
43. O’Rourke, P. Collective Particle Effects on Vaporizing Liquid <strong>Spray</strong>s. Los Alamos<br />
<strong>National</strong> Laboratory Report 1981, No. LA-9069-T<br />
44. Brazier-Smith, P.R.; Jennings, S.G.; Latham, J. The Interaction <strong>of</strong> Falling Water<br />
Particles: Coalescence. Proceedings <strong>of</strong> the Royal Society <strong>of</strong> London Series A-<br />
mathematical and Physical Science 1972, 326, 393-408.<br />
45. Anderson, T. B. and Jackson, R., A Fluid Mechanical Description <strong>of</strong> Fluidized Beds,<br />
I&EC Fundamentals 1967, 6 (4), 527–539.<br />
46. Gray, W.G.; Lee, P.C.Y. On the Theorems for Local Volume Averaging <strong>of</strong> Multiphase<br />
Systems. Int. J. Multiphase Flow 1977, 3, 333-340.<br />
47. Gough, P.S.; Zwarts, F.J. Modeling Heterogeneous Two-Phase Reacting Flow. AIAA<br />
Journal 1979, 17 (1), 17-25.<br />
48. Slattery, J.C. Flow <strong>of</strong> Viscoelastic Fluids Through Porous Media. AICHE Journal<br />
1966, 13, 1066-MS.<br />
49. Slattery, J.C. Momentum Energy and Mass Transfer in Continua, second edition.<br />
Robert E. Krieger Publishing Company, Inc 1981.<br />
50. Whitkar, S. Advances in the Theory <strong>of</strong> Porous Media. Industrial and Engineering<br />
Chemistry 1969, 61, 14-28.<br />
51. Whitkar, S. The Transport Equations for Multi-phase Systems. Chemical Engineering<br />
Science, 1973, 28, 139-147.<br />
52. Oefelein, J.C.; Yang, V. Simulation <strong>of</strong> High-Pressure <strong>Spray</strong> Field Dynamics, in<br />
Recent Advances in <strong>Spray</strong> Combustion: <strong>Spray</strong> Atomization and Particle Burning<br />
Phenomena in Progress in Astronautics and Aeronautics 1996, 2.<br />
53. Zhu, M.; Bray, K.N.; Rumberg, O.; Rogg, B.; PDF Transport Equations for Two-Phase<br />
Reactive Flows and <strong>Spray</strong>. Combustion and Flame 2000, 122, 327-338.<br />
54. Archambault, M.R.; Edwards, C.F. Computation <strong>of</strong> <strong>Spray</strong> Dynamics By Direct<br />
Solution <strong>of</strong> Moment Transport Equations. 38th Aerospace Sciences Meeting &<br />
Exhibit, Reno, NV 2000.<br />
55. DesJardin P.E.; Gritzo. A dilute spray model for fire simulations: formulation, usage<br />
and benchmark problems. Sandia <strong>National</strong> Laboratories Technical Report, L.A 2002,<br />
SAND2002-3419,.<br />
56. Faeth, G.M.; Evaporation and Combustion <strong>of</strong> <strong>Spray</strong>. Progress in energy and<br />
combustion Science 1983, 1-76.<br />
57. Hewson, J.C.; Yoon, S.S. On sampling from prescribed particle <strong>pdf</strong>s using<br />
computational parcels. Atomization and <strong>Spray</strong>s, 2005, 15, 119-131.<br />
58. Faeth, G.M.; Mixing, Transport and Combustion in <strong>Spray</strong>s. Progress in energy and<br />
combustion Science 1987, 13, 293-345.<br />
Yoon – Lagrangian modeling <strong>of</strong> dilute spray 109
59. Ranz, W.E.; Marshall, W.R.; Evaporation from Particles, Chemical Engineering<br />
Progress 1952, 141-173.<br />
60. Maxey, M.R. and Riley, J.J., Equation <strong>of</strong> Motion for a Small Rigid Sphere in a<br />
Nonuniform Flow, Physics <strong>of</strong> Fluids 1983, 26 (4), 883-889.<br />
61. Loth, E. Numerical Approaches for Motion <strong>of</strong> Dispersed Particles, Particles, and<br />
Bubbles. Progress in Energy and Combustion Science 2000, 26, 161-223.<br />
62. Odar, F.; Hamilton, W.S. Forces on a sphere accelerating in a viscous fluid. Journal<br />
<strong>of</strong> Fluid Mechanics 1964, 18, 302-314<br />
63. Chhabra, R.P.; Agarwal, L.; Sinha, N.K. Drag on Non-spherical Particles: An<br />
Evaluation <strong>of</strong> Available Methods. Powder <strong>Technology</strong> 1999, 101, 288-295.<br />
64. Lazaro, B.J.; Lasheras. J.C. Particle dispersion in a turbulent, plane, free shear layer.<br />
Physics <strong>of</strong> Fluids A 1989, 6, 1035-1044.<br />
65. Vojir, D.J.; Michaelides, E.E. Effect <strong>of</strong> the history term on the motion <strong>of</strong> rigid spheres<br />
in a viscous fluid. International Journal <strong>of</strong> Multiphase Flow 1994, 20 (3), 547-556.<br />
66. Ganser, G.H. A rational approach to drag prediction <strong>of</strong> spherical and nonspherical<br />
particles. Powder <strong>Technology</strong> 1993, 77, 143-152.<br />
67. Kuo, K.K. Principles <strong>of</strong> Combustion; A Wiley-Interscience Publication, John Wiley &<br />
Sons: New York, 1986.<br />
68. Watson, K.M. Predication <strong>of</strong> Critical Temperature and Heats <strong>of</strong> Vaporization.<br />
Industrial and Engineering Chemistry 1931, 23, 360-364.<br />
69. Lefebvre, A.H. Atomization and <strong>Spray</strong>s; Hemisphere Publishing Corporation: New<br />
York, 1989.<br />
70. Gosman, A.D.; Ioannides, E. Aspects <strong>of</strong> Computer Simulation <strong>of</strong> Liquid-Fueled<br />
Combustion. 19 th American Institute <strong>of</strong> Aeronautics and Astronautics Aerospace<br />
Sciences Meeting 1981, 810323.<br />
71. Shuen, J-S.; Chen, L-D.; Faeth, G.M. Evaluation <strong>of</strong> a Stochastic Model <strong>of</strong> Particle<br />
Dispersion in a Turbulent Round Jet. AICHE Journal 1983, 29, 167-170.<br />
72. Durst, F.; Milojevic, D.; Schonung, B. Eulerian and Lagrangian Predictions <strong>of</strong><br />
Particulate Two-phase Flows: a Numerical Study. Applied Mathematical Modelling<br />
1984, 8, 101-115.<br />
73. Milojevic, D. Lagrangian Stochastic-Deterministic (LSD) Predictions <strong>of</strong> Particle<br />
Dispersion in Turbulence. Particle & Particle Systems Characterization 1990, 7, 181-<br />
190.<br />
74. Blumcke, E.; Brandt, M.; Eickh<strong>of</strong>f, H.; Hassa, C. Particle Dispersion in Highly Swirling,<br />
Turbulent Flows. Particle & Particle Systems Characterization 1993, 10, 182-190.<br />
75. Klose, G.; Rembold, B.; Koch, R.; Wittig, S. Comparison <strong>of</strong> State-<strong>of</strong>-the-art Droplet<br />
Turbulence Interaction Models for Jet Engine Combustor Conditions. International<br />
Journal <strong>of</strong> Heat and Fluid Flow 2001, 22, 343-349.<br />
76. Hinze, J. O. Turbulence; McGraw Hill Book Company: New York, 1975.<br />
77. Bergwerk, W. Flow Patterns in Diesel Nozzle <strong>Spray</strong> Holes. Proceedings <strong>of</strong> the<br />
Institution <strong>of</strong> Mechanical Engineers Series 1959, 173, 655.<br />
78. Brennen, C. Cavity Surface Wave Patterns and General Appearance. Journal <strong>of</strong> Fluid<br />
Mechanics 1970, 44, 33.<br />
79. Hoyt, J.W.; Taylor, J.J. Turbulence Structure in a Water Jet Discharging in Air.<br />
Physics <strong>of</strong> Fluids 1977, 20, S253<br />
80. Reitz, R.D. Modeling Atomization Processes in High-Pressure Vaporizing <strong>Spray</strong>s.<br />
Atomisation and <strong>Spray</strong> <strong>Technology</strong> 1987, 3, 309-337.<br />
81. Su, T.F.; Patterson, M.A.; Reitz, R.D.; Farrell, P.V. Experimental and numerical<br />
studies <strong>of</strong> high pressure multiple injection sprays. SAE paper 1996, 960861<br />
82. Liu, A.B.; Mather, D.; Reitz, R.D. Modeling the Effects <strong>of</strong> Particle Drag and Breakup<br />
on Fuel <strong>Spray</strong>s. SAE Technical 1993, 930072.<br />
83. Ibrahim, E.A.; Yang, H.Q.; Przekwas, A.J. Modeling <strong>of</strong> <strong>Spray</strong> Particles Deformation<br />
and Breakup. Journal <strong>of</strong> Propulsion and Power 1993, 9, 4, 651-654.<br />
84. Gorokhavski, M. Stochastic Spectral Relaxation Model <strong>of</strong> Particles Break-Up in Liquid<br />
<strong>Spray</strong> Compuations. 38th Aerospace Sciences Meeting & Exhibt Reno NV 2000,<br />
0198.<br />
85. Gorokhovski, M.; Apte, S. Stochastic Sub-grid Modeling Particle Breakup for LES <strong>of</strong><br />
Atomizing <strong>Spray</strong>. Center for Turbulence Research Annual Research Briefs 2001,<br />
169-176.<br />
86. Amsden, A.A.; Ramshaw, J.D.; O’Rourke, P.; Dukowicz, J.K. KIVA: A Computer<br />
Program for Two-and Three-Dimensional Fluid Flows with Chemical Reactions and<br />
Fuel <strong>Spray</strong>s. Los Alamos Report 1985, 10245.<br />
Yoon – Lagrangian modeling <strong>of</strong> dilute spray 110
87. Clark, M.M. Drop Breakup in a Turbulent Flow-I. Conceptual and Modeling<br />
Considerations. Chemical Engineering Science 1988, 43, 671-679.<br />
88. Georjon, T.L.; Reitz, R.D. A Particle-Shattering Collision Model for Multidimensional<br />
<strong>Spray</strong> Computations. Atomization and <strong>Spray</strong>s 1999, 9, 231-254.<br />
89. Ashgriz, N.; Givi, P. Coalescence Efficiencies <strong>of</strong> Fuel Particles in Binary Collisions.<br />
International Communications in Heat and Mass Transfer 1989, 16, 11-20.<br />
90. Qian, J.; Law, C.K. Regimes <strong>of</strong> Coalescence and Separation in Particle Collision.<br />
Journal <strong>of</strong> Fluid Mechanics 1991, 331, 59-80.<br />
91. Jiang, Y.J.; Umemura, A.; Law, C.K. An Experimental Investigation on the Collision<br />
Behaviour <strong>of</strong> Hydrocarbon Droplets. Journal <strong>of</strong> Fluid Mechanics 1992, 234, 171-190.<br />
92. Estrade, J.P.; Carentz, H. Experimental Investigation <strong>of</strong> Dynamimc Binary Collision <strong>of</strong><br />
Ethanol Droplets - A Model from Droplet Coalescence and Bouncing. International<br />
Journal <strong>of</strong> Heat and Fluid Flow 1999, 20, 486-491.<br />
93. Munnannur, A.; Reitz, R.D. A New Predictive Model for Fragmenting and Nonfragmenting<br />
Binary Droplet Collisions. International Journal <strong>of</strong> Multiphase Flow 2007,<br />
33, 873-896.<br />
94. Rein, M.; Delplanque, J.P. The role <strong>of</strong> air entrainment on the outcome <strong>of</strong> drop impact<br />
on a solid surface. Acta Mechanica 2008, 201, 105-118.<br />
95. Aziz, S.D.; Chandra S. Impact, recoil and splashing <strong>of</strong> molten metal droplets.<br />
International Journal <strong>of</strong> Heat and Mass Transfer 2000, 43, 2841-2857.<br />
96. Mao, T.; Kuhn, D.; Tran, H. Spread and rebound <strong>of</strong> liquid droplets upon impact on flat<br />
surfaces. AICHE Journal 1997, 43, 2169-2179.<br />
97. Mukherjee, S.; Abraham, J. Investigations <strong>of</strong> drop impact on dry walls with a lattice-<br />
Boltzmann model. Journal <strong>of</strong> Colloid and Interface Science 2007, 312, 341-354.<br />
98. Park, H.; Yoon, S.S.; Jepsen, R.A.; Heister, S.D.; Kim, H.Y. Droplet bounce<br />
simulations and air pressure effects on the deformation <strong>of</strong> pre-impact droplets, using<br />
a boundary element method. Engineering Analysis with Boundary Elements 2008,<br />
21, 21-31.<br />
99. Chandra S.; Avedisian C.T. On the collision <strong>of</strong> a droplet with a solid surface.<br />
Proceedings <strong>of</strong> the Royal Society <strong>of</strong> London Series A-Mathematical and Physical<br />
Sciences 1991,432, 13-41.<br />
100. Healy, W.M.; Hartley, J.G.; Abdel-Khalik, S.I. Comparison between theoretical<br />
models and experimental data for the spreading <strong>of</strong> liquid droplets impacting a solid<br />
surface. International Journal <strong>of</strong> Heat and Mass Transfer 1996, 39, 3079-3082.<br />
101. Ford, R.E.; Furmidge, C.G.L. Impact and spreading <strong>of</strong> spray drops on foliar surfaces.<br />
Society <strong>of</strong> Chemical Industry Monograph 1967, 25, 417.<br />
102. Stow, C.D.; Hadfield, M.G. An experimental investigation <strong>of</strong> fluid flow resulting from<br />
the impact <strong>of</strong> a water drop with an unyielding dry surface. Proceedings <strong>of</strong> the Royal<br />
Society <strong>of</strong> London Series A-Mathematical and Physical Sciences 1981, 373, 419-<br />
441.<br />
103. Yang, W.J. Theory on vaporization and combustion <strong>of</strong> liquid drops <strong>of</strong> pure<br />
substances and binary mixtures on heated surfaces. Institute <strong>of</strong> Space and<br />
Aeronautical Science <strong>University</strong> <strong>of</strong> Tokyo Rpt 1975, 535, 423-455.<br />
104. Gong, S. Spreading <strong>of</strong> droplets impacting on smooth solid surface. Japanese<br />
Journal <strong>of</strong> Applied Physics 2005, 44, 3323-3324.<br />
105. Sikalo, S.; Wilhelm, H.D.; Roisman, I.V.; Jakirlic, S.; Tropea, C. Dynamic contact<br />
angle <strong>of</strong> spreading droplets: experiments and simulations. Physics <strong>of</strong> Fluids 2005,<br />
17, 062103.<br />
106. Yarin, A.L.; Weiss, D.A. Impact <strong>of</strong> drops on solid surfaces: self-similar capillary<br />
waves, and splashing as a new type <strong>of</strong> kinematic discontinuity. Journal <strong>of</strong> Fluid<br />
Mechanics 1995, 283, 141-173.<br />
107. Mundo, C.; Sommerfeld, M.; Tropea, C. Droplet-wall collisions: experimental studies<br />
<strong>of</strong> the deformation and breakup process. International Journal <strong>of</strong> Multiphase Flow<br />
1995, 21, 151-173.<br />
108. Cossali, G.E.; Coghe, A.; Marengo, M. The impact <strong>of</strong> a single drop on a wetted solid<br />
surface. Experiments in Fluids 1997, 22, 463-472.<br />
109. Stow, C.D.; Stainer, R.D. The physical products <strong>of</strong> a splashing water drop. Journal <strong>of</strong><br />
the Meteorological Society <strong>of</strong> Japan 1977, 55 (5), 518-531.<br />
110. Marmanis, H.; Thoroddsen, S.T. Scaling <strong>of</strong> the fingering pattern <strong>of</strong> an impacting<br />
drop. Physics <strong>of</strong> Fluids 1996, 8, 1344-1346.<br />
111. Rioboo, R.; Tropea, C.; Marengo, M. Outcomes from a drop impact on solid<br />
surfaces. Atomization and <strong>Spray</strong>s 2001, 11, 155-165.<br />
Yoon – Lagrangian modeling <strong>of</strong> dilute spray 111
112. Xu, L.; Zhang, W.W.; Nagel, S.R. Drop splashing on a dry smooth surface. Physical<br />
Review Letters 2005, 94, 184505.<br />
113. Xu, L. Liquid drop splashing on smooth, rough, and textured surfaces. Physical<br />
Review E 2007, 75, 056316.<br />
114. Kalantari, D.; Tropea, C. <strong>Spray</strong> impact onto flat and rigid walls: empirical<br />
characterization and modeling. International Journal <strong>of</strong> Multiphase Flow 2007, 33,<br />
525-544.<br />
115. Roisman, I.V.; Horvat, K.; Tropea, C. <strong>Spray</strong> impact: rim transverse instability<br />
initiating fingering and splash, and description <strong>of</strong> a secondary spray, Physics <strong>of</strong><br />
Fluids 2006, 18, 102104.<br />
116. Mundo, C.; Sommerfeld, M.; Tropea, C. On the modeling <strong>of</strong> liquid sprays impinging<br />
on surfaces, Atomization and <strong>Spray</strong>s 1998, 8, 625-652.<br />
117. Range, K.; Feuillebois, F. Influence <strong>of</strong> surface roughness on liquid drop impact,<br />
Journal <strong>of</strong> Colloid and Interface Science 1998, 203, 16-30.<br />
Yoon – Lagrangian modeling <strong>of</strong> dilute spray 112
Oliveira, W.P., Souza, C.R.F., Kurozawa, L.E., Park, K.L. <strong>Spray</strong> drying <strong>of</strong> food and<br />
herbal products - Volume 1, Ed. Woo, M.W., Mujumdar, A.S. and Daud, W.R.W., 2010,<br />
ISBN - 978-981-08-6270-1, Published in <strong>Singapore</strong>, pp. 113-156.<br />
<strong>Spray</strong> drying <strong>of</strong> food and herbal products<br />
Chapter 5<br />
Oliveira W.P. 1 , Souza C.R.F. 1 , Kurozawa L.E. 2 , Park K.J. 2<br />
1 <strong>University</strong> <strong>of</strong> São Paulo/FCFRP, Ribeirão Preto, SP, Brazil<br />
2 <strong>University</strong> <strong>of</strong> Campinas/FEAGRI, Campinas, SP, Brazil<br />
Contents<br />
Page<br />
1.0 Introduction 114<br />
2.0 General aspects <strong>of</strong> spray drying 114<br />
3.0 Relevant physical-chemical properties 116<br />
4.0 Quality changes during spray drying 118<br />
5.0 <strong>Drying</strong> aids 120<br />
6.0 <strong>Spray</strong> drying <strong>of</strong> food and herbal products 122<br />
6.1 Fruit pulps 122<br />
6.2 Herbal extracts and nutraceuticals 127<br />
6.3 Microencapsulation <strong>of</strong> essential oils, flavours 132<br />
Oleoresins<br />
6.4 Natural colorants and coloring extracts 136<br />
6.5 <strong>Drying</strong> <strong>of</strong> miscellaneous food products 139<br />
7.0 Final remarks 143<br />
8.0 Nomenclature 144<br />
9.0 References 144<br />
Oliveira, Souza, Kurozawa, Park – Food and herbal products 113
1.0 Introduction<br />
<strong>Spray</strong> drying is a one-step processing operation for turning a liquid feed<br />
into a dried particulate form, by spraying the feed into a hot drying gas medium.<br />
While reduces the product bulk weight and size, spray drying minimizes<br />
handling and also preserves the product by reducing its water activity to a low<br />
level, required to stop bacterial degradation. [1,2] The production <strong>of</strong> dried particles<br />
from a liquid feed in a single processing step makes spray drying an exceptional<br />
and important process.<br />
<strong>Spray</strong> drying is widely applied in several industrial sectors including the<br />
food, pharmaceutical and chemical. Several biological and thermal-sensitive<br />
materials, liquid materials, such as milk, fruit juices and pulps, herbal extracts,<br />
enzymes, essential oils, aromas and various pharmaceuticals have been dried<br />
by this process. [3,4] Its adequacy to process thermal-sensitive materials is mainly<br />
due to the short residence time <strong>of</strong> the product inside the dryer (in the order <strong>of</strong> a<br />
few seconds).<br />
One <strong>of</strong> the most remarkable advantages <strong>of</strong> the spray drying is the capacity<br />
<strong>of</strong> process several kinds <strong>of</strong> materials and the possibility <strong>of</strong> obtain a dried<br />
product with pre-specified properties. These characteristics are particularly<br />
important when we are interested to obtain dried products <strong>of</strong> good quality and<br />
high content <strong>of</strong> healthy enhancing substances, such as the phenolic<br />
compounds, flavonoids, carotenoids and so on.<br />
Nowadays, the consumers are very concerned in the attributed health<br />
benefits <strong>of</strong> the phytochemicals present in the so-called functional foods and<br />
nutraceuticals, including the herbal dried extracts. [5] Several terms have been<br />
used with similar meanings to these products, such as ‘functional foods’,<br />
medical foods, dietary supplements and health foods, but the term nutraceutical<br />
is more frequently used. Nutraceutical can be defined as a food or parts <strong>of</strong><br />
foods that provide medical-health benefits including the prevention and/or<br />
treatment <strong>of</strong> disease. These products may vary from isolated nutrients, dietary<br />
supplements and diets to genetically engineered designed foods, functional<br />
foods, herbal products, and include processed foods such as cereals, soups<br />
and beverages. [6,7] The significantly growing interest <strong>of</strong> this market has forced<br />
the industries to improve the quality control <strong>of</strong> these products in order to<br />
guarantee the stability, efficacy and safety <strong>of</strong> the claimed health promoting<br />
substances.<br />
In this chapter it will be presented some general aspects <strong>of</strong> the use <strong>of</strong><br />
spray drying for drying <strong>of</strong> selected foods and herbal extracts and also for<br />
encapsulation <strong>of</strong> some plant derived products, including essential oils, flavors,<br />
plant pigments and oleoresins.<br />
2.0 General aspects <strong>of</strong> spray drying<br />
<strong>Drying</strong> is generally applied in nutraceutical processing, aiming the<br />
reduction <strong>of</strong> the product water activity to a safe level, which assures its<br />
microbial stability and minimizes physical and chemical changes during storage.<br />
Several drying systems can be employed for dehydration <strong>of</strong> foods and<br />
Oliveira, Souza, Kurozawa, Park – Food and herbal products 114
nutraceuticals, including vacuum drying, convective drying, freeze drying, spout<br />
and fluidized bed dryers, and spray dryers. The selection <strong>of</strong> a particular<br />
equipment depends on the type and properties <strong>of</strong> the material to be processed<br />
as well as the desired product properties.<br />
<strong>Spray</strong> drying is highly suitable for the continuous production <strong>of</strong> dry<br />
powders, granules or other agglomerated products from liquid pumpable<br />
feedings, such as solutions, suspensions and emulsions. The concept <strong>of</strong> spray<br />
drying is based on the high increase in the surface area <strong>of</strong> the contact area<br />
between the material to be dried and the drying medium promoted by the<br />
atomization. Different spray drying configurations exist, which varies in size and<br />
shape <strong>of</strong> the drying chamber, type <strong>of</strong> atomizing devices (rotary atomizers,<br />
pressure nozzles, pneumatic nozzles, ultrasonic devices and so on), air-droplet<br />
contact system (co-current, conter-current and mixed flow), and product<br />
collecting systems. Interesting reviews <strong>of</strong> the spray drying technique, focusing<br />
in hardware and process parameters as well as in current applications on<br />
pharmaceutical technology were presented by Krzyszt<strong>of</strong> and Krzyszt<strong>of</strong>. [8,9] The<br />
design <strong>of</strong> a spray drying process includes the establishment <strong>of</strong> operating<br />
conditions that increase product recovery and produce an end product <strong>of</strong> a predefined<br />
quality specification. [10] The short residence time <strong>of</strong> the product inside<br />
the dryer makes the spray drying suitable for the processing <strong>of</strong> themosensitive<br />
materials, including pharmaceuticals and biological materials. The spray drying<br />
is widely used in the preparation <strong>of</strong> dried powders from extracts <strong>of</strong> medicinal<br />
plants, fruit pulps, plants oleoresins, essential oils, and so on. [11-18]<br />
The variables generally monitored during spray drying include the inlet and<br />
outlet drying gas temperature and humidity and the feed flow rate <strong>of</strong> drying gas<br />
and liquid material. These data can be used to predict and to improve the<br />
efficiency <strong>of</strong> the drying process, through performing mass and energy balances,<br />
statistical analysis and/or process simulations. The thermal efficiency is a<br />
parameter commonly used for process optimization. Higher thermal efficiencies<br />
are obtained when the temperature <strong>of</strong> the effluent gas are closer to their<br />
saturation temperature. However, in most situations the process is guided by<br />
the needs <strong>of</strong> product quality, instead <strong>of</strong> equipment efficiency.<br />
In general, the moisture content <strong>of</strong> spray dried product is directly linked to<br />
the temperature <strong>of</strong> the gas leaving <strong>of</strong> the drying chamber. Lower moisture<br />
content can be obtained through the increasing in the outlet gas temperature<br />
and/or augmenting the product residence time inside drying chamber. The<br />
moisture content has effect on several properties <strong>of</strong> the dried product, such as<br />
product solubility and density. [19] However, the exposure <strong>of</strong> thermosensitive<br />
substances to high temperatures for long time periods can lead to product<br />
degradation. Thus, the control <strong>of</strong> the processing conditions are extremely<br />
important, since the product properties are dependent on the processing<br />
conditions used. [20] Thermosensitive products could be processed under low<br />
pressure and temperatures, and the production <strong>of</strong> particles relatively uniform and<br />
spherical with composition similar to the one present in the infeed can be<br />
achieve. [21]<br />
Oliveira, Souza, Kurozawa, Park – Food and herbal products 115
3.0 Relevant physical-chemical properties<br />
The physical-chemical properties <strong>of</strong> powders produced by spray drying<br />
depend on some process variables, such as the characteristics <strong>of</strong> the liquid feed<br />
(viscosity, flow rate) and <strong>of</strong> the drying air (temperature, pressure), as well as the<br />
type <strong>of</strong> atomizer. The knowledge and understanding <strong>of</strong> powder properties is<br />
essential to optimize processes, functionality, and reduce costs. [22] Properties <strong>of</strong><br />
food powders can be classified as physical or chemical properties. Physical<br />
properties include the particle shape, density and porosity, surface<br />
characteristics, hardness, diameter and size. Chemical properties are related to<br />
the food composition and its interaction with others substances, such as water or<br />
components within the food structure. Instant properties and stickiness<br />
characterize certain processes like dissolution and caking powders, which are<br />
involved in different processing operations (agglomeration, drying, mixing and<br />
storing).<br />
Bulk density and porosity<br />
The knowledge <strong>of</strong> product density is <strong>of</strong> fundamental use for material<br />
properties studies and industrial processes in selecting storage, processing,<br />
packaging and distribution conditions. Bulk density includes the volume <strong>of</strong> the<br />
solids and liquids materials and all porous closed or open to the surrounding<br />
atmosphere, and generally is used to characterize a final product obtained by<br />
milling or drying. [22]<br />
For packaging and shipping considerations, the knowledge <strong>of</strong> bulk density<br />
is very important, because this property shows how much material, by weight,<br />
will fit into a container. Lower bulk density <strong>of</strong> product is not interesting, resulting<br />
in a greater size <strong>of</strong> package. Moreover, the lower the bulk density, the more<br />
occluded air within the powders and, therefore, there was a greater possibility for<br />
product oxidation and reduced storage stability. [23,24] This volume fraction <strong>of</strong> air is<br />
indicated by the porosity, and, generally the internal, external and interparticle<br />
pores <strong>of</strong> food powders provide a high porosity (40 – 80%). [22]<br />
Therefore, it is necessary to know the influence <strong>of</strong> variables on bulk density<br />
<strong>of</strong> a spray dried product. In general, this powder property can be increased with<br />
an increase in the feed rate, solid contents and outlet air temperature. On the<br />
other hand, it can be decreased with increase in inlet air temperature. [25]<br />
Particle size<br />
The particle size is one <strong>of</strong> the most important physical parameters <strong>of</strong><br />
powders with regard to handling. Particle size can influence the flow out <strong>of</strong><br />
storage bins, the blending <strong>of</strong> different components, compaction and the<br />
segregation <strong>of</strong> a mixture, in which smaller particles keep on distributed in the<br />
bottom and greater particles, in the top. In addition, this property significantly<br />
influences essential properties to food products such as smell, texture and<br />
appearance. [26] As particle size decreases, the increase in the particle surface<br />
area causes higher affinity with moisture and ability to agglomeration during the<br />
Oliveira, Souza, Kurozawa, Park – Food and herbal products 116
drying process. Moreover, powders with reduced particles size present low<br />
solubility and flowability. [27]<br />
Generally, in a spray drying system, the size <strong>of</strong> the dried particles depends<br />
on the size <strong>of</strong> the atomized droplets. The droplet size is affected by the<br />
atomization type, physical properties <strong>of</strong> the feed solution and feed solids<br />
concentration. Droplet size usually increases as the feed concentration or<br />
viscosity increases and the energy available for atomization decreases, resulting<br />
in the formation <strong>of</strong> greater particles. [19] During the drying <strong>of</strong> droplets, the drying<br />
rates can affect size <strong>of</strong> particles. <strong>Drying</strong> at conditions that result in faster drying<br />
rates (e.g. high air temperature) produces larger particles than drying under<br />
slower drying conditions. [24] When a particle is subjected to higher drying rates,<br />
there is a rapid formation <strong>of</strong> a dried layer surface. This hardening skin does not<br />
allow the particles shrinking during drying process, resulting in higher particles<br />
sizes.<br />
Particle shape<br />
Particle shape is an important physical property and can affect some<br />
factors, such as flowability <strong>of</strong> powder, packing and interaction with fluids. [22] In<br />
general, powders produced by spray drying present particles with spherical<br />
shape and several sizes. Spherical and smooth particles are desirable owing to<br />
aroma retention (least surface to volume ratios), highest bulk densities (best<br />
packing) and best flowability. [24] On the other hand, surface imperfections, such<br />
as wrinkle, cracks or collapses, occur when there is a slow film formation during<br />
drying <strong>of</strong> atomized droplets. The presence <strong>of</strong> dents has an adverse effect on the<br />
flow properties <strong>of</strong> particles powders. [29] Thus, process conditions that eliminate<br />
or minimize dent formation should be preferred. The shrinkage <strong>of</strong> the particles is<br />
related to the differences in the drying rate, which is higher for higher<br />
temperature, resulting in faster water evaporation and, consequently, causing<br />
formation <strong>of</strong> a smooth and hard crust.<br />
Flowability<br />
Powder flowability is a measure <strong>of</strong> the capacity <strong>of</strong> powders to be flow. This<br />
property is important in many units operations involving flow <strong>of</strong> powders, such<br />
as: pneumatic transport to other equipment or silos, mixing and packaging. The<br />
factors that influence powder flowability are: particle size (lower size, worse<br />
flowability, because there is more surface area or surface contact available for<br />
cohesive forces and frictional forces to resist flow); particle shape (surface<br />
imperfections, such as wrinkle, cracks or dents have an adverse effect on the<br />
flow properties <strong>of</strong> particles powders) and moisture content (high moisture<br />
content leads to poor flowability, due to the increase in liquid bridges and<br />
capillary forces acting between particles). [30]<br />
Stickiness<br />
Stickiness may be defined as the tendency <strong>of</strong> a product to adhere to a<br />
contact surface. [22] <strong>Spray</strong> drying and handling <strong>of</strong> sticky products is difficult,<br />
because the particles tend to sticky together and to the surface <strong>of</strong> materials they<br />
come to contact with, such as wall chamber dryer and cyclones. [31] This fact can<br />
lead to problems related to lower product recovery during spray drying, operating<br />
problems and powder caking. Stickiness in spray dried powders is attributed to<br />
Oliveira, Souza, Kurozawa, Park – Food and herbal products 117
the rapid drying <strong>of</strong> the liquid feed droplets. There is a formation <strong>of</strong> amorphous<br />
particles, which have sticky properties. [32] Sticky powders are more hygroscopic<br />
and less free flowing than nonsticky powders. Some <strong>of</strong> the examples <strong>of</strong> sticky<br />
products are fruit and vegetable juice powders, honey powders and amorphous<br />
lactose powder. [33]<br />
The problem <strong>of</strong> powder stickiness is mainly due to the low glass transition<br />
temperature (Tg) <strong>of</strong> the components with low molecular weight, such as some<br />
sugars (glucose, fructose, sucrose) and organic acids. The glass transition<br />
temperature is defined as the temperature at which an amorphous system<br />
changes from the glassy to the rubbery state. Molecular mobility in the glassy<br />
state is extremely slow, due to the high viscosity <strong>of</strong> the matrix (about 10 12 Pa.s).<br />
The Tg can be taken as a reference parameter to project spray drying systems<br />
and characterize the properties, quality, stability and safety <strong>of</strong> food systems.<br />
Structural alterations, such as stickiness, agglomeration, caking and<br />
crystallization, occur in amorphous food powders when stored and processed at<br />
temperatures above the Tg. Since glass transition temperature increases with<br />
molecular weight, the addition <strong>of</strong> carriers agents (drying aids) has been used in<br />
the production <strong>of</strong> powders, reducing the stickiness and wall deposition in spray<br />
drying. [34,35]<br />
Instant properties<br />
Instant properties <strong>of</strong> spray dried food are related to ability <strong>of</strong> the powder to<br />
dissolve in water. Each particle must be wetted, sunk in the liquid and dissolved.<br />
Therefore, properties such as wettability, sinkability, dispersibility and solubility<br />
are <strong>of</strong> importance for the reconstitution <strong>of</strong> powders. Their definitions are: [4,22,25]<br />
• Wettability: Capacity <strong>of</strong> particles powder to adsorbed water on their<br />
surface. Depends <strong>of</strong> particle size (higher size, lower incidence <strong>of</strong><br />
clumping) and surface composition (presence <strong>of</strong> fat reduces wettability);<br />
• Sinkability: Ability <strong>of</strong> powder to sink below the water surface after it has<br />
been wetted. This property depends on particle density (denser particles<br />
sink faster than light ones);<br />
• Dispersability: Ability <strong>of</strong> powder to be distributed throughout the water,<br />
without formation <strong>of</strong> lumps;<br />
• Solubility: This property refers to the rate and extent to which the<br />
components <strong>of</strong> powder particles dissolve in water. Depends <strong>of</strong> the<br />
chemical composition <strong>of</strong> powder and its physical state.<br />
4.0 Quality changes during spray drying<br />
Significant physical and chemical changes occur during drying <strong>of</strong> a liquid<br />
material. Since most foods, herbal extracts and other biomaterials have a<br />
complex composition these changes can not be described in a simple manner,<br />
and can continue to occur during the product storage. In general terms, drying<br />
is a process during which there is a transition <strong>of</strong> a viscoelastic or liquid material<br />
to a solid form. The dried material may be either a crystalline or an amorphous<br />
Oliveira, Souza, Kurozawa, Park – Food and herbal products 118
solid. [36] Usually, amorphous behavior has been observed in spray dried<br />
materials. [37,38] A mechanism <strong>of</strong> formation <strong>of</strong> amorphous structures in<br />
dehydration and the relationships between equilibrium (solution, crystalline<br />
solid) and nonequilibrium (amorphous solid and liquid) states was proposed by<br />
Roos [39] and is presented in Figure 1. This phenomenon is known to be linked to<br />
glass transition temperatures and environmental conditions. [40]<br />
Figure 1<br />
Formation <strong>of</strong> amorphous structures in dehydration and the<br />
relationships between equilibrium (solution, crystalline solid)<br />
and nonequilibrium (amorphous solid and liquid) states. [39]<br />
During spray drying, the dehydration <strong>of</strong> atomized liquid occurs from the<br />
droplets surface to the inner core. There is an increase in the solutes<br />
concentration at particles surface and a consequently fall in the particle<br />
temperature caused by evaporation. The viscosity <strong>of</strong> this layer <strong>of</strong> concentrated<br />
solutes increases quickly and the particle surface passes to the glassy state<br />
before collide with other particles or with the dryer wall. The fast formation <strong>of</strong><br />
glassy powders during spray drying reduces the cohesion/adhesion interparticles<br />
and between particles and dryer wall, guaranteeing the free flow <strong>of</strong> the<br />
particles inside the drying chamber. At end <strong>of</strong> the process the product<br />
temperature and moisture content should be keep under restrict intervals, in<br />
order to maintain the powdered product at the glassy state. [39]<br />
The temperature at which the transition from glassy to the rubbery state<br />
occurs is defined as the glass transition temperature, Tg. At temperatures higher<br />
than Tg, there are an increase in the mobility <strong>of</strong> the molecules present in the<br />
material, and with the increase in the moisture content due to water absorption,<br />
the material structure could collapse. The type <strong>of</strong> behavior depends on the<br />
material composition. [41] Herbal dried extracts and several fruit products show<br />
propensity to water absorption, which is mainly due to the presence <strong>of</strong> significant<br />
amounts <strong>of</strong> low molecular weight carbohydrates, such as fructose, glucose, and<br />
so on. [42] Thus, the increase in the moisture content could result in dissolution<br />
and/or recrystallization <strong>of</strong> these substances contributing for the physical<br />
Oliveira, Souza, Kurozawa, Park – Food and herbal products 119
degradation <strong>of</strong> the product during storage. [41] These events can cause product<br />
caking. The caking is characterized by the powder solidification due to particleparticle<br />
interaction attributed to Van der Waals, capillary and electrostatic forces<br />
and can occur during stages <strong>of</strong> drying, packing and/or storage.<br />
Losses and/or degradation <strong>of</strong> bioactive compounds are associated with the<br />
spray drying <strong>of</strong> herbal extracts and nutraceuticals, which depend on the<br />
processing stages involved and <strong>of</strong> the composition fed to the dryer (extractive<br />
solutions associated with drying adjuvants). These factors should be optimized<br />
in order to generate a product with concentration <strong>of</strong> marker compounds within<br />
specified intervals.<br />
<strong>Drying</strong> aids (carriers or adjuvants) such as starches <strong>of</strong> corn, manioc and<br />
rice, modified starches, maltodextrins, silicon colloidal dioxide, acacia gum (gum<br />
arabic), cyclodextrins and solid corn syrups are frequently used aiming to<br />
minimize the losses <strong>of</strong> bioactive compounds (acting as encapsulating agent)<br />
and to improve or modify the physical and chemical product properties. The<br />
drying aids can be used alone or in associations, being the ideal composition<br />
established for each specific situation. A concise review <strong>of</strong> some drying aids<br />
frequently used for spray drying is presented following.<br />
5.0 <strong>Drying</strong> aids<br />
<strong>Drying</strong> aids are also known as drying carriers, drying adjuvants, and wall<br />
materials (in microencapsulation). The addition <strong>of</strong> drying carriers to the feed<br />
solution is important in the spray drying process, due to its influence on the<br />
powders properties and product stability. Carbohydrates <strong>of</strong> high molecular<br />
weight such as starch and modified starches, maltodextrins, solid corn syrups,<br />
gum arabic and cyclodextrins are in general used as drying carriers. One <strong>of</strong> the<br />
main function <strong>of</strong> the drying carriers is to increase the glass transition<br />
temperature <strong>of</strong> the product, reducing its stickiness and wall deposition in spray<br />
drying, and its agglomeration tendency during spray drying and storage,<br />
reducing product stickiness and generating a more stable product. [34,35,43]<br />
Following, different types <strong>of</strong> carrier agents used in spray drying <strong>of</strong> foods, herbal<br />
extracts and other nutraceuticals are described.<br />
Starches and modified starches<br />
Starch is one <strong>of</strong> the most common natural polymers, is cheap and has been<br />
commercially extracted from several sources, such as corn, tapioca, potato,<br />
wheat, rice and waxy maize. Starch consists <strong>of</strong> linear amylose and branched<br />
amylopectin, two polysaccharides based on α-(D)-glucose. Both polymers are<br />
organized in a semicrystalline structure, and in the starch granule, amylopectin<br />
forms the crystalline portion. The exact structure <strong>of</strong> starch is not yet fully<br />
understood. Starch is cold water insoluble and, when is mixed with water and<br />
heated, forms pastes with high viscosity. [44] One method used to modify starch is<br />
pyroconversion, in which the starch is heated, usually in the presence <strong>of</strong> acid or<br />
alkali. Partial hydrolysis <strong>of</strong> the starch takes place as well as repolymerization to<br />
form more highly branched polymers. The resulting product is the modified<br />
starches, which have higher cold water solubility and lower solution viscosity<br />
Oliveira, Souza, Kurozawa, Park – Food and herbal products 120
than gelatinized native starch, and can be applied at concentrations up to 50 %,<br />
without substantial increase <strong>of</strong> the feed viscosity. [45]<br />
Maltodextrins and solids corn syrup<br />
Maltodextrins [(C 6 H 10 O 5 ) n H 2 O] are non-sweet saccharide polymers,<br />
obtained by acid or enzymatic hydrolysis <strong>of</strong> starch, consisting <strong>of</strong> D-glucose units<br />
linked primarily by α-1-4 bonds. [44] Hydrolysis <strong>of</strong> starch with acid or enzymes<br />
results in formation <strong>of</strong> maltodextrins. These products are usually classified<br />
according to their dextrose equivalency, DE. [44,46,47] Dextrose equivalent (DE) is<br />
a measure <strong>of</strong> the degree <strong>of</strong> starch polymer hydrolysis and is inversely related to<br />
its average molecular weight. [44] Maltodextrins with DE between 20 and 60 are<br />
generally denoted as solids corn syrup.<br />
The glass transition temperatures <strong>of</strong> maltodextrins increase conversely with<br />
DE, ranging from 100 o C for maltodextrin with DE 36 to 188 o C for products with<br />
DE 5. Consequently, maltodextrins with low DE are mainly used as drying<br />
adjuvant in materials that are difficult to dry, such as sugar rich fruit juices,<br />
flavorings and sweeteners, in order to increase their glass transition<br />
temperature. Products spray dried with these materials as carrier agents are<br />
more free-flowing. The other advantages <strong>of</strong> maltodextrins solutions are: nonsweet,<br />
low viscosity at high solids ratio, excellent cold water solubility and low<br />
cost. [44,48]<br />
Acacia gum (gum arabic)<br />
Gum arabic is the dried gummy exudate obtained from the stems and<br />
branches <strong>of</strong> Acacia senegal (Linné) Willdenow or other species <strong>of</strong> Acacia (Fam.<br />
Leguminosae) that grow mainly in the Sudan and Senegal regions <strong>of</strong> Africa. [49]<br />
There are many acacia species but only few are able to provide the amount <strong>of</strong><br />
gum required for industrial production. Chemically, gum arabic is a complex<br />
heteropolysaccharide with a highly ramified structure, with the main chain<br />
formed <strong>of</strong> D-galactopyranose units, linked by β-D glycosidic bonds (13). The<br />
molecular weight <strong>of</strong> gum arabic ranges from 240000 to 580000. The side chains<br />
with variable chemical structure formed from D-galactopyranose, L-rhamnose, L-<br />
arabin<strong>of</strong>uranose and D-galacturonic acid are linked to the main chain β-(16)<br />
bonds. [46] It has been used as an encapsulating agent in microencapsulation by<br />
spray drying, due to its good emulsifying capacity and low viscosity in aqueous<br />
solution. However, it is very expensive. Acacia is available as white or yellowishwhite<br />
thin flakes, spheroidal tears, granules, powder, or spray dried powder. It is<br />
odorless and has a bland taste. Nowadays, there are a increasing need to find<br />
suitable substitutes for arabic gum, mainly due to unstable social and political<br />
conditions in the Sudan, the main supplier <strong>of</strong> acacia gum. [49,51]<br />
Cyclodextrins<br />
Cyclodextrins (CDs) are extensively used as solubilizing and stabilizing<br />
agent. Cyclodextrins are crystalline, nonhygroscopic, cyclic oligosaccharides<br />
obtained by enzymatic degradation <strong>of</strong> the starch due to the action <strong>of</strong> the<br />
enzyme cyclodextrin glycosiltransferase (CGT-ase). Among the most commonly<br />
used forms (α, β and γ-cyclodextrin, which have respectively 6, 7 and 8 glucose<br />
units, there are several cyclodextrin derivatives, such as dimethyl-βcyclodextrin,<br />
2-hydroxyethyl-β-cyclodextrin, and trimethyl-β-cyclodextrin. [49]<br />
Oliveira, Souza, Kurozawa, Park – Food and herbal products 121
Cyclodextrins are ‘bucketlike’ or ‘conelike’ toroid molecules, with a rigid<br />
structure and a central cavity, which size depend on the cyclodextrin type. Due<br />
to the arrangement <strong>of</strong> hydroxyl groups within the molecule, the internal surface<br />
<strong>of</strong> the cavity is hydrophobic and the outside <strong>of</strong> the torus is hydrophilic, permiting<br />
the cyclodextrin to accommodate a guest molecule within the cavity, forming an<br />
inclusion complex. The formation <strong>of</strong> inclusion complex alters significantly the<br />
characteristics <strong>of</strong> the host molecule, changing its chemical reactivity, improving<br />
product solubility, fixing volatile substances, and stabilizing substances sensible<br />
to heat, light, and oxidation. [52-54]<br />
The flip side <strong>of</strong> any CFD simulation is model validation, which is a big<br />
challenge in spray drying due to the harsh conditions within the chamber which<br />
make local measurements extremely difficult- even impossible. The task is<br />
further complicated with the presence <strong>of</strong> droplets or particles which might foul<br />
measurement equipments inserted into the chamber. This section aims to<br />
introduce the current validation method available and also some <strong>of</strong> the<br />
experimental data available for comparison.<br />
6.0 <strong>Spray</strong> drying <strong>of</strong> selected food & herbal products<br />
In this section is presented a revision about the drying <strong>of</strong> several foods and<br />
plant derived products, including fruit pulps, herbal extracts, natural colorants,<br />
and the microencapsulation <strong>of</strong> essential oils and oleoresins.<br />
6.1 Fruit pulps<br />
In tropical and subtropical countries, a large amount <strong>of</strong> fruits and<br />
vegetables are produced, which are very attractive from <strong>of</strong> commercial point <strong>of</strong><br />
view. However, nowadays, changes in food consumption can be noted.<br />
Consumers have been looking for healthier and more natural foodstuffs in order<br />
to have a balanced and nutritious diet. In this context, consumers have been<br />
encouraged to increase their daily intake <strong>of</strong> fruits and vegetables since their<br />
nutritional value as sources <strong>of</strong> vitamins and minerals is recognized. However, in<br />
association with the seasonal shortages, most <strong>of</strong> these products present high<br />
water content, making them more susceptible to decomposition by<br />
microorganisms, to chemical and enzymatic reactions. These products are<br />
extremely perishable and it is difficult to be marketed or exported as fresh<br />
produce, and therefore has to be processed in order to improve their shelf life<br />
and prevent post-harvest losses.<br />
In the last few decades, novel processed fruit products have been<br />
introduced onto the market. In order to be competitive and to provide more<br />
convenience, food safety, healthy benefits and sensory quality, food industry<br />
have been developed new products to satisfy emerging consumer demands and<br />
to increase pr<strong>of</strong>itability. Therefore, an increasing demand for fruit juices has<br />
been observed, but most <strong>of</strong> consumers do not have time to spend in preparing<br />
them, requiring ready-to-use or easy-to-prepare products.<br />
Oliveira, Souza, Kurozawa, Park – Food and herbal products 122
Juices, nectars and frozen pulps are the principal products obtained from<br />
the fruits. Juices and nectars are costly to transport, because <strong>of</strong> their high<br />
volume, and frozen pulps require the additional cost related to an adequate cold<br />
chain. Juice powders are interesting exportation products, at the same time<br />
being cheap to transport and with a prolonged shelf life.<br />
Fruit and vegetable powders provide a stable, natural, easy dosing<br />
ingredient which generally finds consumers in many foods and pharmaceutical<br />
products such as flavoring and coloring agents. Among the several drying<br />
methods, spray drying is a process widely used to produce fruit juices powders<br />
and involves both particle formation and drying, where the feed is transformed<br />
from the fluid state into droplets and then into dried particles, by spraying it<br />
continuously into a hot drying medium. [55]<br />
However, fruit juice powders may have problems in their properties, such<br />
as stickiness and hygroscopicity, due to the presence <strong>of</strong> low molecular weight<br />
sugars and acids. These components are present in high proportion (90 % <strong>of</strong> dry<br />
substances) in juices and consist <strong>of</strong> different hydrocarbons such as<br />
monosaccharides (glucose, fructose), disaccharides (sucrose), polysaccharides<br />
and organics acids. [56] The Tg values <strong>of</strong> pure fructose, glucose and sucrose are<br />
5, 31 and 62 °C, respectively, and, for pure malic, citric and tartaric acids, are<br />
11.03, 15.73 and 20.57 °C, respectively. [35,57] These temperatures values are<br />
much lower than the normal operating temperatures in spray drying. [31] Thus,<br />
they can stick on the dryer chamber wall during drying, leading to low product<br />
yield and operating problems. Moreover, structural alterations, such as<br />
stickiness, agglomeration, caking and crystallization, occur in amorphous food<br />
powders when stored at temperatures above the Tg. [34,35,58-61]<br />
Since the Tg increases with molecular weight, part <strong>of</strong> these problems can<br />
be solved by the addition <strong>of</strong> some carrier agents, like polymers and gums to the<br />
product before drying. The addition <strong>of</strong> these carrier agents reduces powder<br />
hygrocopicity and stickiness, increasing product recovery during spray drying.<br />
Tonon et al. [62] , working with spray drying <strong>of</strong> açai pulp (Euterpe oleraceae<br />
Mart.), observed that the increase on maltodextrin 10 DE concentration (10 to 30<br />
%) caused a reduction on powder hygroscopicity (about 16 to 12.5 g <strong>of</strong> adsorbed<br />
water/100g solids) at inlet air temperature <strong>of</strong> 160 °C and feed flow rate <strong>of</strong> 15<br />
g/min. Similar behavior was observed by Oliveira et al. [63] when studied the effect<br />
<strong>of</strong> drying aid (maltodextrin 10 DE and cashew tree gum) concentration on<br />
cashew apple juice powder hygroscopicity. Papadakis et al. [64] compared<br />
different average molecular weights <strong>of</strong> maltodextrin (6, 12 and 21 dextrose<br />
equivalent - DE) on the hygroscopicity <strong>of</strong> raisin juice powder. From their results,<br />
they concluded that as the DE decreased, the hygroscopicity increased, since<br />
the lower molecular weight maltodextrins contain shorter chains and more<br />
hydrophilic groups. Moreover, these authors verified that an increase in the<br />
maltodextrin concentration (from 33/67 to 50/50, raisin juice solids/maltodextrin<br />
solids ratio) resulted in an increase <strong>of</strong> the recovery <strong>of</strong> feed solids in the powder<br />
(43 to 73 %, 51 to 73 % and 56 to 74 % for maltodextrin with 21 DE, 12 DE and<br />
6 DE, respectively), showing that the problem <strong>of</strong> stickiness in the drying chamber<br />
was overcome through the use <strong>of</strong> maltodextrin. During spray drying <strong>of</strong> lime juice,<br />
the stickiness problem was only overcome with the use <strong>of</strong> drying additives,<br />
mainly due to low glass transition temperature <strong>of</strong> the product. [56] To solve this<br />
problem and produce free-flowing powder, silicon dioxide and maltodextrin 5 DE<br />
Oliveira, Souza, Kurozawa, Park – Food and herbal products 123
were used as drying carriers. Their investigation revealed that an addition <strong>of</strong><br />
silicon dioxide and maltodextrin to lime juice (lime juice-soluble solids:additives<br />
ratio <strong>of</strong> 70/30) is the optimum amount for a complete and successful drying <strong>of</strong><br />
this product. When the ratio was 80/20, the powders were produced but<br />
deposited on the cone wall and were a little sticky. <strong>Spray</strong> drying behavior <strong>of</strong><br />
orange juice concentrate with several levels <strong>of</strong> maltodextrin 6 DE was studied by<br />
Shrestha et al. [61] The use <strong>of</strong> 50 % maltodextrin concentration did not help in<br />
spray drying <strong>of</strong> the orange juice (only 20 % powder was recovery) and its<br />
powder was sticky. The recovery <strong>of</strong> orange juice powder increased as the<br />
amount <strong>of</strong> maltodextrin in powders increased.<br />
Besides reducing powders hygroscopicity, such agents, normally used for<br />
microencapsulation, can protect sensitive food components against unfavorable<br />
ambient conditions, mask or preserve flavors and aromas, reduce the volatility<br />
and reactivity and provide additional attractiveness for the merchandising <strong>of</strong> food<br />
products. [28] <strong>Spray</strong> drying <strong>of</strong> immature acerola juice, using maltodextrin 25 DE,<br />
gum arabic or a mixture <strong>of</strong> both as carrier agents, showed that these<br />
components <strong>of</strong>fered equivalent contributions to the powder physical stability [66] .<br />
Oliveira et al., [63] working with spray drying <strong>of</strong> cashew apple juice using<br />
maltodextrin and cashew tree gum as aid drying, observed that ascorbic acid<br />
retention was increased from 72 % to 95 % by increasing drying aid:juice ratio<br />
from 3 to 5.<br />
Other alternatives can also be tried to reduce stickiness problems such as<br />
using appropriate outlet drying air temperature, introducing <strong>of</strong> cold air into the<br />
bottom part <strong>of</strong> the dryer, dehumidifying the drying gas or cooling <strong>of</strong> the dryer<br />
wall. Introduction <strong>of</strong> cooling air at the lower part <strong>of</strong> the dryer chamber results in<br />
the formation <strong>of</strong> a solid particle surface, reducing the stickiness <strong>of</strong> the powder<br />
particles. However, only a limited amount <strong>of</strong> air can be introduced because the<br />
cooling process will raise the air relative humidity, which can once again<br />
aggravate the situation. [43,67] Other authors have dehumidified the inlet air by<br />
taking it into an absorption air dryer. [68] This method reduced residue<br />
accumulation <strong>of</strong> tomato juice powder on the cone walls and allowed the product<br />
to be dried at lower outlet air temperatures. On other work, Goula and<br />
Adamopoulos [33] investigate the influence <strong>of</strong> maltodextrin addition on the<br />
stickiness during spray drying <strong>of</strong> tomato pulp in dehumidified air. The product<br />
recovery (80 – 90 %) obtained by these authors were much higher than those<br />
reported by others researchers, who added maltodextrins to sugar-rich foods.<br />
This difference, according to the authors, occurs due to the lower outlet air<br />
temperature and higher drying rates when dehumidified air is used. It was<br />
concluded that this combination (maltodextrin addition and use <strong>of</strong> dehumidified<br />
air) can be the solution <strong>of</strong> the wall depositions during spray drying <strong>of</strong> tomato<br />
pulp. An overview in the literature shows several other studies on spray drying <strong>of</strong><br />
different kinds <strong>of</strong> fruit pulps. A resume <strong>of</strong> some studies are shown in Table 1.<br />
Oliveira, Souza, Kurozawa, Park – Food and herbal products 124
Table 1 Selected studies on spray drying <strong>of</strong> fruit pulps<br />
Pulp fruit <strong>Spray</strong> drying conditions Carrier agent Ref.<br />
Laboratory-scale spray dryer:<br />
T in = 130 - 200°C<br />
T out = 75 –- 100°C<br />
m& = 64 kg/min<br />
Apricot, blackcurrant<br />
and raspberry<br />
Cactus pear<br />
(Opuntia<br />
streptacantha)<br />
air<br />
Evaporative capacity = 3.5 kg/h<br />
Leaflash 100 spray dryer:<br />
T in = 160 - 250°C<br />
T out = 90 - 100°C<br />
m& = 83 kg/min<br />
air<br />
Evaporative capacity = 7 kg/h<br />
Laboratory scale spray dryer<br />
T in = 138 - 202°C<br />
Açai (Euterpe<br />
T out = 82 - 114°C<br />
oletaceae Mart.)<br />
m& feed = 5 - 25 g/min<br />
Atomization pressure = 0.06 MPa<br />
T<br />
Apple<br />
in = 150°C<br />
T out = 65°C<br />
T in = 140 - 160°C<br />
Bayberry (Myrica T out = 65 - 85°C<br />
rubra Sieb. Et Zucc) T feed = 50°C<br />
V & feed = 30 ml/min<br />
T in = 205 and 225°C<br />
Atomization pressure = 0.1 and 0.2<br />
MPa<br />
pear<br />
ficus-<br />
Cactus<br />
(Opuntia<br />
indica)<br />
Camu-camu<br />
(Myrciaria dúbia)<br />
Cashew apple<br />
Durian (Durio<br />
zibethinus)<br />
Guava (Psidium<br />
guajava L.)<br />
Immature acerola<br />
(Malpighia<br />
emarginata)<br />
to continue<br />
V & feed<br />
= 20 ml/min<br />
T in = 165°C<br />
T out = 90°C<br />
T in = 100 - 160°C<br />
T out = 85°C<br />
V & feed = 25 - 30 ml/min<br />
T in = 185°C<br />
T out = 90°C<br />
V & feed = 840 ml/h<br />
T in = 160°C<br />
T out = 85°C<br />
T in = 160°C<br />
T out = 80°C<br />
T in = 120°C<br />
T out = 80 - 82°C<br />
V & = 3 - 3.5×10 -5 m 3 /s<br />
feed<br />
Maltodextrins 6 DE, 12 DE<br />
and 19 DE<br />
[34]<br />
Maltodextrin 10 DE [62]<br />
Maltodextrin 6 DE [31]<br />
Maltodextrins 12 DE and 19<br />
DE<br />
Maltodextrins 10DE and<br />
20DE<br />
[69]<br />
[70]<br />
Maltodextrin 18-20 DE [71]<br />
Arabic gum and maltodextrin<br />
10DE<br />
Maltodextrin 10DE and<br />
cashew tree gum<br />
[72]<br />
[63]<br />
Not used [73]<br />
Maltodextrins 9-12DE and<br />
15-19.9DE<br />
Gum Arabic and<br />
maltodextrin 25DE<br />
[74]<br />
[66,75]<br />
Oliveira, Souza, Kurozawa, Park – Food and herbal products 125
continuation<br />
Lime<br />
T in = 135 - 160°C<br />
T out = 59 - 63°C<br />
m& = 3.7 kg/min<br />
feed<br />
T feed = 25°C<br />
m& = 317 kg/h<br />
air<br />
Maltodextrin 5 DE and<br />
silicon dioxide<br />
Atomizer speed = 5.000 rpm<br />
T in = 160°C<br />
Mango<br />
T out = 70 - 75°C<br />
V &<br />
Maltodextrin 20 DE, gum<br />
feed = 10 ml/min<br />
[76]<br />
Arabic and starch waxy<br />
V & air = 0.7 m 3 /min<br />
T in = 110 - 190°C<br />
V &<br />
Maltodextrin, liquid<br />
feed = 150 - 450 ml/min<br />
glucose<br />
and [77]<br />
Atomizer speed = 10.000 – 25.000 methylcellulose<br />
rpm<br />
Orange T in = 160°C<br />
V & feed variable to maintain T out <strong>of</strong><br />
65°C<br />
Maltodextrin 6DE [65]<br />
T feed = 50°C<br />
Atomizer speed = 20.000 rpm<br />
T in = 190°C<br />
T out = 90°C<br />
m& feed = 0.18 kg/min<br />
Maltodextrin 10DE [78]<br />
Pineapple<br />
Atomizer speed = 25.000 - 35.000<br />
rpm<br />
T in = 150°C<br />
T out = 65°C<br />
Maltodextrin 6DE [67]<br />
Atomizer speed = 20.000 rpm<br />
Pomegranate T in = 130°C<br />
Maltodextrins 10DE, gum<br />
(Punica granatum T feed = 20°C<br />
L.)<br />
V &<br />
Arabic, waxy starch and [79]<br />
= 600 L/h<br />
microcrystalline cellulose<br />
Raisin<br />
Tomato<br />
Watermelon<br />
(Citrulus lanatus)<br />
air<br />
T in = 110 - 200°C<br />
T out = 86 - 115°C<br />
V & feed = 8.2 - 15 ml/min<br />
Atomizer speed = 10.000 - 25.000<br />
rpm<br />
T in = 130 - 150°C<br />
T feed = 32°C<br />
m& = 1.75 g/min<br />
feed<br />
V & air = 22.75 m 3 /h<br />
T in = 110 - 140°C<br />
T feed = 32°C<br />
m& = 1.75 g/min<br />
feed<br />
V & air = 17.50 and 22.75 m 3 /h<br />
V & compressed air = 500 - 800 L/h<br />
T in = 130 - 160°C<br />
V & feed = 8 - 16 ml/min<br />
V & air = 630 - 800 cm 3 /s<br />
Atomizer speed = 25.000 - 35.000<br />
rpm<br />
T in = 145 - 175°C<br />
T feed = 20°C<br />
Maltodextrins 6DE, 12DE<br />
and 21DE<br />
Maltodextrins 6DE, 12DE<br />
and 21DE<br />
[64]<br />
[33]<br />
[56]<br />
Not used [19,68,80,81]<br />
Not used [82]<br />
Maltodextrin 10DE [83]<br />
Oliveira, Souza, Kurozawa, Park – Food and herbal products 126
6.2 Herbal extracts and nutraceuticals<br />
Vegetable materials are the source <strong>of</strong> many phytochemicals compounds,<br />
many <strong>of</strong> which with proved healthy enhancing and therapeutic properties.<br />
Depending on the region, these plant derived products can be classified by<br />
using several terms such as botanicals, functional foods, nutraceuticals,<br />
medical food, dietary supplements and health foods. The food companies<br />
favored the term functional foods and nutritional foods, approaching the<br />
discussion from a nutritional concept. In the other hand, the pharmaceuticals<br />
companies prefer medical foods, nutraceuticals, and functional foods, and<br />
approach the topic from a medicinal point <strong>of</strong> view. The term nutraceutical,<br />
resulted from the combination <strong>of</strong> the words “nutrition” and “pharmaceutical” is<br />
widely used. This discussion falls outside <strong>of</strong> the scope <strong>of</strong> this chapter, but is well<br />
covered in the recent literature. [6,84]<br />
Phytochemicals are secondary metabolites synthesized by plants including<br />
carotenoids, phenolics, alkaloids, terpenes, sterols, saponins, nitrogencontaining<br />
compounds, and organosulfur compounds. [85] Secondary metabolites<br />
are organic substances not directly essential for the normal plant life, but are<br />
but may be useful for the plant as a whole. Phenolics and carotenoids are the<br />
most studied phytochemicals, and involve substances as phenolic acids,<br />
flavonoids, stilbenes, coumarins, tannins, lycopene, curcumin, β-carotene,<br />
lutein, and so on. Several <strong>of</strong> these compounds can exhibit potent biological<br />
properties such as antioxidant, antimicrobial, anti-inflammatory, and antitumoral,<br />
which are promising to be exploited in the pharmaceutical, food and<br />
cosmetics industries. Polyphenols are found in many dietary plant products,<br />
including fruits, vegetables, beverages, herbs, and spices. [86]<br />
In the last few decades, the world demand for plant derived products has<br />
increased significantly. The phenomenal growth in the use <strong>of</strong> phytochemicals as<br />
functional and nutraceutical foods has forced the food and pharmaceutical<br />
industry to control the quality <strong>of</strong> those claiming to be health promoting<br />
ingredients in terms <strong>of</strong> efficacy and safe. [87]<br />
Nowadays, the herbal and nutraceutical processing sectors are moving<br />
more and more toward commercialization <strong>of</strong> standardized extracts, or dried<br />
extract that is manufactured to a specified phytochemical concentration (also<br />
known as marker concentration). Thus, the production <strong>of</strong> standardized dried<br />
extracts represents a field in expansion, since the current tendency <strong>of</strong> the<br />
pharmaceutical industry is the substitution <strong>of</strong> traditional fluid forms by dry plants<br />
extracts. Among the reasons in favor <strong>of</strong> this tendency, the following should be<br />
highlighted: greater concentration, stability and easy <strong>of</strong> standardization <strong>of</strong> the<br />
bioactive compounds; ease <strong>of</strong> transportation; reduced space required for<br />
product storage; and lower risk <strong>of</strong> microbial contamination.<br />
Herbal dried extracts are much better adapted to the demands <strong>of</strong> modern<br />
therapeutic practice, given the ease <strong>of</strong> standardization and handling, which<br />
contribute to guaranteeing the homogeneity <strong>of</strong> pharmaceutical preparations. In<br />
the pharmaceutical sector, dried extracts are used in the preparation <strong>of</strong> pills,<br />
capsules, granulates, ointments and as intermediary products. Dried extracts<br />
can be prepared from the dehydration <strong>of</strong> a concentrated extractive solution from<br />
Oliveira, Souza, Kurozawa, Park – Food and herbal products 127
herbal materials (leaves, roots, seeds, whole plant, inflorescence, fruits, etc.),<br />
resulting in a dried powder. Several drying techniques can be used including<br />
freeze-drying, spray drying and spouted bed drying. [89-97] Nevertheless, the<br />
operating conditions used in the drying and thermal processing <strong>of</strong> bioproducts<br />
like herbal dried extracts and nutraceuticals, might have a considerable impact<br />
on the properties and cost <strong>of</strong> the product, generating different degrees <strong>of</strong> loss <strong>of</strong><br />
[87, 96]<br />
active compounds.<br />
<strong>Spray</strong> dryers are traditionally used in the herbal processing industries. This<br />
equipment is widely used in industrial processes involving the generation and<br />
drying <strong>of</strong> small liquid droplets. Dry fine powders, granulates or agglomerates<br />
can be continually produced by the drying <strong>of</strong> solutions, emulsions or<br />
suspensions. The spray drying process basically consists <strong>of</strong> the atomization <strong>of</strong><br />
a diluted solid-fluid mixture in a heated gaseous current that promotes solvent<br />
evaporation, leading to a dry product. The quality <strong>of</strong> the powder obtained<br />
depends on the processing variables and operating conditions used. The final<br />
moisture content, solubility and apparent density are <strong>of</strong> fundamental<br />
importance. In general, the products obtained by spray drying are more soluble<br />
and concentrated. [4]<br />
Since most <strong>of</strong> the dried extracts and nutraceuticals are intended for oral<br />
administration, there are acceptable limits <strong>of</strong> bacterial contamination. Remili et<br />
al. [98] studied the microbial contamination <strong>of</strong> spray dried extracts <strong>of</strong> medicinal<br />
plants and the process effects on product quality. The authors reported that,<br />
qualitatively, the spray dried extracts present low microbial contamination.<br />
However, the total viable bacterial content remained relatively high, exceeding<br />
10 3 CFU/g (colony-forming units per gram) in 35 out <strong>of</strong> 82 <strong>of</strong> the samples<br />
analyzed.<br />
The occurrence <strong>of</strong> stickiness (adhesion or cohesion) is a common problem<br />
during drying <strong>of</strong> herbal extracts. This issue has been extensively investigated<br />
for foodstuffs and occurs more frequently for materials with a high concentration<br />
<strong>of</strong> sugars. [40] Medicinal plant extracts in general contains higher amounts <strong>of</strong><br />
sugars, carbohydrates and organic acids. [42] Due to the significant presence <strong>of</strong><br />
reducing sugars, the addition <strong>of</strong> drying aids to the extractive solution before<br />
drying is almost mandatory, in order to improve the product properties and<br />
drying performance. The drying aids should have chemical inertia, innocuously,<br />
and thermal stability. [89] <strong>Drying</strong> aids that are widely used in the dehydration<br />
process <strong>of</strong> herbal extracts include: corn, cassava and rice starches, modified<br />
starches, maltodextrins, colloidal silica, gum arabic, cyclodextrins, and κ-<br />
carrageenan. These compounds can be used for drying processes alone or in<br />
association, such that the ideal proportions should be established for each<br />
specific case, both in terms <strong>of</strong> the extract composition and drying method used.<br />
De Paula et al. [99] studied three combinations <strong>of</strong> drying aids, namely<br />
colloidal silicon dioxide alone, and its combination with microcrystalline cellulose<br />
and β-cyclodextrin at 1:1 ratio during the production <strong>of</strong> spray dried extracts <strong>of</strong><br />
Achyrocline satureioides (marcela). Twenty percent <strong>of</strong> polysorbate 80 plus 80 %<br />
<strong>of</strong> drying aid relative to solid contents were added to 80 mL <strong>of</strong> water and<br />
homogenized under magnetic stirring. Then, 100 g <strong>of</strong> extractive solution were<br />
added to the drying aid suspension and the resulting formulations were<br />
concentrated under reduced pressure at temperature lower than 50 o C until 40<br />
% <strong>of</strong> the initial mass <strong>of</strong> the extractive solution. The masses <strong>of</strong> the concentrated<br />
Oliveira, Souza, Kurozawa, Park – Food and herbal products 128
extracts were completed with distilled water to 50 g, and spray dried in a Büchi<br />
mini spray dryer at a feed flow rate <strong>of</strong> extractive solution <strong>of</strong> 3.0 mL/min, and inlet<br />
and outlet temperatures <strong>of</strong> drying gas <strong>of</strong> 150 – 160 o C and 95 – 96 o C,<br />
respectively. The powdered extracts were incorporated in an ointment base,<br />
and it was evaluated the effects <strong>of</strong> the drying aids used on ointment properties<br />
such as spreadibility, oleosity index, viscosity, and pH. Although all<br />
compositions evaluated maintained its plastic behavior, the drying aids showed<br />
effects on the physical parameters at different levels. The use <strong>of</strong> colloidal silicon<br />
dioxide alone promoted a small oleosity index and an intermediary spreadibility.<br />
The substitution <strong>of</strong> part <strong>of</strong> the colloidal silicon dioxide by microcrystalline<br />
cellulose or β-cyclodextrin increased the oleosity index and improved the<br />
ointment spreadibility.<br />
Gum arabic and aerosil ® 200 were evaluated as drying aid for preparation<br />
<strong>of</strong> spray dried extracts <strong>of</strong> Fraxinus excelsior. [101] The liquid extracts were<br />
obtained by steeping 570 g <strong>of</strong> dried leaves in 10 L <strong>of</strong> boiling water (E1) or 710 g<br />
<strong>of</strong> dried leaves in 10 L <strong>of</strong> boiling 70 % ethyl alcohol (E2) for 1 h, followed by<br />
filtration. The aqueous extract was spray dried in presence <strong>of</strong> 88 g (dry weight)<br />
<strong>of</strong> gum arabic, and the alcoholic extract in presence <strong>of</strong> 80 g (dry weight) <strong>of</strong><br />
Aerosil 200. The spray drying was carried out in a Niro Atomizer (type Minor),<br />
with turbine drive and countercurrent flow regime at inlet temperature <strong>of</strong> the<br />
drying gas <strong>of</strong> 130 – 140 o C, and outlet drying gas temperature <strong>of</strong> 65 – 70 o C.<br />
The dried product showed physicochemical, organoleptic and pharmacological<br />
properties good enough to qualify them as useful medicinal products. The<br />
product obtained from the hydroalcoholic extract appeared to be superior<br />
compared to the originated from the aqueous extract. Thin-layer<br />
chromatograms showed no effect <strong>of</strong> the spray drying on marker compounds<br />
present in the extractive solutions. The addition <strong>of</strong> drying aids improved the<br />
product shelf life.<br />
An evaluation <strong>of</strong> the spray drying performance and product properties<br />
during spray drying <strong>of</strong> Bauhinia forficata Link extracts was presented by Souza<br />
and Oliveira. [101] The extractive solution was obtained from dried and powdered<br />
Bauhinia forficata leaves placed in contact with an ethanol:water solution (70:30<br />
in weight) at temperature <strong>of</strong> 50 o C. The extraction time was 1 h at the stirring<br />
rate <strong>of</strong> 200 rpm. The extract was filtered under vacuum and concentrated three<br />
times in a rotary evaporator (vacuum pressure <strong>of</strong> 600 mmHg and 50 o C), and its<br />
density, solids concentration, alcohol, and total flavonoid contents were<br />
determined. The concentrated extractive solution were added with 80 % <strong>of</strong><br />
colloidal silicon dioxide (Tixosil ® 333, related to solid contents), and submitted to<br />
drying in a SD-05 spray dryer (Lab-plant, Huddersfield, UK). The spray drying<br />
variables were: the inlet gas temperature (80 and 150 o C), the ratio <strong>of</strong> the mass<br />
feed flow rate <strong>of</strong> the concentrated extract to the evaporation capacity <strong>of</strong> the dryer<br />
(15, 45, 75, and 100 %), and the feed flow rate <strong>of</strong> the drying gas (0.0118,<br />
0.0168, and 0.0227 kg/s). The atomizing air feed flow rate was fixed at 15 L/min<br />
at a pressure <strong>of</strong> 1 bar. Significant impact <strong>of</strong> the spray drying conditions on<br />
product properties and on dryer performance during production <strong>of</strong> standardized<br />
dried extract <strong>of</strong> Bauhinia forficata was observed, confirming the real need for<br />
more research focused on this theme. In general, the drying conditions that give<br />
an end product with the desired specification are not linked with the optimal<br />
dryer performance. Therefore, product quality and system behavior should be<br />
Oliveira, Souza, Kurozawa, Park – Food and herbal products 129
taken in account simultaneously during optimization <strong>of</strong> drying conditions for<br />
production <strong>of</strong> dried extracts <strong>of</strong> medicinal plants.<br />
A comparison <strong>of</strong> the spray and spouted-bed dryer performance and the<br />
physicochemical product properties during drying <strong>of</strong> hydro-alcoholic extracts <strong>of</strong><br />
three plants used in the Brazilian traditional medicine: Passiflora alata, Bauhinia<br />
forficata, and Maytenus ilicifolia was present by Oliveira et al. [102] Extractive<br />
solutions from the three plants studied, were obtained by placing dried and<br />
milled plant leaves in contact with ethanol:water mixtures for 1 hour. The ratio<br />
between plant to solvent mass were at at 1:5 for Bauhinia forficata and<br />
Passiflora alata, and 1:6 for Maytenus ilicifolia. The extraction temperatures<br />
were respectively 50, 70 and 60 o C. The extractive solutions were filtered<br />
vacuum filtration system and concentrated in a rotary evaporator (vacuum<br />
pressure <strong>of</strong> 600 mmHg and 50 o C) until to achieve a solid contents <strong>of</strong> 9 %.<br />
Colloidal silicon dioxide (Tixosil ® 333, Rhodia, São Paulo, Brazil) was added<br />
to the concentrated extracts before the drying to improve the process<br />
performance (40 % <strong>of</strong> the solid contents for the extracts <strong>of</strong> Passiflora alata and<br />
Maytenus ilicifolia and 80 % for the Bauhinia forficata extract). The final<br />
compositions were submitted spray and spouted bed drying at optimized<br />
processing conditions. The spouted bed gave an end product with higher<br />
concentration <strong>of</strong> the chemical markers and lower moisture content compared to<br />
the spray dried product; even both processes working at similar relation liquid to<br />
drying gas ratio and inlet gas temperatures. Both dryers produced free-flowing<br />
polydisperse powdered particles within a limited range (0 to 30 µm). The spouted<br />
bed leads to the formation <strong>of</strong> irregular particles with flake shapes, whereas a<br />
high proportion <strong>of</strong> near rounded particles were obtained in the spray dryer.<br />
The literature shows several other examples <strong>of</strong> the spray drying <strong>of</strong> herbal<br />
extracts <strong>of</strong> several plant species. [103-109] Table 2 presents a brief review <strong>of</strong> some<br />
studies reported. The losses <strong>of</strong> volatile compounds (ex. flavors and essential<br />
oils) are another problem that could occur during the drying <strong>of</strong> herbal extracts,<br />
mainly derived from aromatic plants. High losses <strong>of</strong> total phenol and flavonoid<br />
contents were observed during spray and spouted bed drying <strong>of</strong> Rosmarinus<br />
<strong>of</strong>ficinalis extracts added with a blend <strong>of</strong> colloidal silicon dioxide (Tixosil 333 ® )<br />
and maltodextrin DE 14 at a 40:20 ratio (related to the solid contents in the<br />
extract). [110] In these situations, the correct selection <strong>of</strong> drying adjuvants<br />
associated to microencapsulation techniques are valuable tools in the<br />
minimization the losses <strong>of</strong> volatiles during dehydration <strong>of</strong> extracts from aromatic<br />
plants. Some aspects <strong>of</strong> the microencapsulation <strong>of</strong> essential oils, flavors and<br />
oleoresins during spray drying will be covered in the next section.<br />
Oliveira, Souza, Kurozawa, Park – Food and herbal products 130
Table 2<br />
Selected studies on spray drying <strong>of</strong> herbal exrtacts<br />
Material <strong>Spray</strong> drying parameters <strong>Drying</strong> carriers Main findings Ref.<br />
Lab-Plant SD-05<br />
T in = 70, 110 and 150 °C<br />
⋅<br />
V& feed<br />
/ V = 24, 36 and 48 %<br />
max<br />
Pinneaple<br />
[105]<br />
stem extract<br />
Soybean<br />
extract<br />
m • air = 0.0227 kg/s<br />
P at = 2 kgf/cm 2<br />
V & = 1.20 m 3 /h<br />
at<br />
Cs = 11.46 % m/m<br />
Lab-Plant SD-05<br />
T in = 80, 115 and 150 °C<br />
m • feed = 240. g/h<br />
m • air = 0.0227 kg/s<br />
V & = 0.90 m 3 /h<br />
at<br />
P at = 1 bar<br />
Cs = 25.0 % m/m<br />
Maltodextrin (DE14) at<br />
proportions <strong>of</strong> 60 to 100 %<br />
relative to solids content in<br />
the crude extract.<br />
Colloidal silicon dioxide<br />
(Tixosil 333 ® Rhodia),<br />
maltodextrin and starch,<br />
2.5 % relative to the solids<br />
content in the extract.<br />
Significant effects <strong>of</strong> the processing parameters on the retention <strong>of</strong><br />
the proteolytic activity <strong>of</strong> the powdered extract were observed. High<br />
processing temperatures lead to a product with a smaller moisture<br />
content, particle size and lower agglomerating tendency. A product<br />
with insignificant losses <strong>of</strong> the proteolytic activity (≈ 10 %) and low<br />
moisture content (less than 6.5 %) is obtained at selected drying<br />
conditions.<br />
The correct choice <strong>of</strong> drying adjuvant has significant impact on spray<br />
dried soybean extract properties. The product using colloidal silicon<br />
dioxide as carrier showed high polyphenol, genistein contents and<br />
antioxidant activity. The chemical and antioxidant activities <strong>of</strong> spray<br />
dried product showed to be affected by the drying temperature. High<br />
losses on total polyphenol (67 %) and genistein (75 %) compared to<br />
the initial contents were observed.<br />
[106]<br />
Lippia sidoides<br />
extract<br />
Radix salvia<br />
Lab-Plant SD-05<br />
T in = 140 - 160 °C<br />
P at = 5 kgf/cm 2<br />
V & feed<br />
= 240. mL/h<br />
Cs = 20 % m/m<br />
T feed = 50 °C<br />
Büchi B-290 mini-spray<br />
dryer<br />
T in = 70, 80 and 90 °C<br />
T out = 44 to 62 °C<br />
V & = 3.0, 3.5 and 4.0<br />
feed<br />
mL/min<br />
Maltodextrin DE10 and<br />
gum arabic in different<br />
proportions (4:1, 3:2, 2:3,<br />
0:1) (m/m)<br />
Gelatin and sodium salt <strong>of</strong><br />
carboxy-methyl-cellulose<br />
at different proportions.<br />
Relation between core and<br />
wall material varied from<br />
1/2 to 1/6.<br />
Dried extracts showed average particle sizes ranged from 7.8 to<br />
10.6 µm, regular and spherical morphology and moisture content<br />
between 7.8 and 9.4 %. Thymol retentions from 70.2 to 84.2 % (in<br />
relation to liquid extract) were observed. Higher thymol retention was<br />
related to increase <strong>of</strong> gum arabic ratio. Lippia sidoides extractive<br />
solutions and dried extracts showed antifungal activity, indicating<br />
their potential as a natural product for medicinal or even cosmetic<br />
purposes.<br />
The results showed that spray-dried microcapsules had a regular<br />
spherical shape but the majority presented rough surfaces or<br />
invaginations with a diameter <strong>of</strong> 2-5 µm. R. salvia miltiorrhiza<br />
nanoparticles were embedded in the wall system consisting <strong>of</strong><br />
gelatin and CMC-Na. Higher encapsulation yield and encapsulation<br />
efficiency were obtained under the inlet temperature <strong>of</strong> 80 °C and<br />
the ratio between core:wall material <strong>of</strong> 1/4. In vitro release study<br />
showed that R. salvia miltiorrhiza microcapsules could regulate<br />
drug release <strong>of</strong> bioactive compounds.<br />
[107]<br />
[108]<br />
Oliveira, Souza, Kurozawa, Park – Food and herbal products 131
6.3 Microencapsulation <strong>of</strong> essential oils, flavour and oleoresins<br />
Many plants derived products <strong>of</strong> commercial interest, particularly in the food<br />
and pharmaceutical industries, contain high amount <strong>of</strong> volatile and/or<br />
thermosensitive compounds, susceptible to oxidation and <strong>of</strong>ten occur in liquid<br />
form under normal environmental conditions. These substances can undergo<br />
irreversible alterations in their physicochemical properties when exposed to<br />
contact with other materials or external agents without adequate protection. The<br />
microencapsulation technology is a method that can be applied to transform<br />
these substances into more stable materials (lower volatility and less<br />
susceptibility to oxidation) providing easy handling (solid form).<br />
Microcapsules incorporate new properties into active substances, as well<br />
as improve the quality <strong>of</strong> the final product. Encapsulation is applied in several<br />
industrial sectors, such as food, pharmaceutical, chemical and agricultural.<br />
Examples <strong>of</strong> application involve the microencapsulation <strong>of</strong> essential oils,<br />
vitamins, mineral salts, colorants, enzymes, hormones and chemotherapy drugs.<br />
Microencapsulation can be defined as a process where a continuous thin<br />
coating is formed around solid particles, liquid drops, or gas cell that are fully<br />
contained within the capsule wall. [111] The coating is denominated as wall<br />
material, coating material, carrier, encapsulation or matricial agent. The coated<br />
material is called active or core material. [112]<br />
The term microparticles is widely used, including the microcapsules and<br />
microspheres. In the microcapsules, the core material is concentrated near the<br />
center <strong>of</strong> the microcapsule, and coated by a continuous film <strong>of</strong> the coating<br />
material, while in the microspheres the active material is uniformly dispersed<br />
through the matrix. [28,112,113]<br />
The microparticles properties depend on the encapsulation method and<br />
physical and chemical properties <strong>of</strong> the core and wall materials. Therefore, the<br />
capsules can present as amorphous or crystalline materials, having compact or<br />
porous structures, with spherical or irregular shapes, and size varying from<br />
micrometers to millimeters. [113-115]<br />
The retention <strong>of</strong> bioactive and volatile compounds is directly linked to<br />
factors related with the chemical properties <strong>of</strong> the core and wall materials such<br />
as molecular weight, polarity and relative volatility, chemical structure, proportion<br />
core/wall material, and so on. The end use <strong>of</strong> the microencapsulated product<br />
also affects the selection <strong>of</strong> the encapsulation method and encapsulation<br />
materials. The spray drying is the method commonly used for<br />
microencapsulation. The main process variables are the composition <strong>of</strong> the<br />
encapsulation formulation, the inlet and outlet drying air temperatures, the gas<br />
flow rate, the distribution <strong>of</strong> temperature and humidity inside the dryer, the<br />
residence time, and the geometry <strong>of</strong> the drying chamber. [115] In general, matricial<br />
microparticles are generated by spray drying, in which the core (active material)<br />
is distributed in a matrix <strong>of</strong> the wall material. [111]<br />
Oliveira, Souza, Kurozawa, Park – Food and herbal products 132
The encapsulation system is designed to protect the active product from<br />
factors that cause their deterioration, reducing the possibility <strong>of</strong> interaction<br />
between the nucleous and other compounds <strong>of</strong> the formulation, losses caused<br />
by volatilization and to permit the controlled release under defined conditions<br />
. [112-114]. The diversity <strong>of</strong> wall materials permits the obtaining products with the<br />
desired functional properties. Wall materials can be selected from a wide variety<br />
<strong>of</strong> natural or synthetic polymers, depending <strong>of</strong> the material to be encapsulated<br />
and the desired product properties. Several types <strong>of</strong> materials can be used:<br />
polysaccharide derivatives <strong>of</strong> cellulose, such as carboxymethyl cellulose,<br />
methylcellulose, hydroxypropyl cellulose, hydroxymethylcellulose phthalate and<br />
cellulose acetate phthalate; polysaccharides not derived from cellulose, such as<br />
alginates, chitosan, gum arabic, maltodextrin and modified starch; derivatives <strong>of</strong><br />
acrylic/methacrylic acid; derivates <strong>of</strong> polylactic/polyglycolic acid; and nonpolymeric<br />
materials, such as vegetable fats, sugars, organic acids and<br />
hydrogenated vegetable oils. [3,47] It is desired that the wall material show good<br />
emulsifying and film-forming properties, be easy to dry (permeable to the solvent<br />
system used), low viscosity at high solid concentrations, chemically inert, and so<br />
on. [112,113] The water solubility is also a factor to be considered, since aqueous<br />
feedings are more commonly used. [116]<br />
The main wall materials used in the encapsulation <strong>of</strong> volatile materials can<br />
be divided in four groups, namely mono and disaccharides, the gums (acacia,<br />
gum agar, sodium alginate), hydrolyzed starches (maltodextrins and solid corn<br />
syrup), and chemically modified starches. [114,117,118] In general, wall materials that<br />
are effective emulsifiers and/or film formers yield better volatile retention than<br />
materials that do not present these characteristics. [28,47,112,113] Since most wall<br />
materials do not present these properties together, blends <strong>of</strong> distinct wall<br />
materials are frequently used to enhance microencapsulation efficiency. [119,120]<br />
Gum arabic provides very good volatile retention during spray drying.<br />
Maltodextrin is a good compromise between cost and effectiveness because <strong>of</strong><br />
its low viscosity at a high solid ratio. However, its major shortcomings are the<br />
lack <strong>of</strong> emulsifying capacity and low retention <strong>of</strong> volatile compounds.<br />
There are correlation between the maltodextrin dextrose equivalency<br />
number (DE) and the retention <strong>of</strong> aromatic compounds during spray drying<br />
microencapsultation. Bangs and Reineccius [121] reported a decrease in the<br />
retention capacity with increasing DE from 10 to 36.5. However, Yoshii et al. [122]<br />
observed higher retention <strong>of</strong> volatile compounds during storage with the increase<br />
in DE. Anandaraman and Reineccius [123] verified that maltodextrins with higher<br />
DE showed superior protective effect against oxidation on the encapsulated<br />
orange oil. Thus, the effect <strong>of</strong> maltodextrin DE on the microencapsulation<br />
process depends on the evaluated properties.<br />
Blends between gum arabic, maltodextrin and modified starch are known to<br />
give a better encapsulation efficiency and stability than gum arabic alone. [120]<br />
Sankarikutty et al. [124] evaluated the effect <strong>of</strong> different proportions maltodextrin:<br />
gum arabic on the spray drying microencapsulation <strong>of</strong> cardamom oil, and found<br />
the best result for the 1:2.3 ratio. Bhandari et al. [125] showed good retention<br />
levels during spray drying microencapsulation <strong>of</strong> citral and <strong>of</strong> the lynalil acetate<br />
Oliveira, Souza, Kurozawa, Park – Food and herbal products 133
in mixtures <strong>of</strong> gum arabic and maltodextrins at different ratios. The feed<br />
emulsions at solid concentrations <strong>of</strong> 50 % were spray dried in a Leaflash system<br />
at temperatures ranging from 300 to 400 o C. The volatile retention showed a<br />
tendency to increase with the proportion <strong>of</strong> arabic gum.<br />
Vaidya et al. [120] investigated the effects <strong>of</strong> binary and ternary blends <strong>of</strong><br />
gum arabic, maltodextrin (DE-18) and modified starch (HI-CAP 100) on the<br />
content and stability <strong>of</strong> volatiles during microencapsulation <strong>of</strong> cinnamon<br />
oleoresin by spray drying. The feed emulsions at 30 % <strong>of</strong> wall material and 10<br />
% <strong>of</strong> cinnamon oleoresin (based on wall material) were spray dried in a JISL<br />
LSD-48 mini spray dryer, at inlet and outlet drying temperatures <strong>of</strong> 160 ± 2 and<br />
120 ± 5 °C, respectively. The feed flow rate <strong>of</strong> emulsion was 300 g/h and the<br />
atomizing pressure <strong>of</strong> 3 bars. Results indicated gum arabic as the better wall<br />
material for encapsulation <strong>of</strong> cinnamon oleoresin, compared to the others<br />
carriers, when used alone. A 4:1:1 blend <strong>of</strong> gum arabic:maltodextrin:modified<br />
starch <strong>of</strong>fered better protection than the pure gum arabic and other blends<br />
evaluated.<br />
The effects <strong>of</strong> different mixtures between maltodextrin and gum arabic<br />
(4:1, 3:2, 2:3, 0:1 m/m) on the spray drying encapsulation <strong>of</strong> Lippia sidoides<br />
essential oil were evaluated by Fernandes et al. [119] Content <strong>of</strong> essential oil<br />
related to wall material were 20 and 25 % in weight. The feed emulsions having<br />
solid concentrations from 30 to 60 % m/m were spray dried in a Lab-Plant SD-<br />
05 spray dryer, at inlet drying temperatures <strong>of</strong> 140 to 160 °C, feed flow rate <strong>of</strong><br />
15 % <strong>of</strong> the maximum evaporation capacity, and atomizing pressure <strong>of</strong> 5<br />
kgf/cm 2 . The best thermal efficiency and powder recovery were found at 160<br />
°C. The best encapsulation efficiency was related to experimental parameters<br />
as follow: solid content <strong>of</strong> the encapsulating composition <strong>of</strong> 50 % (m/m),<br />
maltodextrin:gum arabic ratio <strong>of</strong> 0:1 (m/m) and wall material:essential oil ratio <strong>of</strong><br />
4:1 (m/m), giving an optimal thymol retention <strong>of</strong> 12.8 mg/100 mg <strong>of</strong><br />
microcapsules.<br />
Several other materials have been tested to encapsulate volatile<br />
compounds, such as mesquite gum, [126] blends <strong>of</strong> maltodextrin (DE 16-20) and<br />
whey protein/or modified starch/or small molecule surfactant, [127] skimmed milk<br />
powder and whey protein concentrate [128] and the entrapment in<br />
cyclodextrins. [119,129] Beristain et al. [126] evaluated the ability <strong>of</strong> mesquite<br />
(Prosopis juliflora) gum to act as an encapsulating agent for the production <strong>of</strong><br />
spray dried emulsions <strong>of</strong> cardamom (Elettaria cardamomum) essential oil.<br />
Emulsions containing oil:gum ratios <strong>of</strong> 1:5, 1:4 and 1:3 w/w were prepared by<br />
homogenizing 300 g <strong>of</strong> mesquite gum/kg in deionized water with the essential<br />
oil. The emulsions were spray dried in a Büchi-190 mini spray dryer, at inlet and<br />
outlet drying temperatures <strong>of</strong> 200 ± 5 and 110 ± 5 °C, respectively. Results<br />
showed the feasibility <strong>of</strong> spray drying microencapsulation <strong>of</strong> cardamom oil using<br />
mesquite gum as wall material. High flavour retention efficiency (83.6 %) was<br />
obtained when a ratio 4:1 gum:essential oil was used, confirming the good<br />
emulsifying and encapsulation properties <strong>of</strong> mesquite gum, as an alternative<br />
encapsulating material.<br />
Oliveira, Souza, Kurozawa, Park – Food and herbal products 134
Jafari et al. [127] used blends <strong>of</strong> maltodextrin (DE 16-20) and whey protein/or<br />
modified starch/or small molecule surfactant (Tween 20) to encapsulated<br />
nanoparticles <strong>of</strong> d-limonene by spray drying. Pre-emulsions having 40 % <strong>of</strong><br />
solid contents (30 % <strong>of</strong> maltodextrin and 10 % <strong>of</strong> emulsifiers) were prepared<br />
and the core material at proportion <strong>of</strong> 1:4 core:wall material were continuously<br />
added to the continuous phase and stirred for 10 minutes. Then, the preemulsions<br />
were further emulsified by micr<strong>of</strong>luidization or ultrasound, and then<br />
submitted to spray drying in a pilot plant spray dryer (model SL 20, Au), at inlet<br />
and oultlet drying temperatures <strong>of</strong> 180 and 65 °C, respectively, and atomizing<br />
pressure <strong>of</strong> 300 kPa. Emulsions obtained by micr<strong>of</strong>luidization technique showed<br />
the highest d-limonene retention, and presented good processing stability.<br />
Biopolymers as HI-CAP and whey protein concentrate are more efficient than<br />
small molecules surfactants, like tween 20.<br />
Baranauskiene et al. [128] used skimmed milk powder (SMP) and whey<br />
protein concentrate (WPC) to encapsulate essential oil <strong>of</strong> oregano, and aroma<br />
extracts <strong>of</strong> citronella and sweet marjoram by spray drying. Solutions containing<br />
30 % <strong>of</strong> solids were prepared by reconstituting and dispersing the wall materials<br />
in deionized water at 40 o C, and after cooling were mixed overnight to enhance<br />
hydration. The essential oil at 1:4 ratio relative to wall materials was emulsified<br />
into hydrated material and submitted to spray drying in an A/S Niro Atomizer, at<br />
inlet and outlet drying temperatures <strong>of</strong> 190 ± 5 and 90 ± 5 °C, atomizer wheel<br />
speed <strong>of</strong> 30 - 40 rps. The percentage <strong>of</strong> flavoring entrapped into the<br />
microcapsules varied from 54.3 % (marjoram in WPC) to 80.2 % (oregano in<br />
SMP). Changes in the composition <strong>of</strong> individual flavor compounds and the<br />
content <strong>of</strong> flavoring remaining on the surface <strong>of</strong> microparticles during<br />
encapsulation in SMP and WPC matrixes were remarkably lower for<br />
encapsulated oregano essential oil. The scanning electron microscopy and<br />
particle size analysis revealed that microcapsules were well-formed spherically<br />
shaped particles. SMP coated products had smoother surface as compared to<br />
WPC, which contain more dents and wrinkles on the capsule surface. Particle<br />
size varied from 6 to 280 µm for SMP and from 2 to 556 µm for WPC<br />
microencapsulated products.<br />
Cyclodextrins have also been successfully used to form inclusion<br />
complexes with essential oils using spray drying. Fernandes et al. [107]<br />
investigated the formation <strong>of</strong> inclusion complexes <strong>of</strong> Lippia sidoides essential oil<br />
in β-cyclodextrin by spray drying. The β-cyclodextrin slurry containing 50 % <strong>of</strong><br />
solid (m/m on the wet basis) was prepared by blending the β-cyclodextrin<br />
powder in warm distilled water at 50 °C under continuous stirring with a<br />
magnetic bar. Lippia sidoides essential oil was added to the slurry to reach 3<br />
different essential oil: β-cyclodextrin ratios (1:10; 1.33:10 and 2:10). The slurry<br />
was cooled down to room temperature and left for 12 h under agitation to reach<br />
the equilibrium condition. The slurry was fed to a bench-top spray dryer (Lab-<br />
Plant SD-05, Huddersfield, U.K.), at inlet drying temperature <strong>of</strong> 160 o C, at a<br />
flow rate <strong>of</strong> 15 % <strong>of</strong> the maximum evaporation capacity at 50 o C at atomizing<br />
pressure <strong>of</strong> 5 kgf/cm 2 , and air flow rate <strong>of</strong> 60 m 3 /h. Thermoanalytical techniques<br />
(TG, EGD, TG-MS) were used to support the formation <strong>of</strong> inclusion complex<br />
Oliveira, Souza, Kurozawa, Park – Food and herbal products 135
and to examine their physicochemical properties after accelerated storage<br />
conditions (RH <strong>of</strong> 66.09 % at 40 o C). The results showed that inclusion complex<br />
<strong>of</strong> β-cyclodextrin:essential oil microparticles was successfully produced by<br />
spray drying. The optimum ratio between β-cyclodextrin:essencial oil with<br />
regard to the total oil retention and thermal stability <strong>of</strong> the product was 1:10. The<br />
thermal properties <strong>of</strong> the complexes were influenced by the different essential<br />
oil/β-cyclodextrin ratio and also by the storage conditions.<br />
Lemon oil was successfully encapsulated by kneading with β-cyclodextrin<br />
at a ratio <strong>of</strong> lemon oil to β-cyclodextrin <strong>of</strong> 88:12 (w/w). [125] The resulting paste at<br />
≈ 18 % solids content was submitted to vacuum or spray drying. The spray<br />
drying was carried out in an APV Lab I <strong>Spray</strong> dryer, at inlet and outlet<br />
temperatures <strong>of</strong> 160 and 60 °C, respectively. Volatile composition was<br />
monitored periodically and no significant difference was found, irrespective <strong>of</strong><br />
kneading time or drying method used. An optimum mixing time was found to be<br />
15 min, giving an encapsulation <strong>of</strong> lemon oil <strong>of</strong> 97.7 mg/g <strong>of</strong> β-cyclodextrin in<br />
the complex powder. Several other examples <strong>of</strong> the use <strong>of</strong> spray drying for<br />
microencapsulation <strong>of</strong> volatile materials using several wall materials are<br />
presented in Table 3.<br />
6.4 Natural colorants and coloring extracts<br />
Some vegetal materials have valuable applications as source <strong>of</strong> natural<br />
dyes and coloring extracts aiming to replace artificial dyes due to legislation<br />
restrictions and consumers preferences. [15,135] Substances as anthocyanins and<br />
carotenoids are commonly used as natural colorants in food, cosmetics and<br />
animal feed. [136] These substances have also beneficial effects to human healthy<br />
and have low toxicity. Carotenoids comprise a large class <strong>of</strong> natural plant<br />
pigments having important biological activities. Among carotenoids commonly<br />
found in vegetables and fruits, and detectable in human plasma, are α-carotene,<br />
β-carotene, γ-carotene, lycopene, lutein, zeaxanthin, and β-cryptoxanthin. The<br />
carotenoids are largely used as food additives, and are recommended due to<br />
their pro-A vitamin content and antioxidant activity. [135] Carotenoids can be<br />
divided into carotenes containing only carbon and hydrogen, and<br />
xanthophylls made up <strong>of</strong> carbon, hydrogen, and oxygen. Pigments are rather<br />
unstable because they strongly absorb light and are highly unsaturated<br />
molecules and present low water solubility. [137] The most applied alternative to<br />
increase stability <strong>of</strong> carotenoids and to allow their incorporation in hydrophilic<br />
environment is the microencapsulation technique, which provides a physical<br />
barrier protecting the pigment. Among the available microencapsulation<br />
techniques, the most used process is spray drying. [138] Several wall materials<br />
have been used in the microencapsulation <strong>of</strong> natural colorants and coloring<br />
extracts, such as maltodextrins, gum arabic, β-cyclodextrin, gelatin, sucrose,<br />
gellan gum, mesquite gum, and some lipids.<br />
Oliveira, Souza, Kurozawa, Park – Food and herbal products 136
Table 3 Studies on spray drying microencapsulation <strong>of</strong> essential oils and flavors<br />
Material <strong>Spray</strong> drying parameters <strong>Drying</strong> carriers Main findings Ref.<br />
Microcapsules were evaluated for the content and stability <strong>of</strong> volatiles > p-<br />
JISL LSD-48 mini SD<br />
cymene > cuminaldheyde > γ-terpinene for six weeks. Gum Arabic showed<br />
T in = 160 ± 2 °C<br />
Maltodextrin DE18, gum<br />
greater protection than maltodextrin and modified starch. A 4/6:1/6:1/6 blend <strong>of</strong><br />
Cumin<br />
T out = 120 ± 5 °C<br />
arabic and modified<br />
gum arabic, maltodextrin and modified starch <strong>of</strong>fered better protection than gum [130]<br />
oleoresin P at = 3 bars<br />
starch (Hi-Cap 100) and<br />
Arabic does. However, protective effect <strong>of</strong> ternary blend was not similar for all<br />
•<br />
their blends<br />
m feed = 300 g/h<br />
constituents, and follows the order <strong>of</strong> volatiles > p-cymene > cuminaldheyde > γ-<br />
terpinene.<br />
Black pepper<br />
oleoresin<br />
d-limonene,<br />
ethyl butyrate<br />
and ethyl<br />
propionate<br />
(model flavors)<br />
l-menthol<br />
Monoterpenes<br />
(limonene, β-<br />
pinene, β-<br />
myrcene, citral<br />
and linalool)<br />
Büchi-190 mini SD<br />
T in = 178 ± 2 °C<br />
T out = 110 ± 5 °C<br />
P at = 5 bars<br />
V &<br />
feed<br />
= 300. mL/h<br />
Ohkawara-L8<br />
T in = 200 °C<br />
T out = 110 ± 10 °C<br />
Wheel speed = 30000rpm<br />
m • air = 100 kg/h (at T out )<br />
V &<br />
feed<br />
= 2700. mL/h<br />
Ohkawara-L8<br />
T in = 180 °C<br />
T out = 100 ± 5 °C<br />
Wheel speed = 30000rpm<br />
m • air = 11000 kg/h<br />
V &<br />
feed<br />
= 2700. mL/h<br />
Lab-Plant SD-04<br />
T in = 150 °C<br />
T out = 93 °C<br />
P at = 5 bars<br />
V & = 900. mL/h<br />
feed<br />
Gum arabic and<br />
comercial modified<br />
starch (Hi-Cap)<br />
Binary blends <strong>of</strong><br />
maltodextrin DE15-20<br />
(30 %), and gum arabic,<br />
modified starch (Hi-Cap<br />
100) and soybean water<br />
soluble polysaccharide,<br />
at concentration <strong>of</strong> 10%.<br />
Gum arabic and modified<br />
starch (CAPSUL and Hi-<br />
Cap 100)<br />
Gum arabic<br />
Extend <strong>of</strong> entrapment <strong>of</strong> piperine and volatiles and non volatiles depend on the<br />
nature <strong>of</strong> carrier material used. Gum Arabic was found to be a better wall<br />
material for encapsulation <strong>of</strong> peper oleoresin than is modified starch.<br />
The emulsion droplet size affects the volatiles retention during encapsulation.<br />
Smaller emulsion size <strong>of</strong> the insoluble flavor shows higher retention and lower<br />
surface oil content after encapsulation. The reduction <strong>of</strong> the size <strong>of</strong> the large<br />
emulsion droplets during atomization is one <strong>of</strong> the main causes <strong>of</strong> loss <strong>of</strong> flavors.<br />
However, the preparation <strong>of</strong> smaller emulsions is not mandatory for moderately<br />
soluble flavors that show the highest retention for optimum values <strong>of</strong> the mean<br />
emulsion droplet size.<br />
Microencapsultion <strong>of</strong> l-menthol was carried out proportions <strong>of</strong> l-menthol to the<br />
wall material <strong>of</strong> 1:9, 2:8, and 3:7. The solids concentration <strong>of</strong> the feed emulsion<br />
was set at 30 % (w/w). Results showed an higher retention <strong>of</strong> l-menthol for<br />
increasing the proportion <strong>of</strong> wall material. Hi-Cap 100 showed a higher retention<br />
<strong>of</strong> l-menthol than the other wall materials, but shows the presence <strong>of</strong> oil residue<br />
on the powder surface, mainly at high content <strong>of</strong> l-menthol in the feed. The<br />
release characteristics <strong>of</strong> l-menthol microparticles depended on the relative<br />
humidity and temperature.<br />
Increasing the concentration <strong>of</strong> limonene, β-pinene, β-myrcene, citral and linalool<br />
from 10 to 30 % with respect to the wall material decrease the percentage <strong>of</strong><br />
retention <strong>of</strong> essencial monoterpenes in the product. β-pinene was better retained<br />
than limonene, and β-myrcene showed the small retention. Stability <strong>of</strong> the<br />
capsules to temperature was checked for 33 days, and the degradation products<br />
were evaluated.<br />
[131]<br />
[132]<br />
[133]<br />
[134]<br />
Oliveira, Souza, Kurozawa, Park – Food and herbal products 137
Ersus and Yurdagel [135] investigated the spray drying microencapsulation<br />
<strong>of</strong> anthocyanin pigments extracted from black carrot (Daucus carota L.) with<br />
maltodextrins <strong>of</strong> different DE number, namely MDX 29 (28-31 DE), Glucodry<br />
210 (20-23 DE) and Stardri 10 (10 DE). Maltodextrin were incorporated to<br />
acidified ethanol anthocyanin extract (at 6 % solid contents) until to reach final<br />
solid concentrations <strong>of</strong> 20 % and stirred for complete homogenization. The<br />
feed mixtures were submitted spray drying in a SD-04 spray dryer, at inlet<br />
drying gas temperatures <strong>of</strong> 160, 180 and 200 °C and outlet temperatures <strong>of</strong><br />
107, 118 and 131 ± 2 °C. The flow rate <strong>of</strong> the feed composition was 300. mL/h<br />
at temperature <strong>of</strong> 25 °C. <strong>Spray</strong> dried acidified ethanol anthocyanin extracts <strong>of</strong><br />
black carrots content showed greater anthocyanin losses at higher inlet/outlet<br />
temperatures. 20-21 DE maltodextrin (Glucodry 210) gave the product with<br />
higher anthocyanin contents. Product stored at 4 °C showed a half-life 3 times<br />
higher compared to 25 °C storage.<br />
Larroza et al. [138] encapsulated lycopene in a blend <strong>of</strong> gum arabic and<br />
sucrose (8:2) by spray drying. Emulsion was prepared by dissolving the wall<br />
materials in warm water and adding the lycopene previously dissolved in<br />
dichloromethane. The emulsion was submitted to spray drying at inlet and<br />
outlet temperatures <strong>of</strong> 170 ± 2 and 113 ± 2 °C, respectively. The<br />
encapsulation efficiency ranged from 94 to 96 %, with an average yield <strong>of</strong> 51<br />
%, with microcapsules showing superficial indentations and lack <strong>of</strong> cracks and<br />
breakages. Lycopene purity increased from 96.4 to 98.1 % after spray drying,<br />
which yielded a pale-pink, dry, free-flowing powder.<br />
Shu et al. [139] studied the encapsulation <strong>of</strong> lycopene by spray drying<br />
using blends <strong>of</strong> edible gelatin and sucrose at several ratios (1/9 to 4/6). The<br />
relation between core and wall material varied from 1/2 to 1/16. Gelatin and<br />
sucrose were dissolved in hot distilled water and the lycopene (purity from 6<br />
to 90 %), previously dissolved in acetone, was added under stirring to form a<br />
coarse emulsion, and then homogenized. The resulting emulsion was<br />
submitted to spray drying, under inlet drying temperatures ranging from 170 -<br />
210 o C, feed flow rate <strong>of</strong> emulsion <strong>of</strong> 100. mL/h, feed temperature from 35 to<br />
65 o C, and drying air velocity <strong>of</strong> 2 m/s. Encapsulation yield and encapsulation<br />
efficiency were significantly affected by the ratio between core and wall<br />
materials, gelatin:sucrose ratio, homogenization pressure, inlet drying<br />
temperature, feed temperature, and lycopene purity. The optimal condition<br />
was determined as follows: gelatin/sucrose ratio <strong>of</strong> 3/7, ratio <strong>of</strong> core:wall<br />
material <strong>of</strong> 1/4, feed temperature <strong>of</strong> 55 °C, inlet drying temperature <strong>of</strong> 190 °C,<br />
homogenization pressure <strong>of</strong> 40 MPa, and lycopene purity <strong>of</strong> not less than 52<br />
%, at which the microencapsulated lycopene showed some isomerization, but<br />
a good storage stability.<br />
Wang et al. [15] encapsulated curcumin pigments in blends <strong>of</strong> gelatin and<br />
porous starch at proportions <strong>of</strong> 1/20, 1/3 and 1/40 curcumin:wall material ratio,<br />
varying the emulsification time and temperature. The emulsions were fed to a<br />
YC-105 spray dryer. The inlet drying temperature ranged from 180 to 200 °C,<br />
the gas flow rate from 50 to 70 m 3 /h, and the feed flow rate <strong>of</strong><br />
microencapsulating composition from 60 to 80 mL/min. Encapsulation<br />
efficiencies were significantly affected by the ratio <strong>of</strong> curcumin (core) to wall<br />
materials, embedding temperature, inlet drying gas temperature and feed flow<br />
rate. Statistical analysis <strong>of</strong> the encapsulation and spray drying process<br />
permitted the determination <strong>of</strong> optimum conditions, namely: ratio core to wall<br />
material <strong>of</strong> 1/30, embedding temperature <strong>of</strong> 70 °C, embedding time <strong>of</strong> 2 h,<br />
Oliveira, Souza, Kurozawa, Park – Food and herbal products 138
inlet drying gas temperature <strong>of</strong> 190 °C, feed flow rate <strong>of</strong> 70 mL/min, and<br />
drying gas flow rate <strong>of</strong> 70 m 3 /h. In these conditions microencapsulated<br />
curcumin before and after spray drying showed good solubility and stability.<br />
Oleoresins containing natural carotenoids (from red chilies and Aztec<br />
marigold petals) were microencapsulated in a water /oil/water (W/O/W)<br />
multiple emulsions based on blends <strong>of</strong> gellan gum, arabic gum, mesquite gum<br />
and maltodextrin DE10, with total solids content 25 and 35 %, and 0.25 %<br />
m/m theoretical carotenoid concentration. [140] The multiple emulsions were<br />
spray dried in a Mobile Minor Niro-Atomizer at inlet and outlet drying<br />
temperatures <strong>of</strong> 170 ± 5 and 80 ± 3 °C, at feed flow rate <strong>of</strong> emulsion <strong>of</strong> 20<br />
mL/min at atomizing pressure <strong>of</strong> 2.8 bar. Microcapsules obtained by spray<br />
drying <strong>of</strong> W/O/W multiple emulsions with high solid contents showed the best<br />
morphology, highest microencapsulation efficiency, and retention <strong>of</strong> total<br />
carotenoids. High encapsulation efficiency was obtained for a high biopolymer<br />
blend to primary emulsion ratio. However, a lower kinetics <strong>of</strong> carotenoid<br />
degradation longer carotenoid half life was obtained with the lowest solids<br />
concentration and ratio biopolymer blend to primary emulsion. The storage<br />
conditions affect the microcapsules morphology and stability <strong>of</strong> encapsulated<br />
carotenoids.An overview in literature shows several other examples <strong>of</strong> spray<br />
drying <strong>of</strong> natural colorants and coloring extracts such as bixin [141] , carotenoid<br />
pigments from rosa mosqueta (Rosa rubiginosa), [142] and anthocyanin from<br />
grape (Vitis labrusca) bagasse, [143] using distinct drying conditions and wall<br />
materials.<br />
6.5 <strong>Drying</strong> <strong>of</strong> miscellaneous food products<br />
This section will present studies on the spray drying <strong>of</strong> important<br />
miscellaneous products, such as egg, cheese, inulin, honey, milk, protein<br />
hydrolysate and so on, not covered in the previous sections.<br />
Egg<br />
Egg products have a range <strong>of</strong> applications in baking, dressing and<br />
confectionery products, due to its functional properties, such as foaming,<br />
gelling and emulsifying properties. Recently, instead <strong>of</strong> traditional liquid eggs,<br />
an increase <strong>of</strong> demand <strong>of</strong> dried egg products (whole egg, egg yolk and egg<br />
white) in the food industry has been observed, due to the growing importance<br />
<strong>of</strong> ready-for-use food products. The advantage <strong>of</strong> dried semi-finished products<br />
over traditional liquid eggs is respect to storage, handling and microbiological<br />
safety. [144]<br />
However, the spray drying process can lead to changes in sensitive egg<br />
components, such as proteins, affecting the functional properties <strong>of</strong> whole egg<br />
after reconstitution. Therefore, the knowledge <strong>of</strong> influence <strong>of</strong> drying conditions<br />
on functional properties <strong>of</strong> powder egg is essential to obtain a product with<br />
desirable properties for applications in different food products. Ayadi et al. [144]<br />
and Franke and Kieβling [145] evaluated the effect <strong>of</strong> inlet air temperature, feed<br />
flow rate and nozzle pressure on foaming, gelling and emulsifying properties <strong>of</strong><br />
spray dried white and whole eggs. Masters [4] recommends that the egg spray<br />
Oliveira, Souza, Kurozawa, Park – Food and herbal products 139
dried be cooled down to 30 °C or less as soon as possible to avoid heat<br />
damage.<br />
Cheese<br />
In almost every cheese factory, spray drying is an important process.<br />
However, spray dryers are mostly used for the by-product drying, such as<br />
whey, while is little used for making cheese powder. Cheese powder is mainly<br />
utilized as flavoring in dips, dressings, biscuits, chips and hot dishes, like<br />
spaghetti and soups. Before spray drying, it is necessary converting cheese to<br />
pump able fluid and not too viscous for atomization. This step is done by<br />
melting process, where the cheese is disintegrated and, during heating and<br />
agitation, melting salts such as phosphates and citrates are added together<br />
with water. For spray drying <strong>of</strong> cheese, aged cheese is recommended as a<br />
feed material, since a certain quantity <strong>of</strong> aroma is inevitably lost during<br />
process. [146]<br />
Inulin<br />
Inulin is a reserve carbohydrate and consists <strong>of</strong> a chain <strong>of</strong> fructose<br />
molecules with a terminal glucose molecule. This substance was used as an<br />
ingredient on foods, with reduced or no sugar and fat, such as chocolates, ice<br />
creams and yogurts, and others. Its use on products with low calories and<br />
reduced fat levels, in Europe, United States and Canada, is already quite<br />
extending. Moreover, inulin also presents some functional properties, acting in<br />
the organism similarly way to dietary fibers and contributing to the<br />
improvement <strong>of</strong> the gastrointestinal system conditions. [147] Due to these<br />
properties, the food and pharmaceutical industries have been using inulin in<br />
the production <strong>of</strong> functional foods, nutritional composites and medicines. The<br />
most stable form for the commercialization <strong>of</strong> the inulin is the extract in<br />
powder. [148]<br />
Honey<br />
Similarly fruit juices, honey are composed <strong>of</strong> several sugars (90 % honey<br />
are glucose and frutose) and organic acids. The glass transition temperature <strong>of</strong><br />
honey is around - 45 °C (with 16 % moisture w/w, proximately). Considering<br />
the Tg <strong>of</strong> the principal components <strong>of</strong> honey (glucose and fructose), the glass<br />
transition temperature <strong>of</strong> anhydrous honey may lie between the Tg <strong>of</strong> fructose<br />
(16 °C) and glucose (32 °C). This mean that spray drying is impossible and the<br />
addition <strong>of</strong> carrier agents are unavoidable to dry this product. [36] Bhandari et<br />
al. [67] verified the effect <strong>of</strong> addition maltodextrin 6 DE, at different<br />
concentrations, on product recovery. Increasing honey:maltodextrin ratio from<br />
0.47:0.53 to 0.55:0.45, product recovery decreased from 56.5 to 20.3 %.<br />
According to Bhandari and Hartel, [36] the addition <strong>of</strong> higher carrier content<br />
causes a dilution <strong>of</strong> the honey, but in terms <strong>of</strong> flavor it may not matter much if a<br />
strong honey is selected for spray drying. <strong>Spray</strong> dried honey with maltodextrin<br />
is already commercially available and is used mainly in premixes and for<br />
flavoring purposes.<br />
Milk<br />
Fresh milk has a high nutritional value; however this product has a limited<br />
shelf-life and therefore should be processed in order to become<br />
microbiologically stable. <strong>Spray</strong> drying <strong>of</strong> milk is a very important process in the<br />
Oliveira, Souza, Kurozawa, Park – Food and herbal products 140
dairy industries. The disadvantage <strong>of</strong> milk drying is that the energy<br />
consumption is high; no other process in the dairy industry demands a high<br />
energy per ton <strong>of</strong> final product. [149] This fact occurs due to high moisture<br />
content <strong>of</strong> milk (about 90 %), and practically all that water has to be removed<br />
by heat. The advantage <strong>of</strong> spray drying is a relatively gentle drying process<br />
that has replaced drum dryers, which causes more product denaturing. The<br />
quality <strong>of</strong> milk powder is an important parameter to be considered, that will<br />
determine the acceptance <strong>of</strong> product in the market. These aspects are related<br />
to the: microbiological safety, chemical quality and physical-chemical<br />
properties (moisture and fat content, bulk density, particles size) <strong>of</strong> the powder.<br />
The physical-chemical properties are important, because they affect the<br />
powder reconstitution (sinkability, solubility, dispersability and wetability) in<br />
water.<br />
Protein hydrolysate<br />
Protein hydrolysates are sources <strong>of</strong> biologically active peptides. [150,151]<br />
Bioactive peptides can affect numerous physiological functions <strong>of</strong> the<br />
organism, such as antihypertensive, immunomodulating, antithrombotic,<br />
antioxidative, anticancer, and antimicrobial activities. [152] Moreover, protein<br />
hydrolysates are applied in the nutritional management <strong>of</strong> individuals who<br />
cannot digest whole/intact protein. Hydrolysates rich in low molecular weight<br />
peptides, especially di- and tri-peptides with as little as possible free amino<br />
acids, have been shown to have more dietary uses due to their high nutritional<br />
and therapeutic values. [153]<br />
However, due to their high moisture and protein content, protein<br />
hydrolysates are very perishable and could be converted to powder to improve<br />
their shelf life. Due to low molecular weight peptides, protein hydrolysates<br />
present low Tg values and, consequently, high hygroscopicity and<br />
thermoplasticity. So, the addition <strong>of</strong> carrier before spray drying is necessary.<br />
Kurozawa et al. [154] evaluated the effect <strong>of</strong> addition carrier agent on Tg and<br />
physical stability <strong>of</strong> chicken protein hydrolysate spray dried. The powder,<br />
without carrier agents, presented a low Tg and low critical values for moisture<br />
content and water activity, indicating its vulnerability during processing,<br />
handling and storage. The Tg and critical moisture content values raised when<br />
maltodextrin or gum arabic were used as drying agents, showing their<br />
contribution to the powder stability.<br />
Whey<br />
In terms <strong>of</strong> volume and weight, whey is the largest amount <strong>of</strong> waste from<br />
the cheese industrial processing, becoming a problem, both for environment<br />
and processing plant. Therefore, the cheese industry is continuously looking<br />
for solutions to these problems caused by whey discharge, such as animal<br />
feeding and fertilizer. Therefore, it has been necessary to find alternative types<br />
<strong>of</strong> products made from whey that would be more attractive for consumers,<br />
together with alternative low-cost technologies that would be more attractive<br />
for producers. <strong>Spray</strong> drying <strong>of</strong> whey can be a solution for cheese industry,<br />
since the product has high protein content. There are two major whey proteins:<br />
α-lactalbumin and β-lactoglobulin, which plays an extremely important role in<br />
the food industry, as a result <strong>of</strong> its gelation and emulsification properties. [146,155]<br />
<strong>Spray</strong> drying <strong>of</strong> many food products have been studied by several researchers.<br />
An overview <strong>of</strong> some studies are shown in Table 4.<br />
Oliveira, Souza, Kurozawa, Park – Food and herbal products 141
Table 4 Miscellaneous food products submitted to spray drying<br />
Food products <strong>Spray</strong> drying conditions Carrier agent Ref.<br />
T in = 110 - 125°C<br />
m& air = 0.18 kg/min<br />
Not used [144]<br />
Egg<br />
V & feed = 0.2 - 0.3 L/h<br />
Extract from ham<br />
by-products<br />
Honey<br />
Hydrolyzed<br />
sweetpotato puree<br />
T in = 130 - 190°C<br />
Nozzle pressure = 125 - 195 bar<br />
T in = 100 - 200°C<br />
V & = 25 - 50 m 3 /h<br />
air<br />
V & feed = 2.5 - 10.0 mL/h<br />
T in = 150°C<br />
T out = 65°C<br />
Atomizer speed = 20.000 rpm<br />
T in = 150°C<br />
T out = 65°C<br />
T in = 150, 190 and 220°C<br />
T out = 100°C<br />
T feed = 60°C<br />
m& feed<br />
= 2 kg/h<br />
Atomizer speed = 20.000 rpm<br />
Inulin T in = 186 - 193°C<br />
Lactose hydrolysed<br />
skim milk<br />
Whey protein<br />
Milk<br />
Protein hydrolysate<br />
from chicken breast<br />
Protein hydrolysate<br />
from chicken breast<br />
Protein hydrolysate<br />
from tilapia<br />
Protein hydrolysate<br />
from fermented<br />
shrimp by-products<br />
Shark<br />
gelatin<br />
Soymilk<br />
cartilage<br />
T in = 130°C<br />
T out = 65°C<br />
T feed = 50°C<br />
T in = = 160 - 255°C<br />
T out = 60 - 120°C<br />
m& = 4.7 - 17.5 kg/h<br />
feed<br />
m& air<br />
= 227 kg/h<br />
T in = 160 - 190°C<br />
m& = 1.4 - 2.4 kg/h<br />
feed<br />
Atomizer speed = 42.000- 50.000 rpm<br />
T in = 120, 160 and 200°C<br />
T out = 83, 107 and 128°C (for concentrate milk)<br />
T out = 75, 103 and 119°C (for skim milk)<br />
V & feed = 8 mL/h<br />
V & air = 38 m 3 /h<br />
T in = 180°C<br />
T out = 91 - 102°C<br />
m& = 0.2 kg/h<br />
feed<br />
T in = 88 - 136°C<br />
T out = 91 - 102°C<br />
V & feed = 0.4 - 1.0 L/h<br />
T in = 150 and 180°C<br />
T out = 76 and 90°C<br />
T in = 180°C<br />
T out = 140°C<br />
T feed = 80°C<br />
V & feed = 1.0 L/h<br />
T in = 127°C<br />
T out = 100°C<br />
T in = 255 - 275°C<br />
V & feed = 0.37 and 0.58 L/min<br />
Atomizer speed = 19.300 and 26.800 rpm<br />
Not used [145]<br />
Not used [156]<br />
Maltodextrin 6DE [67]<br />
Maltodextrin 6DE [31]<br />
Maltodextrin<br />
11DE<br />
Modified and<br />
hydrolyzed starch<br />
[157]<br />
[148]<br />
Not used [65]<br />
Not used [155]<br />
Not used [158]<br />
Not used [159]<br />
Maltodextrin 10DE<br />
and gum Arabic<br />
[154]<br />
Maltodextrin 10DE [160]<br />
Maltodextrin [161]<br />
Not used [162]<br />
Not used [163]<br />
Not used [164]<br />
Oliveira, Souza, Kurozawa, Park – Food and herbal products 142
7.0 Final remarks<br />
Currently, the market for natural products has increased considerably,<br />
since consumers become more interested in a healthy life. Products having<br />
high concentration <strong>of</strong> phytochemicals can help to improve our healthy or are<br />
used even for medicinal purposes. These products have received much<br />
attention from the consumers, scientific community, industry and government<br />
worldwide. Several terms have been used to classify these products, such as<br />
‘functional foods’, medical foods, dietary supplements health foods,<br />
nutraceutical, and includes botanicals and phytomedicines, being the term<br />
nutraceutical more frequently used. It is obvious that the term adopted will be<br />
related to the final use <strong>of</strong> the product.<br />
Natural products are also used as food, pharmaceutical, and cosmetic<br />
excipients, in most varied applications such as natural colorants, natural<br />
antioxidants, flavoring agents, and food preservatives. Generally, these<br />
products are composed by a complex mixture <strong>of</strong> substances, for which little<br />
information on physical and chemical properties is available. Thus the<br />
standardization <strong>of</strong> these products is challenging, and is a fascinating research<br />
subject.<br />
Most natural products contains high amount <strong>of</strong> volatile and/or<br />
thermosensitive compounds, susceptible to oxidation and <strong>of</strong>ten have high<br />
water activity and/or occur in liquid form under normal environmental<br />
conditions. These substances can undergo irreversible alterations in their<br />
physicochemical properties when exposed to contact with other materials or<br />
external agents without adequate protection.<br />
<strong>Spray</strong> drying is a key technology in natural products processing since it<br />
is one-step processing operation for turning a liquid feed into a dried<br />
particulate form, by spraying the feed into a hot drying gas medium. While<br />
reduces the product bulk weight and size, spray drying minimizes handling<br />
and also preserves the product by reducing its water activity to a low level,<br />
required to stop bacterial degradation, generating an attractive, marketable<br />
and <strong>of</strong>ten long shelf-life product. The technology is also widely used for<br />
microencapsulation, transforming reactive substances into more stable<br />
materials (lower volatility and less susceptibility to oxidation) providing easy<br />
handling (solid form).<br />
In this chapter was presented an overview <strong>of</strong> recent applications and<br />
concepts involved in field <strong>of</strong> spray drying <strong>of</strong> several foods and plant derived<br />
products. Topics <strong>of</strong> general character were approached, including aspects <strong>of</strong><br />
spray drying, relevant physical-chemical properties <strong>of</strong> spray dried product,<br />
quality changes, and drying carriers. Finally, the spray drying <strong>of</strong> food and<br />
herbal products, emphasizing fruit pulps, herbal extracts, and also<br />
encapsulation <strong>of</strong> essential oils, flavors, plant pigments and oleoresins was<br />
presented.<br />
Oliveira, Souza, Kurozawa, Park – Food and herbal products 143
8.0 Nomenclature<br />
Cs solid concentrations in the feed composition [ - ]<br />
m&<br />
air mass flow rate <strong>of</strong> drying air [ MT -1 ]<br />
m&<br />
feed mass flow rate <strong>of</strong> the feed composition [ MT -1 ]<br />
P at atomizing air pressure [ML -1 T -2 ]<br />
T in inlet drying gas temperature [ θ ]<br />
T feed temperature <strong>of</strong> the feed composition [ θ ]<br />
T out outlet drying gas temperature [ θ ]<br />
V & air volumetric flow rate <strong>of</strong> drying gas [L 3 T -1 ]<br />
V & at volumetric flow rate <strong>of</strong> atomizing gas [L 3 T -1 ]<br />
V & feed volumetric flow rate <strong>of</strong> the feed composition [L 3 T -1 ]<br />
V ⋅ max<br />
maximum volumetric evaporation capacity <strong>of</strong> the dryer [L 3 T -1 ]<br />
9.0 References<br />
1. Hayashi, H. 1989. <strong>Drying</strong> technologies <strong>of</strong> foods - their history and future,<br />
<strong>Drying</strong> <strong>Technology</strong> 1989, 7(2), 315-369.<br />
2. Chiou, D.; Langrish, T.A.G. Crystallisation <strong>of</strong> amorphous spray-dried<br />
powders. In Proceedings <strong>of</strong> 15 th International <strong>Drying</strong> Symposium (IDS<br />
2006), Budapest, Hungary, 2006, pp. 562-569.<br />
3. Barbosa-Cánovas, G.V.; Ortega-Rivas, E.; Juliano, P.; Yan, H.<br />
Encapsulation Processes, In: Food powders: Physical Properties,<br />
Processing, and Functionality, Chapter 8, 199-219, 2005.<br />
4. Masters, K. <strong>Spray</strong> drying. An introduction to principles, operational<br />
practice and applications. Leonard Hill Books; London, 1972.<br />
5. Orsat, V.; Raghavan, V. Dehydration technologies to retain bioactive<br />
components. In: J. Shi (Ed.) Functional Food Ingredients and<br />
Nutraceuticals - Processing Technologies, Chapter 7, 173-191, Taylor &<br />
Francis, Boca Raton; USA, 2007.<br />
6. Kwak, N.S.; Jukes, D.J. Functional foods. Part 2: the impact on current<br />
regulatory terminology. Food Control 2001, 12, 109-117.<br />
7. Wildman, R.E.C.; Kelley, M. Nutraceutical and functional foods. In<br />
Wildman, R.E.C. (ed.) Handbook <strong>of</strong> Nutraceuticals and Functional Foods<br />
– 2 nd Ed., Chapter 1-21, CRC Press, Taylor & Francis Group, Boca<br />
Raton, USA, 2006.<br />
8. Krzyst<strong>of</strong>, C.; Krzyst<strong>of</strong>, S. <strong>Spray</strong> drying technique: I. Hardware and<br />
process parameters. Journal <strong>of</strong> Pharmaceutical Sciences 2009, 99, 575-<br />
586.<br />
Oliveira, Souza, Kurozawa, Park – Food and herbal products 144
9. Krzyst<strong>of</strong>, S.; Krzyst<strong>of</strong>, C. <strong>Spray</strong> drying technique: II. Current applications<br />
in pharmaceutical technology. Journal <strong>of</strong> Pharmaceutical Sciences 2009,<br />
99, 587-597.<br />
10. Langrish, T.A.G. New Engineered particles from spray dryers: Research<br />
needs in spray drying. <strong>Drying</strong> <strong>Technology</strong> 2007, 25, 971-983.<br />
11. Souza, C.R.F.; Georgetti, S.R., Salvador, M.J.; Fonseca, M.J.V.; Oliveira,<br />
W.P. Antioxidant activity and physical-chemical properties <strong>of</strong> spray and<br />
spouted bed dried extracts <strong>of</strong> Bauhinia forficata. Brazilian Journal <strong>of</strong><br />
Pharmaceutical Sciences 2009, 45(2), 209-218.<br />
12. Soares, L.A.L.; Ortega, G.G.; Petrovick, P.R.; Schmidt, P.C. Optimization<br />
<strong>of</strong> tablets containing a high dose <strong>of</strong> spray-dried plant extract: A technical<br />
note. AAPS PharmSci<strong>Technology</strong> 2005, 6, E367-E371.<br />
13. Edris, A.; Bergnståhl, B. Encapsulation <strong>of</strong> orange oil in a spray dried<br />
double emulsion, Nahrung/Food 2001, 45, 133-137.<br />
14. Angel, R.C.M.; Espinosa-Muñoz, L.C.; Aviles-Aviles, C.; González-<br />
García, R.; Moscosa-Santillán, M.; Grajales-Lagunes, A.; Abud-Archila,<br />
M. <strong>Spray</strong>-drying <strong>of</strong> passion fruit juice using lactose-maltodextrin blends<br />
as the support material. Brazilian Archives <strong>of</strong> Biology and <strong>Technology</strong><br />
2009, 52, 1011-1018.<br />
15. Wang, Y.; Lu, Z.; Lv, F.; Bie, X. Study on microencapsulation <strong>of</strong> curcumin<br />
pigments by spray drying. European Food Research and <strong>Technology</strong><br />
2009, 229, 391-396.<br />
16. Wiesenborn, D.; Zbikowski, Z.; Nguyen, H. Process conditions affect<br />
pigment quality and yield in extracts <strong>of</strong> purple sunflower hulls. Journal <strong>of</strong><br />
the American Oil Chemists' Society 1995, 72, 183-188.<br />
17. Fernandes, L.P.; Oliveira, W.P.; Sztatisz, J.; Novák, C. Thermal<br />
properties and release <strong>of</strong> Lippia sidoides essential oil from gum<br />
arabic/maltodextrin microparticles, Journal <strong>of</strong> Thermal Analysis and<br />
Calorimetry 2008, 94, 461-467.<br />
18. Acosta-Esquijarosa, J.; Jáuregui-Haza, U.; Amaro-González, D.; Sordo-<br />
Martínez, L. <strong>Spray</strong> drying <strong>of</strong> aqueous extract <strong>of</strong> Mangifera indica L<br />
(Vimang): Scale up for the process. World Applied Sciences Journal<br />
2009, 6(3), 408-412.<br />
19. Goula, A.M.; Adamopoulos, K.G. <strong>Spray</strong> drying <strong>of</strong> tomato pulp: Effect <strong>of</strong><br />
feed concentration. <strong>Drying</strong> <strong>Technology</strong> 2004, 22, 2309-2330.<br />
20. Chegini, G.R.; Ghobadian, B. <strong>Spray</strong> dryer parameters for fruit juice<br />
drying. World Journal <strong>of</strong> Agricultural Sciences 2007, 3, 230-236.<br />
21. Filková, I.; Mujumdar, A.S. Industrial <strong>Spray</strong> <strong>Drying</strong> Systems. In:<br />
Handbook <strong>of</strong> Industrial <strong>Drying</strong>, edited by A.S. Mujumdar, 2 nd edition, vol.<br />
1, Marcel Dekker, USA, Chapter 9, 263-308, 1995.<br />
22. Barbosa-Cánovas, G.V.; Juliano, P. Physical and chemical properties <strong>of</strong><br />
food powders. In: C. Onwulata (Ed.), Encapsulated and powdered foods,<br />
Chapter 3, 39-71, Taylor & Francis, Boca Raton, USA, 2005.<br />
23. Cai, Y.Z.; Corke, H. Production and properties <strong>of</strong> spray-dried Amaranthus<br />
betacyanin pigments. Journal <strong>of</strong> Food Science 2000, 65(7), 1248-1252.<br />
Oliveira, Souza, Kurozawa, Park – Food and herbal products 145
24. Reineccius, G.A; Multiple-core encapsulation – The spray drying o food<br />
ingredients. In: Vilstrup, P. (Ed.). Microencapsulation <strong>of</strong> food ingredients.<br />
Leatherhead Publishing; Surrey, 151-185, 2001.<br />
25. Barbosa-Cánovas, G.V.; Vega-Mercado, H. Dehydration <strong>of</strong> food.<br />
Chapman & Hall; New York, 1996.<br />
26. O’Hagan, P.; Hasapidis, K.; Coder, A.; Helsing, H.; Pokrajac, G. Particle<br />
size analysis <strong>of</strong> food powders. In: Onwulata, C. (Ed.). Encapsulated and<br />
powdered foods, Chapter 9, 215-246, Taylor & Francis: Boca Raton;<br />
USA, 2005.<br />
27. Tóth, J.; Pallai-Varsányi, E. <strong>Drying</strong> <strong>of</strong> bovine serum albumin on inert<br />
particle surface in msb dryer. In Proceedings <strong>of</strong> the 15 th International<br />
<strong>Drying</strong> Symposium, Budapeste, Hungria, 1216-1222, 2006.<br />
28. Ré, M.I. Microencapsulation by spray drying. <strong>Drying</strong> <strong>Technology</strong> 1998, 16<br />
(6), 1195-1236.<br />
29. Rosenberg, M.; Kopelman, I.J.; Talmon, Y. A scanning electron<br />
microscopy study <strong>of</strong> microencapsulation. Journal <strong>of</strong> Food Science 1985,<br />
50(1), 139-144.<br />
30. Fitzpatrick, J.J. Food powder flowability. In: C. Onwulata (Ed.),<br />
Encapsulated and powdered foods, Chapter 11, 247-260,. Taylor &<br />
Francis, Boca Raton; USA, 2005.<br />
31. Boonyai, P.; Howes, T.; Bhandari, B. Application <strong>of</strong> the cyclone stickiness<br />
test for characterization <strong>of</strong> stickiness in food powders. <strong>Drying</strong> <strong>Technology</strong><br />
2006, 24, 703-709.<br />
32. Chiou, D.; Langrish, T.A.G. Crystallisation <strong>of</strong> amorphous spray-dried<br />
powders. In Proceedings <strong>of</strong> 15 th International <strong>Drying</strong> Symposium (IDS<br />
2006), Budapest, Hungary, 562-569, 2006.<br />
33. Goula, A.M.; Adamopoulos, K.G. Effect <strong>of</strong> maltodextrin addition during<br />
spray drying <strong>of</strong> tomato pulp in dehumidified air: I. <strong>Drying</strong> kinetics and<br />
product recovery. <strong>Drying</strong> <strong>Technology</strong> 2008, 26, 714-725.<br />
34. Bhandari, B.R.; Snoussi, A. Dumoulin, E.D.; Lebert, A. <strong>Spray</strong> drying <strong>of</strong><br />
concentrated fruit juices. <strong>Drying</strong> <strong>Technology</strong> 1993, 11(5), 1081-1092.<br />
35. Roos, Y., Karel, M. Applying state diagrams to food processing and<br />
development. Food <strong>Technology</strong> 1991, 45(12), 66-71.<br />
36. Bhandari, B.R.; Hartel, R.W. Phase transitions during food powder<br />
production and powder stability. In: Onwulata, Charles (Ed.).<br />
Encapsulated and Powdered Foods, Chapter 11, pp. 261 – 292, Boca<br />
Raton: Taylor & Francis, 2005.<br />
37. Jouppila, K.; Roos, Y.H. Glass transition and crystallization in milk<br />
powders. Journal Dairy Science 1994, 77, 1798-1808.<br />
38. Mani, S.; Jaya, S.; Das, H. Sticky issues on spray drying <strong>of</strong> fruit juices.<br />
Saskatoon, Canada Presented at the 2002 ASAE/CSAE North-central<br />
Intersection Meeting – Paper MBSK 02-201, 1-18, 2002.<br />
39. Roos, Y. H. Importance <strong>of</strong> glass transition and water activity to spraydrying<br />
and stability <strong>of</strong> dairy powders. Lait 2002, 82, 475-484.<br />
Oliveira, Souza, Kurozawa, Park – Food and herbal products 146
40. Bhandari, B.R.; Howes, T. Implication <strong>of</strong> glass transition for the drying<br />
and stability <strong>of</strong> dried foods. Journal <strong>of</strong> Food <strong>Technology</strong> 1999, 40, 71-79.<br />
41. Labuza, T.P.; Labuza, P.S. Influence <strong>of</strong> temperature and relative humidity<br />
on the physical states <strong>of</strong> cotton candy. Journal <strong>of</strong> Food Preservation<br />
2004, 28, 274-287.<br />
42. Chu, K.K.W.; Chow, A.H.L. Impact <strong>of</strong> carbohydrate constituents on<br />
moisture sorption <strong>of</strong> herbal extracts. Pharmaceutical Research 2000, 17<br />
(9), 1133-1137.<br />
43. Truong, V., Bhandari, B.R, Howes, T. Optimization <strong>of</strong> co-current spray<br />
drying process <strong>of</strong> sugar-rich foods. Part I – Moisture and glass transition<br />
temperature pr<strong>of</strong>ile during drying. Journal <strong>of</strong> Food Engineering 2005, 71,<br />
55-65.<br />
44. Kenyon, M.M. Modified starch, maltodextrin and corn syrup solids as wall<br />
materials for food encapsulation. In: S. J. Risch, G. A. Reineccius (Eds.),<br />
Encapsulation and controlled released <strong>of</strong> food ingredients (pp. 42-50).<br />
Society American Chemical; Washigton, DC, USA, 1995.<br />
45. Reineccius, G.A. Carbohydrates for flavor encapsulation. Food<br />
<strong>Technology</strong> 1991, 45, 144-147.<br />
46. BeMiller, J.N.; Whistlers, R.L. Carbohydrates. In; Fennema, O. (Ed.),<br />
Food Chemistry, 3rd Ed., Marcel Dekker; New York, 157-224, 1996.<br />
47. Shahidi, F.; Han, X.Q. Encapsulation <strong>of</strong> food ingredients. Cristal Reviews<br />
in Food Science and Nutrition 1993, 33(6), 501-547.<br />
48. Kenyon, M.M.; Anderson, J. Maltodextrins and low dextrose-equivalence<br />
corn syrup solids. In: RISCH, S. J.; REINECCIUS, G. A. (Eds.) Flavor<br />
encapsulation, American chemical Society, Washington DC, USA, 87-<br />
102, 1988.<br />
49. Rowe, R.C.; Sheskey, P.J.; Quinn, M.E.; Handbook <strong>of</strong> Pharmaceutical<br />
Excipients, 6 th Edition, Pharmaceutical Press, London, UK, 2009.<br />
50. Thevenet, F. Natural encapsulation agent for food ingredients. In: S. J.<br />
Risch, G. A. Reineccius (Eds.), Encapsulation and controlled released <strong>of</strong><br />
food ingredients, pp. 51-59, Society American Chemical; Washigton, DC,<br />
USA, 1995.<br />
51. Scheindlin S. Acacia - a remarkable excipient: the past, present, and<br />
future <strong>of</strong> gum arabic. JAMA 2001, 41, 669-671.<br />
52. Szejtli, J. Introduction and general overview <strong>of</strong> cyclodextrin chemistry.<br />
Chemistry Review 1998, 98, 1743-1753.<br />
53. Martin Del Valle, E.M. Cyclodextrin and their uses: a review. Process<br />
Biochemistry 2004, 39, 1033-1046.<br />
54. Venturini, C.C.; Nicolini, J.; Machado, C.; Machado, V.G. Propriedades e<br />
aplicações recentes das ciclodextrinas. Química Nova 2008, 31(2), 360-<br />
368.<br />
55. Masters, K. <strong>Spray</strong> <strong>Drying</strong> Handbook; Longman: New York, 1990.<br />
56. Dolinsky, A.; Maletskaya, K.; Snezhkin, Y. Fruit and vegetable powders:<br />
Production technology on the bases <strong>of</strong> spray and convective drying<br />
methods. <strong>Drying</strong> <strong>Technology</strong> 2000, 18(3), 747-758.<br />
Oliveira, Souza, Kurozawa, Park – Food and herbal products 147
57. Roustapour, O.R.; Hosseinalipour, M.; Ghobadian, B. An experimental<br />
investigation <strong>of</strong> lime juice drying in a pilot plant spray dryer. <strong>Drying</strong><br />
<strong>Technology</strong> 2006, 24, 181-188.<br />
58. Khalloufi, S.; El-Maslouhi, Y.; Ratti, C. Mathematical model for prediction<br />
<strong>of</strong> glass transition temperature <strong>of</strong> fruit powders. Journal <strong>of</strong> Food Science<br />
2000, 65(5), 842-848.<br />
59. Roos, Y.H. Water activity and physical state effects on amorphous food<br />
stability. Journal <strong>of</strong> Food Processes and Preservation 1993, 16(6), 433-<br />
447.<br />
60. Roos, Y.H. Glass transition – Related physicochemical changes in foods.<br />
Food <strong>Technology</strong> 1995, 49(10), 97-102.<br />
61. Shrestha, A.K.; Ua-arak, T.;Adhikari, B.P.; Howes, T.; Bhandari, B.R.<br />
Glass transition behavior <strong>of</strong> spray dried orange juice powder measured<br />
by differential scanning calorimetry (DSC) and thermal mechanical<br />
compression test (TMCT). International Journal <strong>of</strong> Food Properties 2007,<br />
10(3), 661-673.<br />
62. Tonon, R.V.; Brabet, C.; Hubinger, M.D. Influence <strong>of</strong> process conditions<br />
on the physicochemical properties <strong>of</strong> açai (Euterpe oleraceae Mart.)<br />
powder produced by spray drying. Journal <strong>of</strong> Food Engineering 2008,<br />
88(3), 411-418.<br />
63. Oliveira, M.A.; Maia, G.A.; Figueiredo, R.W.; Souza, A.C.R.; Brito, E.S.;<br />
Azeredo, H.M.C. Addition <strong>of</strong> cashew tree gum to maltodextrin-based<br />
carriers for spray drying <strong>of</strong> cashew apple juice. International Journal <strong>of</strong><br />
Food Science and <strong>Technology</strong> 2009, 44, 641-645.<br />
64. Papadakis, S.E.; Gardeli, C.; Tzia, C. <strong>Spray</strong> drying <strong>of</strong> raisin juice<br />
concentrate. <strong>Drying</strong> <strong>Technology</strong> 2006, 24(2), 173-180.<br />
65. Shrestha, A.K.; Howes, T.; Adhikari, B.P.; Bhandari, B.R. Water sorption<br />
and glass transition properties <strong>of</strong> spray dried lactose hydrolysed skim<br />
milk powder. LWT – Food Science and <strong>Technology</strong> 2007, 40, 1593-1600.<br />
66. Righetto, A.M.; Netto, F.M. Effect <strong>of</strong> encapsulating materials on water<br />
sorption, glass transition and stability <strong>of</strong> juice from immature acerola.<br />
International Journal <strong>of</strong> Food Properties 2005, 8(2), 337-346.<br />
67. Bhandari, B.R.; Datta, N.; Howes, T. A semi-empirical approach to<br />
optimize the quality <strong>of</strong> drying aid required to spray dry sugar-rich foods.<br />
<strong>Drying</strong> <strong>Technology</strong> 1997, 15(10), 2509-2525.<br />
68. Goula, A.M.; Adamopoulos, K.G. <strong>Spray</strong> drying <strong>of</strong> tomato pulp<br />
dehumidified air: I. The effect on product recovery. Journal <strong>of</strong> Food<br />
Engineering 2005, 66, 25-34.<br />
69. Gong, Z.; Zhang, M.; Mujumdar, A.S.; Sun, J. <strong>Spray</strong> drying and<br />
agglomeration <strong>of</strong> instant bayberry powder. <strong>Drying</strong> <strong>Technology</strong> 2008, 26,<br />
166-121.<br />
70. Rodríguez-Hernández, G.R.; González-García, A.; Grajales-Lagunes, A.;<br />
Ruiz-Cabrera, M.A. <strong>Spray</strong> drying <strong>of</strong> cactus pear juice (Opuntia<br />
streptacantha): Effect on the physicochemical properties <strong>of</strong> powder and<br />
reconstituted product. <strong>Drying</strong> <strong>Technology</strong> 2005, 23(44), 955-973.<br />
Oliveira, Souza, Kurozawa, Park – Food and herbal products 148
71. Moβhammer, M.R.; Stintzing, F.C.; Carle, R. Evaluation <strong>of</strong> different<br />
methods for the production <strong>of</strong> juice concentrates and fruit powders from<br />
cactus pear. Innovative Food Science and Emerging Technologies 2006,<br />
7, 275-287.<br />
72. Dib Taxi, C.M.A.; Menezes, H.C.; Santos, A.B.; Grosso, C.R.F. Study <strong>of</strong><br />
the microencapsulation <strong>of</strong> camu-camu (Myrciaria dubia) juice. Journal <strong>of</strong><br />
Microencapsulation 2003, 20, 443-448.<br />
73. Chin, S.T.; Nazimah, S.A.H.; Quek, S.Y.; Man, Y.B.C.; Rahman, R.A.;<br />
Hashim, D.M. Changes <strong>of</strong> volatiles’ attribute in durian pulp during freezeand<br />
spray-drying process. LWT – Food Science and <strong>Technology</strong> 2008,<br />
41, 1899-1905.<br />
74. Chopda, C.A.; Barret, D.M. Optimization <strong>of</strong> guava juice and powder<br />
production. Journal <strong>of</strong> Food Processing Preservation 2001, 25, 411- 430.<br />
75. Righetto, A.M.; Netto, F.M. Vitamin C stability in encapsulated green west<br />
Indian cherry juice and in encapsulated synthetic ascorbic acid. Journal<br />
<strong>of</strong> the Science <strong>of</strong> Food and Agriculture 2006, 86, 1202-1208.<br />
76. Cano-Chauca, M.; Stringheta, P.C.; Ramos, A.M.; Cal-Vidal, J. Effect <strong>of</strong><br />
the carriers on the microstructure <strong>of</strong> mango powder obtained by spray<br />
drying and its functional characterization. Innovative Food Science and<br />
Emerging Technologies 2005, 6, 420-428.<br />
77. Chegini, G.R.; Ghobadian, B. Effect <strong>of</strong> spray-drying conditions on<br />
physical properties <strong>of</strong> orange juice powder. <strong>Drying</strong> <strong>Technology</strong> 2005,<br />
23(3), 657-668.<br />
78. Abadio, F.D.B.; Domingues, A.M.; Borges, S.V.; Oliveira, V.M. Physical<br />
properties <strong>of</strong> powdered pineapple (Ananas comosus) juice – effect <strong>of</strong><br />
maltodextrin concentration and atomization speed. Journal <strong>of</strong> Food<br />
Engineering 2004, 64(3), 285-287.<br />
79. Youssefi, S.; Emam-Djomeh, Z.; Mousavi, S.M. Comparison <strong>of</strong> artificial<br />
neural network (ANN) and response surface methodology (RSM) in the<br />
prediction <strong>of</strong> quality parameters <strong>of</strong> spray-dried pomegranate juice. <strong>Drying</strong><br />
<strong>Technology</strong> 2009, 27, 910-917.<br />
80. Goula, A.M.; Adamopoulos, K.G. <strong>Spray</strong> drying <strong>of</strong> tomato pulp<br />
dehumidified air: II. The effect on powder properties. Journal <strong>of</strong> Food<br />
Engineering 2005, 66, 35-42.<br />
81. Goula, A.M.; Adamopoulos, K.G.; Kazakis, N.A. Influence <strong>of</strong> spray drying<br />
conditions on tomato powder properties. <strong>Drying</strong> <strong>Technology</strong> 2004, 22(5),<br />
1129-1151.<br />
82. Al-Asheh, A.; Jumah, R.; Banat, F.; Hammad, S. The use <strong>of</strong> experimental<br />
factorial design for analyzing the effect <strong>of</strong> spray dryer operating variables<br />
on the production <strong>of</strong> tomato powder. Food and Bioproducts Processing<br />
2003, 81(2), 81-88.<br />
83. Quek, S.Y.; Chok, N.K.; Swedlund, P. The physicochemical properties <strong>of</strong><br />
spray-dried watermelon powders. Chemical Engineering and Processing<br />
2007, 46, 386-392.<br />
84. Kwak, N.S.; Jukes, D.J. Functional foods. Part 1: the development <strong>of</strong> a<br />
regulatory concept. Food Control 2000, 12, 99-107.<br />
Oliveira, Souza, Kurozawa, Park – Food and herbal products 149
85. Cacace, J.E.; Mazza, G. Pressurized low polarity water extraction <strong>of</strong><br />
biologically active compounds from plant products. In: J. Shi (Ed.)<br />
Functional Food Ingredients and Nutraceuticals - Processing<br />
Technologies, Chapter 5, 135-155, Taylor & Francis, Boca Raton; USA,<br />
2007.<br />
86. Yoon J.H.; Baek, S.J. Molecular targets <strong>of</strong> dietary polyphenols with antiinflammatory<br />
properties. Review. Yonsei Medical Journal 2005, 6, 585-<br />
596.<br />
87. Raghavan, G.S.V.; Orsat, V., Recent advances in drying <strong>of</strong> biomaterials<br />
for quality <strong>of</strong> bioproducts. Asia-Pacific Journal <strong>of</strong> Chemical Engineering<br />
2007, 2, 20-29.<br />
88. Gertenback, D.D. Solid-liquid extraction technologies for manufacturing<br />
nutraceuticals. In: Shi, J.; Mazza, G.; Maguer, M. (Eds). Functional Foods<br />
- Biochemical and processing aspects, Chapter 11, 1-36, CRC Press,<br />
Boca Raton; USA, 2002.<br />
89. Teixeira, H.F. Avaliação da influência de adjuvantes farmacêuticos sobre<br />
as características físicas, químicas, tecnológicas e farmacológicas de<br />
extratos secos nebulizados de Achyrocline satureioides (Lam.) DC.<br />
Compositae – marcela. PPGCF/UFRGS, Porto Alegre, RS,<br />
(Dissertação), 1996, 146p.<br />
90. Souza, K.C.B. Desenvolvimento de metodologias analíticas e<br />
tecnológicas na obtenção de extratos secos nebulizados de Passiflora<br />
edulis variedade flavicarpa (maracuja). PPGCF-UFRGS, Porto Alegre,<br />
Rio Grande do Sul, (Dissertação), 1997, 156p.<br />
91. Senna, E.L.; Petrovick, P.R.; Ortega, G.G.; Bassani, V.L. Preparation and<br />
characterization <strong>of</strong> spray dried powders from Achyrocline satureoides<br />
(Lam) DC extracts. Phytotherapy Research 1997, 11(2), 123-127.<br />
92. Cordeiro, D.S. Produção de extrato seco de Maytenus ilicifolia Martius ex<br />
Reiss pelo processo leito de jorro. PPGCF-FCFRP/USP, Ribeirão Preto,<br />
SP, (Dissertação), 2000, 80p.<br />
93. Cordeiro, D.S.; Oliveira, W.P. Technical aspects <strong>of</strong> the production <strong>of</strong><br />
dried extract <strong>of</strong> Maytenus ilicifolia leaves by jet spouted bed drying.<br />
International Journal <strong>of</strong> Pharmaceutics 2005, 299(1-2), 115-126.<br />
94. Runha, F.P.; Cordeiro, D.S.; Pereira, C.A.M.; Vilegas, J.; Oliveira, W.P.<br />
Production <strong>of</strong> dry extracts <strong>of</strong> medicinal Brazilian plants by spouted bed<br />
process: development <strong>of</strong> the process and evaluation <strong>of</strong> thermal<br />
degradation during drying operation, Transaction Ichem 2001, 79(C),<br />
160-168.<br />
95. Souza, C.R.F. Estudo comparativo da produção de extrato seco de<br />
Bauhinia forficata Link pelos processos spray dryer e leito de jorro.<br />
PPGCF-FCFRP/USP, Ribeirão Preto, SP, (Dissertação), 2003, 179p.<br />
96. Souza, C.R.F.; Oliveira, W.P. Spouted bed drying <strong>of</strong> Bauhinia forficata<br />
Link extract: effect <strong>of</strong> the position <strong>of</strong> the feed atomizer and operating<br />
conditions on equipment performance and product properties. Brazilian<br />
Journal <strong>of</strong> Chemical Engineering 2005, 22(2), 239-247.<br />
Oliveira, Souza, Kurozawa, Park – Food and herbal products 150
97. Bott, R.F.; Labuza, T.P.; Oliveira, W.P. Stability testing <strong>of</strong> spray and<br />
spouted bed dried extracts <strong>of</strong> Passiflora alata. <strong>Drying</strong> <strong>Technology</strong> 2010,<br />
(In Press).<br />
98. Remili, H.; Boussard, P.; Devleeschouwer, M., Microbiological quality <strong>of</strong><br />
spray-dried pharmaceutical plants extracts, European Journal <strong>of</strong><br />
Pharmaceutical Sciences 1994, 1, 265-268.<br />
99. Paula, I.C.; Ortega, G.G.; Bassani, V.L.; Petrovick, P.R. Development <strong>of</strong><br />
ointment formulation prepared with Achyrocline satureoids spray dried<br />
extracts. Drug Development and Industrial Pharmacy 1998, 24(3), 235-<br />
241.<br />
100. Casadebaig, J.; Jacob, M.; Cassanas, G.; Gaudy, D.; Baylac, G.; Puech,<br />
A. Physicochemical and pharmacological properties <strong>of</strong> spray dried<br />
powders from Fraxinus excelsior leaf extracts. Journal <strong>of</strong><br />
Ethnopharmacology 1989, 26, 211-216.<br />
101. Souza, C.R.F.; Oliveira, W.P. Powder properties and system behavior<br />
during spray drying <strong>of</strong> Bauhinia forficata Link extract. <strong>Drying</strong> <strong>Technology</strong><br />
2006, 24(6), 735-749.<br />
102. Oliveira, W.P.; Bott, R.F.; Souza, C.R.F. Manufacture <strong>of</strong> standardized dried<br />
extracts from medicinal Brazilian plants. <strong>Drying</strong> <strong>Technology</strong> 2006, 24(4),<br />
523-533.<br />
103. Martins, A.G.; Guterres, S.S.; Ortega, G.G. Anti-ulcer activity <strong>of</strong> spray<br />
dried powders prepared from leaf extracts <strong>of</strong> Maytenus ilicifolia Martius<br />
ex Reiss. Acta Farmaceutica Bonaerense 2003, 22(1), 39-44.<br />
104. Vargas, A.J.; Geremias, D.S.; Provensi, G.; Fornari, P.E.; Reginatto,<br />
F.H.; Gosmann, G.; Schenkel, E.P.; Fröde, T.S. Passiflora alata and<br />
Passiflora edulis spray dried aqueous extracts inhibit inflammation in<br />
mouse model <strong>of</strong> pleurisy. Fitoterapia 2007, 78, 112-119.<br />
105. Cabral, A.C.S.; Said, S.; Oliveira, W.P. Retention <strong>of</strong> the enzymatic activity<br />
and product properties during spray drying <strong>of</strong> pineapple stem extract in<br />
presence <strong>of</strong> maltodextrin. International Journal <strong>of</strong> Food Properties 2009,<br />
12, 536-548.<br />
106. Georgetti, S.R.; Casagrande, R.; Souza, C.R.F.; Oliveira, W.P.; Fonseca,<br />
M.J.V. <strong>Spray</strong> drying <strong>of</strong> the soybean extract: effects on chemical<br />
properties and antioxidant activity. Food Science and<br />
<strong>Technology</strong>/Lebensmittel-Wissenschaft + Technologie 2008, 41(8), 1521-<br />
1527.<br />
107. Fernandes, L.P.; Oliveira, W. P.; Sztatisz, J.; Szilágyi, I. M.; Novák, C.<br />
Solid state studies on molecular inclusions <strong>of</strong> Lippia sidoides essential oil<br />
obtained by spray drying. Journal <strong>of</strong> Thermal Analysis and Calorimetry<br />
2009, 95, 855-863.<br />
108. Su, Y.L.; Fu, Z.Y; Zhang, J.Y; Wang, W.M.; Wang, H.; Wang, Y.C.;<br />
Zhang, Q.J. Microencapsulation <strong>of</strong> Radix salvia miltiorrhiza nanoparticles<br />
by spray-drying, Powder <strong>Technology</strong> 2008, 184, 114-121.<br />
109. Krishnaiah, D.; Sarbatly, R.; Hafiz, A.M.M.; Hafeza, A.B.; Rao, A.R.M.<br />
Study <strong>of</strong> retention <strong>of</strong> bioactive components <strong>of</strong> Morinda citrifolia I. using<br />
spray-drying, Journal <strong>of</strong> Applies Sciences 2009, 9, 3092-3097.<br />
Oliveira, Souza, Kurozawa, Park – Food and herbal products 151
110. Souza, C.R.F.; Schiavetto, I.A.; Thomazini, F.C.F.; Oliveira, W.P.<br />
Processing <strong>of</strong> Rosmarinus <strong>of</strong>ficinalis Linne extract on spray and spouted<br />
bed dryers. Brazilian Journal Chemical Engineering 2008, 25, 59-69.<br />
111. King, C.J. <strong>Spray</strong> drying: retention <strong>of</strong> volatile compounds revisited. <strong>Drying</strong><br />
<strong>Technology</strong> 1995, 13(5-7), 1221-1240.<br />
112. Madene, A.; Jacquot, M.; Scher, J.; Desobry, S. Flavour encapsulation<br />
and controlled release – a review. International Journal <strong>of</strong> Food Science<br />
and <strong>Technology</strong> 2006, 41, 1-21.<br />
113. Desai, K.G.H.; Park, H.J. Recent developments in microencapsulation <strong>of</strong><br />
food ingredients. <strong>Drying</strong> <strong>Technology</strong> 2005, 23, 1361-1394.<br />
114. Gharsallaoui, A.; Roudaut, G.; Chambin, O.; Voilley, A.; Saurel, R.<br />
Applications <strong>of</strong> spray-drying in microencapsulation <strong>of</strong> food ingredients: an<br />
overview. Food Research International 2007, 40, 1107-1121.<br />
115. Wendel, S.; Çelik, M. Uma visão geral sobre o uso da tecnologia de<br />
spray-drying. Pharmaceutical <strong>Technology</strong> 1998, 31-45.<br />
116. Gouin, S. Microencapsulation: industrial appraisal <strong>of</strong> existing<br />
technologies and trends. Trends in Food Science and <strong>Technology</strong> 2004,<br />
15, 330-347.<br />
117. Reineccius, G.A. The spray drying <strong>of</strong> food flavors. <strong>Drying</strong> <strong>Technology</strong><br />
2004, 22(6), 1289-1324.<br />
118. Funchs, M.; Turchiuli, M.; Bohin, M.; Cuvelier, M.E.; Ordonnaud, C.;<br />
Peyrat-Maillard, M.N.; Dumoulin, E. Encapsulation <strong>of</strong> oil in powder using<br />
spray drying and fluidized bed agglomeration. Journal <strong>of</strong> Food<br />
Engineering 2006, 75, 27-35.<br />
119. Fernandes, L.P.; Turatti, I.; Lopes, N.P.G.; Ferreira, J.; Candido, R.C.;<br />
Oliveira, W.P. Volatile retention and antifungal properties <strong>of</strong> spray-dried<br />
microparticles <strong>of</strong> Lippia sidoides essential oil. <strong>Drying</strong> <strong>Technology</strong> 2008,<br />
26, 1534-1542.<br />
120. Vaidya, S.; Bhosale, R.; Singhal, R.S. Microencapsulation <strong>of</strong> cinnamon<br />
oleoresin by spray drying using different wall materials. <strong>Drying</strong><br />
<strong>Technology</strong> 2006, 24, 983-992.<br />
121. Bangs, W.M.; Reineccius, G.A. The influence <strong>of</strong> dryer infeed matrices on<br />
the retention <strong>of</strong> volatile flavor compounds during spray drying. Journal <strong>of</strong><br />
Food Science 1982, 47(1), 254-259.<br />
122. Yoshii, H.; Soottitantawat, A.; Liu, X.D; Atarashi, T.; Furuta, T.; Aishima,<br />
S.; Ohgawara, M; Linko, P. Flavor release from spray-dried<br />
maltodextrin/gum arabic or soy matrices as a function <strong>of</strong> storage relative<br />
humidity. Innovative Food Science and Emerging Technologies 2001, 2,<br />
55-61.<br />
123. Anandaraman, S.; Reineccius, G.A. Stability <strong>of</strong> encapsulated orange peel<br />
oil. Food <strong>Technology</strong> 1986, 40(11), 88-93.<br />
124. Sankarikutty, B.; Sreekumar, M.M.; Narayanan, C.S.; Mathew, A.G.<br />
Studies on microencapsulation <strong>of</strong> cardamom oil by spray drying<br />
technique. Journal <strong>of</strong> Food Science and <strong>Technology</strong> 1988, 25(6), 352-<br />
356.<br />
Oliveira, Souza, Kurozawa, Park – Food and herbal products 152
125. Bhandari, B.R.; Dumoulin, E.D; Richard, H.M.J; Noleau, I.; Lebert, A.M.<br />
Flavor encapsulation by spray drying: application to citral and linaryl<br />
acetate. Journal <strong>of</strong> Food Science 1992, 57(1), 217-221.<br />
126. Beristain, C.I.; Garcia, H.S.; Vernon-Carter, E.J. <strong>Spray</strong>-dried<br />
encapsulation <strong>of</strong> Cardamom (Elettaria cardamomum) essential oil with<br />
mesquite (Prosopis juliflora) gum. LWT – Food Science and <strong>Technology</strong><br />
2001, 34, 398-401.<br />
127. Jafari, S.M.; HE, Y.; Bhandari, B. Encapsulation <strong>of</strong> nanoparticles <strong>of</strong> d-<br />
limonene by spray drying: role <strong>of</strong> emulsifiers and emulsifying techniques.<br />
<strong>Drying</strong> <strong>Technology</strong> 2007, 25, 1079-1089.<br />
128. Baranauskiene, R.; Venskutonis, P.R.; Dewettinck, K.; Verhe, R.<br />
Properties <strong>of</strong> oregano (Origanum vulgare L.), citronella (Cymbopogon<br />
nardus G.) and marjoram (Majorana hortensis L.) flavors encapsulated<br />
into milk protein-based matrices. Food Research International 2006, 39,<br />
413-425.<br />
129. Bhandari, B.R.; D’arcy, B.R.; Padukka, I. Encapsulation <strong>of</strong> lemon oil by<br />
paste method using β-cyclodextrin: encapsulation efficiency and pr<strong>of</strong>ile <strong>of</strong><br />
oil volatiles. Journal <strong>of</strong> Agricultural and Food Chemistry 1999, 47, 5194-<br />
5197.<br />
130. Kanakdande, D.; Bhosale, R.; Singhal, R.S. Stability <strong>of</strong> cumim oleoresin<br />
microencapsulated in different combination <strong>of</strong> gum arabic, maltodextrin<br />
and modified starch. Carbohydrate Polymers 2007, 67, 536-541.<br />
131. Shaikh, J.; Bhosale, R.; Singhal, R. Microencapsulation <strong>of</strong> black pepper<br />
oleoresin. Food Chemistry 2006, 94, 105-110.<br />
132. Soottitantawat, A.; Yoshii, H.; Furuta, T; Ohkawara, M.; Linko, P.<br />
Microencapsulation by spray drying: Influence <strong>of</strong> emulsion size on the<br />
retention <strong>of</strong> volatile compounds. Journal <strong>of</strong> Food Science 2003, 68, 2256-<br />
2262.<br />
133. Soottitantawat, A.; Takayama, K.; Okamura, K.; Muranaka, D.; Yoshii, H.;<br />
Furuta, T; Ohkawara, M.; Linko, P. Microencapsulation <strong>of</strong> l-menthol by<br />
spray drying and its release characteristics. Innovative Food Science and<br />
Emerging Technologies 2005, 6, 163-170.<br />
134. Bertolini, A.C.; Iani, A.C.; Grosso, C.R.F. Stability <strong>of</strong> monoterpenes<br />
encapsulated in gum arabic by spray-drying. Journal <strong>of</strong> Agricultural and<br />
Food Chemistry 2001, 49, 780-785.<br />
135. Ersus, S.; Yurdagel, U. Microencapsulation <strong>of</strong> anthocyanin pigments <strong>of</strong><br />
black carrot (Daucus carota L.) by spray dried. Journal Food Engineering<br />
2007, 80, 805-812.<br />
136. Tanaka, Y.; Sasaki, N.; Ohmiya, A. Biosynthesis <strong>of</strong> plant pigments:<br />
anthocyanins, betalains and carotenoids. The Plant Journal 2008, 54,<br />
733-749.<br />
137. Mortensen, A. Carotenoids and other pigments as natural colorants. Pure<br />
Applied. Chemistry 2006, 78, 1477-1491.<br />
138. Nunes, I.L.; Mercadante, A.Z.; Encapsulation <strong>of</strong> lycopene using spraydrying<br />
and molecular inclusion processes. Brazilian Archives <strong>of</strong> Biology<br />
and <strong>Technology</strong> 2007, 50, 893-900.<br />
Oliveira, Souza, Kurozawa, Park – Food and herbal products 153
139. Shu, B.; Yu, W.; Zhao, Y.; Liu, X. Study on microencapsulation <strong>of</strong><br />
lycopene by spray-drying. Journal Food Engineering 2006, 76, 664-669.<br />
140. Rodriguez-Huezo, M.E.; Pedroza-Islas, R.; Prado-Barragán, L.A.;<br />
Beristain, C.I.; Vernon-Carter, E.J. Microencapsulation by spray drying <strong>of</strong><br />
multiple emulsion containing carotenoids. Journal Food Science 2004,<br />
69, E351-E359.<br />
141. Barbosa, M.I.M.J.; Borsarelli, C.D.; Mercadante, A.Z. Light stability <strong>of</strong><br />
spray-dried bixin encapsulated with different edible polysaccharide<br />
preparations, Food Research International 2005, 38, 989-994.<br />
142. Robert, P.; Carsson, R.M.; Romero, N.; Masson, L. Stability <strong>of</strong> spraydried<br />
encapsulated carotenoid pigments from Rosa Mosqueta (Rosa<br />
rubiginosa) oleoresin. JAOCS 2003, 80, 1115-1120.<br />
143. Valduga, E.; Lima, L.; Prado, R.; Padilha, F.F.; Treichel, H. Extraction,<br />
spray drying and microencapsulating <strong>of</strong> 'Isabel' grape (Vitis labrusca)<br />
bagasse anthocyanin. Ciência e Agrotecnologia, Lavras 2008, 32, 1568-<br />
1574.<br />
144. Ayadi, M.A.; Khemakhen, M.; Belgith, H.; Attia, H. Effect <strong>of</strong> moderate<br />
spray drying conditions on functionality <strong>of</strong> dried egg white and whole egg.<br />
Journal <strong>of</strong> Food Science 2008, 73(6), 281-287.<br />
145. Franke, K.; Kieβling, M. Influence <strong>of</strong> spray drying conditions on<br />
functionality <strong>of</strong> dried whole egg. Journal <strong>of</strong> the Science <strong>of</strong> Food and<br />
Agriculture 2002, 82, 1837-1841.<br />
146. Písecký, J. <strong>Spray</strong> drying in the cheese industry. International Dairy<br />
Journal 2005, 15, 531-536.<br />
147. Roberfroid, M.; Gibson, G.R.; Delzenne, N. The biochemistry <strong>of</strong><br />
olig<strong>of</strong>ructose, a nondigestible fiber: an approach to calculate its caloric<br />
value. Nutrition Reviews 1993, 51(5), 137-146.<br />
148. Leite, J.T.C.; Park, K.J.; Ramalho, J.R.P. Obtainment <strong>of</strong> the inulin extract<br />
by lowering temperature and the inulin powder by spray drying. In<br />
Proceeding <strong>of</strong> the 13 th International drying Symposium (IDS 2002),<br />
Beijing, China, 662-669, 2002.<br />
149. Verdurmen, R.E.M.; Jong, P. Optimisation product quality and process<br />
control for powdered dairy products. In Smit, Gerrit (Ed.). Dairy<br />
Processing: Improvement Quality, Chapter 16, Boca Raton; CRC Press,<br />
2003.<br />
150. Friedman, M. Nutritional value <strong>of</strong> proteins from different food sources. A<br />
review. Journal <strong>of</strong> Agricultural and Food Chemistry 1996, 44(1), 6-29.<br />
151. Gildberg, A; Stenberg, E. A new process for advanced utilization <strong>of</strong><br />
shrimp waste. Process Biochemistry 2001, 36(8-9), 809-812.<br />
152. Clare, D.A.; Swaisgood, H.E. Bioactive milk peptides: A prospectus.<br />
Journal <strong>of</strong> Dairy Science 2000, 83(6), 1187-1195.<br />
153. Bhaskar, N.; Modi, V.K.; Govindaraju, K.; Radha, C.; Lalitha, R.G.<br />
Utilization <strong>of</strong> meat industry by products: Protein hydrolysate from sheep<br />
visceral mass. Bioresource <strong>Technology</strong> 2007, 98(2), 388-394.<br />
154. Kurozawa, L.E.; Park, K.J.; Hubinger, M.D. Effect <strong>of</strong> maltodextrin and<br />
gum arabic on water sorption and glass transition temperature <strong>of</strong> spray<br />
Oliveira, Souza, Kurozawa, Park – Food and herbal products 154
dried chicken meat hydrolysate protein. Journal <strong>of</strong> Food Engineering<br />
2009, 91, 287-296.<br />
155. Anandharamakrishnan, C.; Rielly, C.D.; Stapley, A.G.F. Loss <strong>of</strong> solubility<br />
<strong>of</strong> α-lactalbumin and β-lactoglobulin during the spray drying <strong>of</strong> whey<br />
proteins. LWT 2008, 38, 270-277.<br />
156. Fernández-Pérez, V.; Tapiador, J.; Martín, A.; Luque de Castro, M.D.<br />
Optimization <strong>of</strong> the drying step for preparing a new commercial powdered<br />
soup. Innovative Food Science and Emerging Technologies 2004, 5, 361-<br />
368.<br />
157. Grabowski, J.A.; Truong, V.D.; Daubert, C.R. <strong>Spray</strong> drying <strong>of</strong> amylase<br />
hydrolyzed sweet potato puree and physicochemical properties <strong>of</strong><br />
powder. Journal <strong>of</strong> Food Science 2006, 71, E209-E217.<br />
158. Birchal, V.S.; Passos, M.L.; Wildhagen, G.R.S.; Mujumdar, A.S. Effect <strong>of</strong><br />
spray-dryer operating variables on the whole milk powder quality. <strong>Drying</strong><br />
<strong>Technology</strong> 2005, 23, 611-636.<br />
159. Nijdam, J.J.; Langrish, T.A.G. An investigation <strong>of</strong> milk powders produced<br />
by a laboratory-scale spray dryer. <strong>Drying</strong> Techonology 2005, 23, 1043-<br />
1056.<br />
160. Kurozawa, L.E.; Morassi, A.G.; Vanzo, A.A.; Park, K.J.; Hubinger, M.D.<br />
Influence <strong>of</strong> spray drying conditions on physicochemical properties <strong>of</strong><br />
chicken meat powder. <strong>Drying</strong> <strong>Technology</strong> 2009, 11, 1248-1257.<br />
161. Abdul-Hamid, A.; Bakar, J.; Bee, G.H. Nutritional quality <strong>of</strong> spray dried<br />
protein hydrolysate from Black Tilapia (Oreochromis mossambicus). Food<br />
Chemistry 2002, 78, 69-74.<br />
162. Bueno-Solano, C.; López-Cervantes, J.; Campas-Baypoli, O.N.; Lauterio-<br />
García, R.; Adan-Bante, N.P.; Sánchez-Machado, D.I. Chemical and<br />
biological characteristics <strong>of</strong> protein hydrolysates from fermented shrimp<br />
by-products. Food Chemistry 2009, 112, 671-675.<br />
163. Kwak, K.S.; Cho, S.M.; Ji, C.I.; Lee, Y.B.; Kim, S.B. Changes in functional<br />
properties <strong>of</strong> shark (Isurus oxyrinchus) cartilage gelatin produced by<br />
different drying methods. International Journal <strong>of</strong> Food Science and<br />
<strong>Technology</strong> 2009, 44, 1480-1484.<br />
164. Perez-Munoz, F.; Flores, R.A. Characterization <strong>of</strong> a spray drying system<br />
for soymilk. <strong>Drying</strong> <strong>Technology</strong> 1997, 15, 1023-1043.<br />
Oliveira, Souza, Kurozawa, Park – Food and herbal products 155
Oliveira, Souza, Kurozawa, Park – Food and herbal products 156
Sadikoglu, H. <strong>Spray</strong> freeze drying - Volume 1, Ed. Woo, M.W., Mujumdar, A.S. and<br />
Daud, W.R.W., 2010, ISBN - 978-981-08-6270-1, Published in <strong>Singapore</strong>, pp. 157-182.<br />
Sadikoglu H.<br />
<strong>Spray</strong> freeze drying<br />
Department <strong>of</strong> Chemical Engineering, Gebze Institute <strong>of</strong> <strong>Technology</strong>,<br />
Gebze-Kocaeli, Turkey<br />
Chapter 6<br />
Contents<br />
Page<br />
1.0 Introduction 157<br />
1.1 Freeze drying 157<br />
1.2 <strong>Spray</strong> drying 159<br />
2.0 <strong>Spray</strong> freeze drying 161<br />
3.0 Mathematical model <strong>of</strong> spray freeze drying 167<br />
3.1 Primary drying stage 167<br />
3.2 Secondary drying stage 174<br />
4.0 Conclusion 175<br />
5.0 References 176<br />
6.0 Nomenclatures 179<br />
1.0 Introduction<br />
<strong>Spray</strong> freeze drying (SFD), a combination <strong>of</strong> two different drying<br />
processes, spray drying (SD) and freeze drying (FD), is an emerging<br />
technology for drying <strong>of</strong> foods, pharmaceutials, biochemicals, ceramics and<br />
fine chemicals. In order to understand the spray freeze drying, both freeze<br />
drying and spray drying were overviewed.<br />
1.1 Freeze drying<br />
Freeze drying also known as “lyophilization” or “cryodesiccation” is a<br />
dehydration process mainly used for pharmaceutical, fine chemical and food<br />
industries to preserve heat sensitive and perishable materials or make the<br />
material more convenient for transportation. The freeze-drying <strong>of</strong> a certain<br />
product <strong>of</strong> interest includes the following steps<br />
[1] :<br />
Sadikoglu – <strong>Spray</strong> freeze drying 157
1. Preparation and formulation step (addition <strong>of</strong> the optimal amount <strong>of</strong><br />
bulking agents, stabilizers, antioxidants, emulsifiers, cryoprotectors,<br />
and/or moisture-buffering agents to the material to be freeze-dried)<br />
2. Freezing step (liquid solutions, gel suspensions, or foodstuffs are<br />
cooled down to their solidification temperature to freeze the free<br />
water in the material)<br />
3. Primary drying step (free or frozen water in the material being<br />
freeze-dried is removed by sublimation under high vacuum),<br />
4. Secondary drying step (certain amount <strong>of</strong> bound water <strong>of</strong> the<br />
material being freeze-dried is removed by desorption under<br />
moderately high vacuum)<br />
5. Packaging and final storage (packing the certain amount <strong>of</strong> freezedried<br />
product with an appropriate packaging material in a sterile<br />
environment and storing the packed product in a controlled<br />
conditions to prevent water vapor and oxygen ingress and light).<br />
The freeze drying process requires intensive energy for sublimation <strong>of</strong><br />
frozen solvent (water) during the primary drying stage, for removing <strong>of</strong> bound<br />
(unfrozen) solvent (water) during the primary and secondary drying stages<br />
and for supporting the vacuum during the entire drying process. In freeze<br />
drying process, heat input to the material being dried, drying chamber<br />
pressure, and, ice condenser temperature are natural control variables. The<br />
magnitude <strong>of</strong> heat input to the material being dried depends on the value <strong>of</strong><br />
the heating plates temperatures. Therefore, the value <strong>of</strong> the heating plate<br />
temperatures must be in admissible range to prevent unacceptable product<br />
quality [2-3] . This means that, during primary drying stage, temperature <strong>of</strong> dried<br />
region must not exceed scorch point while temperature <strong>of</strong> the frozen region<br />
must be less than the melting point <strong>of</strong> the product <strong>of</strong> interest. During<br />
secondary drying stage, temperature at anywhere in the dried sample must<br />
not exceed the scorch point <strong>of</strong> the product.<br />
The drying chamber pressure is the another natural control variable and<br />
affects significantly the mass and heat transfer mechanisms <strong>of</strong> the freezedrying<br />
process. The drying chamber pressure is equal to the sum <strong>of</strong> the partial<br />
pressures <strong>of</strong> water vapor and inerts in the drying chamber. Thus, the value <strong>of</strong><br />
drying chamber pressure can be changed by adjusting the partial pressure <strong>of</strong><br />
water vapor in the chamber (the partial pressure <strong>of</strong> water vapor can be<br />
changed by adjusting the temperature <strong>of</strong> the ice condenser) and by increasing<br />
or decreasing the partial pressure <strong>of</strong> the inerts in the chamber (the partial<br />
pressure <strong>of</strong> the inerts increases by opening a bleeding valve, and decreases<br />
through the use <strong>of</strong> a vacuum pump).<br />
Supplying enough sublimation energy to the moving interface from the<br />
heating plate located at the top <strong>of</strong> the product being freeze dried through<br />
porous dried layer without scorching the dried layer and from the heating plate<br />
located at the bottom <strong>of</strong> the product through frozen layer without melting the<br />
frozen layer is a difficult task. The primary drying stage <strong>of</strong> the freeze drying<br />
process is mass transfer limited process and control <strong>of</strong> drying chamber<br />
pressure becomes dominant. <strong>Drying</strong> chamber pressure should be close to its<br />
minimum value <strong>of</strong> 1-10 Pa to keep mass transfer rate in the dried region <strong>of</strong><br />
material being dried relatively high. As a result <strong>of</strong> low drying chamber<br />
Sadikoglu – <strong>Spray</strong> freeze drying 158
pressure which is close to the absolute vacuum, the main mechanism <strong>of</strong><br />
energy transfer from top heating plate to the upper surface <strong>of</strong> the material<br />
being freeze dried takes place by radiation. The amount <strong>of</strong> energy (heat) that<br />
reached at the top surface <strong>of</strong> the material being freeze dried is transfered to<br />
the moving interface through porous dried layer by conduction. The thermal<br />
conductivity <strong>of</strong> dried layer is very low due to the porous structure. Energy<br />
input to the material being freeze dried from the heating plate located at the<br />
bottom <strong>of</strong> the tray occurs by conduction. The heat that enters to the bottom<br />
surface <strong>of</strong> the material conducted through the frozen layer to the moving<br />
interface. The thermal conductivity <strong>of</strong> the frozen layer is about one order <strong>of</strong><br />
magnitute greater than the thermal conductivity <strong>of</strong> the frozen layer, but<br />
constraint for the frozen layer, which is the melting temperature, is much lower<br />
than the constraint for the dried layer which is the scorch temperature <strong>of</strong> the<br />
dried layer. Hence, the great amount <strong>of</strong> heat required for sublimation at the<br />
moving interface comes from the bottom <strong>of</strong> the product being freeze dried.<br />
During the entire freeze drying period, the heating plate temperatures must be<br />
monitored and controlled properly to prevent any melting and scorching in the<br />
frozen and dried layers, respectively. Low thermal conductivity <strong>of</strong> the dried<br />
layer and low melting temperature <strong>of</strong> the frozen layer cause gradual heat input<br />
to the system resulting in extending the duration drying period.<br />
Even though freeze drying is both slow and expensive (initial investment<br />
and operating cost is high), it has wide range <strong>of</strong> application especially for<br />
drying heat sensitive products in the food, pharmaceutical, biochemical and<br />
biomedical industries.<br />
1.2 <strong>Spray</strong> drying<br />
Another widely used drying from the chemical industry (amino acid,<br />
nitrates, titaniun dioxide, paint pigments, ammonium salts, etc.) to the food<br />
industry (milk, tea, c<strong>of</strong>fee, whey, egg, etc.) and from the pharmaceutical<br />
industry (penicillin, blood products, vaccinees, etc) to the biochemical industry<br />
(yeast extract, algea, enzymes, etc.) is spray drying which has been used<br />
since 1850’s. In spray drying, a solution, slurry, emulsion, gel or paste<br />
pumped into an atomizer that uses a rotating wheel or pressurize nozzle,<br />
which is generally located at the top <strong>of</strong> the drying chamber to obtain highly<br />
dispersed sprayed droplets. The air used in spray drying is drawn from the<br />
atmosphere by a fan, passed through filters and sometimes dehumidified. Air<br />
is heated to a desired temperature by using an oil furnace, a steam heater or<br />
an electrical heater. Highly dispersed sprayed droplets meet the hot air in the<br />
cyclone type drying chamber. After the droplets come in contact with the hot<br />
air, the moisture is transformed into the air, and majority <strong>of</strong> the dried product<br />
falls into the bottom <strong>of</strong> the drying chamber where are they collected. The air<br />
that leaves the drying chamber conveys some <strong>of</strong> the dried products.<br />
Therefore, it is passed through a cyclone separator to catch the dried particles<br />
in the air stream.<br />
Sadikoglu – <strong>Spray</strong> freeze drying 159
There are three fundamental stages in spray drying:<br />
1- Atomization <strong>of</strong> liquid product <strong>of</strong> interest to highly dispersed<br />
droplets,<br />
2- Mixing <strong>of</strong> sprayed droplets with hot gas stream (generally air) to<br />
evaporate moisture <strong>of</strong> the product to obtain fine dried product,<br />
3- Separation <strong>of</strong> the dried products from the exhaust air.<br />
Atomization<br />
The atomizing device, which breaks bulk liquid into small droplets to form<br />
a spray, is the most important equipment in the spray drying process. The<br />
main functions <strong>of</strong> the atomizer are to create a high surface to mass ratio to<br />
facilitate evaporation and to produce particles with desired shape, size and<br />
density. The quality <strong>of</strong> the product produced in a spray dryer and the energy<br />
required to maintain the atomization <strong>of</strong> liquid to form a spray depend heavily<br />
on the selection <strong>of</strong> the atomizer. There are different types <strong>of</strong> atomizers used<br />
commercially in spray drying processes:<br />
1- Rotary or wheel atomizer: Liquid is fed into the center <strong>of</strong> a high speed<br />
rotating wheel to break fluid into small droplets by using centrifugal<br />
energy. The main advantage <strong>of</strong> the rotary or wheel atomizer is the<br />
ability <strong>of</strong> producing homogeneous spray within a wide range <strong>of</strong> mean<br />
droplet size. They are flexible, and can be used for different products.<br />
They are easy to operate, and desired droplet size can be obtained by<br />
adjusting wheel speed. The capital and operational costs are high<br />
compare to the other atomizers. They are not suitable for atomizing<br />
highly viscous materials. Rotary or wheel atomizers can not be utilized<br />
in the horizontal dryers.<br />
2- Pressure nozzle: Pressure nozzle is the most widely used atomizer for<br />
spray dryers. The material being spray dried is supplied to the nozzle<br />
under pressure produced from a high pressure pump. The rotating fluid<br />
allows the nozzle to convert pressure energy <strong>of</strong> liquid into the kinetic<br />
energy to form a thin, high-speed film at the exit <strong>of</strong> the nozzle [4] . The<br />
quality <strong>of</strong> the thin film heavily depends on viscosity, surface tension <strong>of</strong><br />
the liquid feed, the amount <strong>of</strong> feed per unit time and the medium where<br />
material is sprayed. A single pressure nozzle capacity generally does<br />
not exceed 100 l/h, but several nozzles can be utilized in the drying<br />
chamber to increase production capacity. The capital and operational<br />
costs <strong>of</strong> pressure nozzles are lower than the other atomizers. They are<br />
simple, easy to construct and flexible. Operation pressure for the<br />
pressure nozzles can vary from 250 psi (17.4 bar) to 10,000 psi (690)<br />
bar [4] .<br />
3- Pneumatic or two-fluid nozzle: Pneumatic or two-fluid nozzles combine<br />
liquid feed material and compressed air (0.15 MPa to 0.8 Mpa) or<br />
steam in a two-fluid nozzle to atomize the fluid. In general, liquid<br />
material to be spray dried is mixed with the compressed air at the<br />
outside <strong>of</strong> the nozzle, but there are few applications where mixing<br />
occurs inside the nozzle. These types <strong>of</strong> nozzles are able to atomize<br />
highly viscous fluids to produce fine particles. The size <strong>of</strong> the spray<br />
droplets produced by the pneumatic or two-fluid nozzles can be altered<br />
Sadikoglu – <strong>Spray</strong> freeze drying 160
y adjusting air-liquid ratio. The high cost for producing compressed air<br />
makes pneumatic or two-fluid nozzles expensive to operate.<br />
4- Ultrasonic atomization: The conventional atomizers such as rotary (or<br />
wheel), pressure and two-fluid (or pneumatic) atomizers are not<br />
sufficient to atomize highly viscous, non-Newtonian and long molecular<br />
chain structured liquids. Some <strong>of</strong> these liquids form filaments instead <strong>of</strong><br />
spherical droplets when conventional atomizers are used. Recent<br />
studies show that ultrasonic energy and vibration obtained from a sonic<br />
resonance cup placed in front <strong>of</strong> the nozzle can be used to disintegrate<br />
highly viscous liquids to obtain droplets with desired size. Ultrasonic<br />
atomizers can be used to produce fine droplets below 50 µm.<br />
Commercial application <strong>of</strong> ultrasonic atomizers is limited, but expected<br />
to grow over the coming years.<br />
<strong>Drying</strong> Chamber<br />
The design and shape <strong>of</strong> the drying chamber depends heavily on the<br />
final characteristics <strong>of</strong> the dried product, production rate, selected atomizer,<br />
required time for air-dispersed droplet contact. Data obtained from<br />
experimental laboratory or pilot scale spray dryers to determine some basic<br />
design parameters are usually used to design industrial scale spray dryer<br />
chambers. Stainless steel metal sheets are generally used to construct spray<br />
dryer chambers. The outer surface <strong>of</strong> chamber can be insulated when<br />
needed. The mixing <strong>of</strong> the dispersed droplets and air inside the drying<br />
chamber could be co-current or countercurrent or mixed flow. Co-current<br />
contact where atomized droplets fall down with the flowing air, is common<br />
when wheel (or rotary) and nozzle type atomizers are used in the design.<br />
Countercurrent contact where air comes in contact with the spray dried<br />
particles counter currently is suitable for heat sensitive products. The mixed<br />
flow contact consists <strong>of</strong> both co-current and countercurrent contact, and this<br />
type <strong>of</strong> design is usually used when the space for drying chamber is limited<br />
and coarse product is desired [5] .<br />
Powder Collection and Separation<br />
The dried product is collected at the bottom <strong>of</strong> the drying chamber in the<br />
form <strong>of</strong> powder and discharge. The bottom part <strong>of</strong> the drying chamber is<br />
generally in cone shape to facilitate collection <strong>of</strong> the dried product and also<br />
acts as a cyclone separator. Majority <strong>of</strong> the dried product is taken from the<br />
bottom <strong>of</strong> the drying chamber, but some <strong>of</strong> the dried powder goes to the<br />
discharged gas stream and must be separated by a high efficiency cyclone<br />
separator prior to filtration.<br />
Compared with other drying processes, the spray drying has some<br />
advantages. The fine dried powder products with required size and shape can<br />
be produced from any pumpable liquids such as solution, slurry, paste, gel<br />
and suspension. <strong>Spray</strong> dryers can be designed at any capacity from few kg/h<br />
to tons/h for heat-resistant products (ceramic powders, fertilizers and etc.) and<br />
heat sensitive products (pharmaceuticals, bio-chemicals and etc). Automatic<br />
control <strong>of</strong> the process is possible because process parameters in spray drying<br />
can be measured and monitored during the entire drying period. By choosing<br />
appropriate atomizer, altering feed to drying air ratio and adjusting rotational<br />
speed or pressure <strong>of</strong> the compressed air in atomizer, uniform porous<br />
spherical particles in required size and shape can be produced.<br />
Sadikoglu – <strong>Spray</strong> freeze drying 161
2.0 <strong>Spray</strong> freeze drying<br />
<strong>Spray</strong> freeze drying combines the best features <strong>of</strong> both spray and freeze<br />
drying to produce high quality and spherical porous particles in a wide range<br />
<strong>of</strong> sizes, especially for pharmaceutical and bio-chemical uses. The first step in<br />
spray freeze drying is to prepare spherical frozen droplets with the required<br />
properties. In general, two-fluid nozzles or pneumatic nozzles that are the<br />
same nozzles used in spray drying are also used in spray freeze drying to<br />
obtain droplets. By adjusting the compressed air to feed liquid ratio for<br />
intended size <strong>of</strong> frozen particles, the material to be spray freeze dried is<br />
atomized into the cryogenic liquid nitrogen or very cold gas stream for<br />
freezing. Short after the sprayed droplets is in contact with the frozen medium,<br />
they form slurries <strong>of</strong> frozen particles. The collected frozen particles packed in<br />
trays <strong>of</strong> freeze dryer to remove both the free (frozen) and bound (sorbed)<br />
water content <strong>of</strong> the materials (Figure 1). The rest <strong>of</strong> the procedure is the<br />
same as that <strong>of</strong> the conventional freeze drying where the free solvent (water)<br />
content <strong>of</strong> the material is removed by sublimation and bound water content is<br />
removed by desorption during primary and secondary drying stages,<br />
respectively. The initial investment and operational costs <strong>of</strong> the spray freeze<br />
drying process is higher than both spray and freeze drying processes<br />
because the spray freeze drying requires atomization <strong>of</strong> frozen particles in<br />
addition to the conventional freeze drying process. Also, the duration <strong>of</strong> the<br />
drying process in spray freeze drying is higher than the conventional freeze<br />
drying as a result <strong>of</strong> low heat and mass transfer capabilities <strong>of</strong> the porous<br />
structure formed by packing sprayed frozen particles in a tray. The main cost<br />
apportioned are the energy to produce compressed air for atomizing the liquid<br />
feed to produce fine droplets, the energy to maintain freezing medium at subzero<br />
temperatures to obtain frozen slurry, the energy for sublimation <strong>of</strong> the<br />
frozen solvent during primary drying stage, the energy for removal<br />
(desorption) <strong>of</strong> bound (unfrozen) solvent during primary and secondary drying<br />
stages, and the energy to support vacuum during entire drying cycle. Despite<br />
<strong>of</strong> its low productivity and high cost, the spray freeze drying is becoming more<br />
popular process for producing relatively large porous microparticles which are<br />
ideal for pulmonary drug delivery, processing <strong>of</strong> low water soluble drugs [6-8] ,<br />
producing <strong>of</strong> powders for epidermal immunization [7,9] , and the preparation <strong>of</strong><br />
particles for micro-encapsulation [7,10] .<br />
The history <strong>of</strong> the spray freeze drying can be dated back to 1940’s when<br />
Benson and Ellis [11] have studied the surface area <strong>of</strong> protein particles<br />
prepared by spray freezing subsequently freeze drying. In 1964, Werly and<br />
Baumann [12] have produced sub-micronized powder by spray-freezing. The<br />
idea <strong>of</strong> producing fine solid micron or sub-micron sized particles using spray<br />
freezing followed by the freeze drying inspired many inventors, and many<br />
patents issued over the years [13-16] . The variations <strong>of</strong> the effective parameters<br />
such as the pressure <strong>of</strong> nitrogen, pressure <strong>of</strong> liquid feed, flow <strong>of</strong> nitrogen and<br />
flow <strong>of</strong> liquid were studied [17] , and the mass flow ratio which is defined as the<br />
ratio mass <strong>of</strong> nitrogen to the liquid feed was found to be the most important<br />
parameter that affects the size and stability <strong>of</strong> spray freeze dried product. The<br />
Sadikoglu – <strong>Spray</strong> freeze drying 162
effects <strong>of</strong> excipients such as trehalose, mannitol, surfactants and ammonium<br />
sulfate incorporated into the protein solution for stabilization during<br />
atomization and drying <strong>of</strong> protein solution were studied [18] and it was shown<br />
that incorporation <strong>of</strong> excipient into the bovin serum albumin (BSA) stabilized<br />
the solution during spray freeze drying by lowering the specific surface area in<br />
the dried powder. <strong>Spray</strong> freeze drying technique can increase the solubility <strong>of</strong><br />
the low water soluble drugs by reducing the size <strong>of</strong> the drug particles [6] . The<br />
spray freeze dried powder with smaller particle size and higher surface area<br />
results from porous structure <strong>of</strong> particles which have better wettability and<br />
faster dissolution rates in aqueous medium [19] . Specific surface areas <strong>of</strong><br />
various powders obtained from different techniques were compared [20] and<br />
the spray freeze dried powders were found to have largest specific area.<br />
Feed<br />
Air<br />
Freeze drying<br />
Atomizer<br />
Trays<br />
<strong>Spray</strong><br />
freezing<br />
Frozen<br />
granules<br />
Liquid<br />
N 2<br />
Ice<br />
condenser<br />
ccondencerc<br />
-60 o C<br />
Vacuum<br />
Figure 1<br />
Diagram <strong>of</strong> the spray drying process<br />
Another current and potential use <strong>of</strong> the spray freeze drying is in microencapsulation<br />
which is defined as a process for coating <strong>of</strong> very small droplets<br />
or particles <strong>of</strong> liquid or solid materials with polymeric films. The microencapsulation<br />
process has a wide range application in chemical, material<br />
science, food and pharmaceutical industries. Micro-encapsulation can be<br />
used to isolate core material such as vitamins from the destructive effect <strong>of</strong><br />
oxygen, to prevent evaporation <strong>of</strong> a volatile core such as aroma and flavor, to<br />
improve the handling <strong>of</strong> the sticky materials and to buffer reactive core from a<br />
chemical attack. In the pharmaceutical industry, micro-encapsulation is used<br />
for protection, stabilization and controlled release <strong>of</strong> drugs. The model protein<br />
bovine serum albumin (BSA) obtained from spray freeze drying process<br />
successfully encapsulated into poly (D,L lactide-co-glycolide) (PLG) microspheres<br />
for controlled release <strong>of</strong> native protein [21] . A water soluble drug,<br />
Sadikoglu – <strong>Spray</strong> freeze drying 163
procaine hydrochloride, was successfully encapsulated in a microcapsule<br />
core, porous structured biodegradable poly(DL-lactide) (PLA) that was<br />
prepared by spray freeze drying. The particle morphology, the amount <strong>of</strong><br />
solvent used, solvent exposure time, the amount <strong>of</strong> the surfactant and the<br />
method <strong>of</strong> dispersing the freeze-dried particles in water were found to the<br />
amount <strong>of</strong> the effective parameters in the encapsulation process [22] . The<br />
effective process parameters for producing spray freeze dried therapeutic<br />
protein such as, recombinant human growth hormone (rhGH) for<br />
encapsulation were studied [10] and the mass flow ratio <strong>of</strong> atomization was<br />
found to be the most important factor. High mass flow rates contribute the<br />
production sprayed protein powders with a very fine and friable microstructure<br />
that helps controlled release <strong>of</strong> therapeutic proteins. The impact <strong>of</strong> various<br />
excipients to stabilize human immunoglobulin G (IgG) during atomization<br />
period <strong>of</strong> spray freeze drying followed by subsequent encapsulation into<br />
polylactide-co-glycolide (PLGA) microspheres were studied and mannitol and<br />
trehalose were found as appropriate additives protecting IgG from<br />
degradation [23] . Lam et al. [23] encapsulated recombinant human nerve growth<br />
factor (rhNGF) into poly (lactic-co-glycolic) acid (PLGA) microspheres using a<br />
spray freeze drying technique.<br />
Micro-encapsulation is also one <strong>of</strong> the promising processes to produce<br />
functional foods fortified with health-promoting additives. By using spray<br />
freeze drying procedure, Lactobacillus paracasei was successfully<br />
microencapsulated with high viability for probiotic use [25] . Even though the<br />
spray freeze drying is considered to be the most suitable process to prepare<br />
friable solid powders with high specific surface area for encapsulation, some<br />
researchers reported that the spray freeze drying is not a suitable process to<br />
produce darbepoetin alfa particles for encapsulation as a result <strong>of</strong> high<br />
aggregation during drying and reconstitution [26,27] .<br />
Producing advanced ceramics with unique electrical properties such as<br />
superconductivity or superior mechanical properties (enhanced toughness<br />
and high-temperature strength) depends on using highly pure synthetic<br />
precursor powders with desired properties. The ability <strong>of</strong> producing granules<br />
with a density and homogeneity that directly corresponds to the<br />
characteristics <strong>of</strong> the original suspension makes the spray freeze drying<br />
technique significant process for producing precursor powders. In order to<br />
prepare homogenous and reactive precursor powders for advanced ceramics,<br />
a mixture <strong>of</strong> water-soluble salts such as sulfates are dissolved in water to<br />
obtain a highly dispersed solution. Prepared salt solution is sprayed into<br />
chilled organic liquids such as hexane with an atomizer to obtain frozen<br />
droplets for desired size and property. The frozen material separated from the<br />
liquid hexane is passed through the sieves and packed in a tray then<br />
undergoes the freeze drying to remove solvent (water) by sublimation under<br />
vacuum. Particle shrinkage, strong inter-particle bonds, and the migration <strong>of</strong><br />
additives that occur during the conventional drying can be eliminated by using<br />
freeze drying technique. Similar to other use <strong>of</strong> the spray freeze drying, the<br />
shape and size <strong>of</strong> the granules can be controlled by the solution rheology,<br />
spray flow rate and applied gas pressure at atomizer.<br />
Highly porous and temperature resistant the magnesia ceramics for<br />
combustion catalyst support was obtained by spraying magnesium sulfate<br />
aqueous solution into cooled n-hexane and subsequently freeze dried [28] . The<br />
water based nitrate solutions sprayed from an atomizer into liquid nitrogen to<br />
Sadikoglu – <strong>Spray</strong> freeze drying 164
obtain fine frozen particles were dried in an industrial freeze dryer to produce<br />
precursors for synthesizing superconducting Bi-2223 ceramic [29] . Lee et al. [30]<br />
have prepared perovskite-type LaCoO 3 oxides by spray freeze drying <strong>of</strong><br />
citrate precursor. They have reported that spray freezing <strong>of</strong> precursor followed<br />
by freeze drying reduced calcination temperature, enhanced amount <strong>of</strong> the<br />
precursor, and increased surface area <strong>of</strong> the product (LaCoO3). Itatani et<br />
al. [31] reported that the spray freeze drying technique can be used to produce<br />
various calcium-phosphate powders with minimal agglomeration.<br />
Even though spray freeze drying has a wide range <strong>of</strong> application in<br />
ceramics industry to produce fine precursors for synthesizing advanced<br />
ceramics such as superconductors [32] , temperature resistant and highly<br />
durable materials, and in the food industry to produce functional foods such<br />
as probiotics and high value foods, it has undisputed future in the<br />
pharmaceutical industry especially in producing pulmonary inhalable drugs.<br />
The pulmonary delivery <strong>of</strong> biopharmaceuticals requires to produce particles<br />
with the optimal properties for deep lung deposition without violating active<br />
ingredient <strong>of</strong> molecules. There are several ways such as milling (vibration<br />
milling, ball milling, and jet milling), controlled solvent crystallization,<br />
supercritical fluid processing, liquid dispersion systems, spray drying and<br />
spray freeze drying to obtain inhalation powder drug for pulmonary delivery.<br />
The overall efficiency <strong>of</strong> the inhalation powder drugs depends on the amount<br />
<strong>of</strong> fine particles delivered to lung and lung bioavailability [33] . The size,<br />
morphology, dispersability and aerodynamics behavior <strong>of</strong> the particles play an<br />
important role on the efficiency <strong>of</strong> inhalation process. Incorporating desirable<br />
attributes, such as narrow size distribution, enhanced protein stability,<br />
improved dispersability, sustainable release, or enhanced targeting into the<br />
particles are the main challenge to prepare inhalable powder drugs for<br />
pulmonary drug delivery [33-35] . Safe and novel excipients such as poly (lacticco-glycolic)<br />
acid (PLGA), dipalmitoylphosphatidyl-choline (DPPC), lactose,<br />
mannitol, trehalose, albumin, and etc., or should be used to improve the<br />
performance <strong>of</strong> inhalation powder drugs. Producing inhalation powder drug<br />
and excipients with required characteristics may regulate the release in lung,<br />
target certain areas in the lung, avoid macrophage uptake, increase particle<br />
mass inhaled per breath, facilitate epithelial permeability and drug absorption,<br />
and improve therapeutic action [35] .<br />
The success <strong>of</strong> inhaled medical powders commonly used to cure<br />
diseases <strong>of</strong> the lung such as asthma and cystic fibrosis depends heavily on<br />
the particle characteristics <strong>of</strong> the powders such as aerodynamic diameter that<br />
can be altered to deliver drug particles to different areas <strong>of</strong> the lung.<br />
Aerodynamic diameter is a physical property <strong>of</strong> a particle in a viscous fluid<br />
such as air. In general, particles have irregular shapes with actual geometric<br />
diameters that are difficult to measure. Aerodynamic diameter characterizes<br />
the aerodynamic behavior <strong>of</strong> the particle by taking into account the shape,<br />
size and density <strong>of</strong> the particles. The aerodynamic diameter d ae can be<br />
derived by employing Stoke's Law and is defined as Eq. (1):<br />
d<br />
ρ<br />
p<br />
ae<br />
= d<br />
p<br />
(1)<br />
χρ0<br />
Sadikoglu – <strong>Spray</strong> freeze drying 165
where ρ p is the particle density (g/cm 3 ), χ is the dynamic shape factor<br />
(dimensionless), ρ 0 is standard particle density (g/cm 3 ) and d p is the geometric<br />
diameter <strong>of</strong> the particle (cm). The dynamic shape factor, χ, is the ratio <strong>of</strong> the<br />
drag force on a particle to the drag force on the particle volume-equivalent to<br />
the sphere at the same velocity [33] . The value <strong>of</strong> the dynamic shape factor for<br />
a perfect spherical particle is 1, but as the shape <strong>of</strong> the particle diverges from<br />
the sphere, the dynamic shape factor can take a value greater than 1. For<br />
example, the value <strong>of</strong> dynamic shape factor for non-spherical shapes such as<br />
platelets, rods or fibers can be as high as 10. The aerodynamic diameter for a<br />
spherical particle, as it is given in Eq. (1), is proportional to the geometric the<br />
diameter <strong>of</strong> particle and the square root <strong>of</strong> the particle density. The value <strong>of</strong><br />
the aerodynamic diameter can be reduced by either decreasing the geometric<br />
diameter <strong>of</strong> the particle, reducing the particle density or both. The<br />
aerodynamic diameter is the key parameter for pulmonary drug delivery.<br />
Many experimental and theoretical studies have showed that the particles with<br />
mean aerodynamic diameter <strong>of</strong> 1–3 µm have a tendency to deposit mainly in<br />
alveolar region (deep lung) <strong>of</strong> the lung which is the primary target to deliver<br />
therapeutic dose for different lung diseases. The inhalation powder drug <strong>of</strong><br />
mean aerodynamic diameter <strong>of</strong> 1–3 µm is considered to be optimal size for<br />
inhalation drug delivery and deposits minimally in the mouth and throat. On<br />
the other hand, particles with aerodynamic diameter greater than 6 µm tend to<br />
deposit Tracheobronchial region, generally not desired for an inhalation<br />
therapy. Particles with small aerodynamic diameter such as 1 µm or less are<br />
mostly exhaled as breathing while particles with large aerodynamic diameter<br />
such as 10 µm or more have little chance to reach beyond the mouth [36] .<br />
Large porous particles with small mass density and large geometric<br />
diameter obtained by using the spray freeze drying method is considered to<br />
be highly effective for pulmonary drug delivery. Having nearly identical<br />
aerodynamic diameters, the inhalation ability <strong>of</strong> the small size and high mass<br />
density non-porous particles is better than the large size and low mass<br />
density porous particles as a result <strong>of</strong> smaller surface to volume ratio and less<br />
deposition in dry powder inhaler (DPI). Increasing particle size reduces<br />
phagocytosis <strong>of</strong> particles by macrophages. Large particles have tendency to<br />
deposit in the pulmonary region that may escape clearance by alveolar<br />
macrophages and; therefore, permit drug release for longer periods <strong>of</strong> time<br />
[36] .<br />
The spray freeze drying method has a promising future for producing<br />
therapeutics inhalation powders for pulmonary drug delivery compare to spray<br />
drying and milling. The micro-particles produced by the spray freeze drying<br />
have relatively large porous structure and better fine particle fraction. The<br />
spray freeze drying is the combination <strong>of</strong> both spray and freeze drying<br />
processes; hence, productivity is low and initial investment and operation all<br />
costs are high. The spray freeze drying involves the packing <strong>of</strong> frozen slurry in<br />
a container. Thus, a packed bed <strong>of</strong> frozen particles have porous structure that<br />
make it complicated to supply enough heat to the material being freeze dried<br />
for sublimation. As a result <strong>of</strong> poor transport properties, the duration <strong>of</strong> spray<br />
freeze drying cycle is much greater than the conventional freeze drying<br />
process. The operation cost is a function <strong>of</strong> drying time, and reducing the<br />
drying time without causing any loss in quality <strong>of</strong> product is the main<br />
challenge for the spray freeze drying process to have a future in the<br />
production <strong>of</strong> pulmonary inhalable drugs. In order to construct operational<br />
control policies to optimize the spray freeze drying process by reducing both<br />
Sadikoglu – <strong>Spray</strong> freeze drying 166
duration <strong>of</strong> drying time and intensive energy usage without violating any<br />
constraint, knowledge about the heat and mass transfer mechanisms involved<br />
in the primary and secondary drying stages are crucial. Previous studies have<br />
shown that establishing both qualitative and quantitative control policies on<br />
natural control variables such as drying chamber pressure, heat input and<br />
condenser temperature <strong>of</strong> conventional freeze drying can substantially reduce<br />
drying times and costs <strong>of</strong> each drying batch [2,3, 37] .<br />
3.0 Mathematical modelling <strong>of</strong> spray freeze drying<br />
3.1 Primary drying stage<br />
In order to predict duration <strong>of</strong> the drying, temperature distributions,<br />
water vapor pressure, inert gas pressure and bound water content at any<br />
given time, during both the primary and secondary drying stages <strong>of</strong> spray<br />
freeze drying process, some dynamic multi-dimensional mathematical models<br />
were proposed. Among these, the model developed by Liapis and Bruttini [7] is<br />
an advanced mathematical model to qualitatively and quantitatively describe<br />
the dynamic behavior <strong>of</strong> spray freeze drying process. In Figure 2, the<br />
diagrams <strong>of</strong> a material on a tray during spray freeze drying and descriptions <strong>of</strong><br />
the frozen solvent (water) in a frozen particle and the pores resulting from the<br />
sublimation <strong>of</strong> frozen water during the primary drying stage to form a porous<br />
dried particle are given. The variable Z(t) represents the position <strong>of</strong> the<br />
moving interface between partially saturated porous frozen region II formed by<br />
packing frozen particles and porous dried layer I <strong>of</strong> a material on a tray.<br />
During the primary drying stage <strong>of</strong> spray freeze drying, water vapor resulted<br />
mainly from the sublimation <strong>of</strong> frozen free water, and negligible amount<br />
obtained from desorbing bound water content while during the secondary<br />
drying stage the water vapor resulted from only desorbing bound water <strong>of</strong> the<br />
material being spray freeze drying moves through the pores dried layer I to<br />
reach condenser part <strong>of</strong> the drying chamber for removal. The disappearance<br />
<strong>of</strong> the partially saturated porous frozen region II is considered to be the end <strong>of</strong><br />
the primary drying stage that is the starting <strong>of</strong> the secondary drying stage. As<br />
it is shown in Figure 2 q I , q II and q III represent the amount <strong>of</strong> heat fluxes to the<br />
material being spray freeze dried in a packed bed from the top, bottom and<br />
side surfaces <strong>of</strong> the tray, respectively.<br />
In primary drying stage, the energy balance equation that represents<br />
temperature distribution in dried region I <strong>of</strong> the packed bed is as follows:<br />
2<br />
∂TI ∂ T c<br />
I pg ⎛ ∂Nt , I ∂TI<br />
⎞ ∆HV ρI ⎛ ∂Csw<br />
⎞<br />
= α<br />
Ie<br />
− T<br />
2 ⎜ I<br />
− Nt,<br />
I ⎟ + ⎜ ⎟<br />
∂t ∂z ρIecpIe ⎝ ∂z ∂z ⎠ ρIecpIe<br />
⎝ ∂t<br />
⎠<br />
(2)<br />
The numerical values for the parameters used in Eq. (2) are given in<br />
[7, 38]<br />
Table 1 by employing volume-averaging theory that uses physical<br />
properties <strong>of</strong> the gas and solid phases. The last term in the Eq. (2) accounts<br />
for the removal <strong>of</strong> sorbed water during primary drying stage and it has shown<br />
Sadikoglu – <strong>Spray</strong> freeze drying 167
to be negligible [7,37,39] . The parameter ρ represents the density <strong>of</strong> the solid in<br />
dried region I while ρ Ie , c pIe and k Ie represent effective parameters. The<br />
variable N t,I is the sum <strong>of</strong> water vapor and inerts mass flux vectors and<br />
represents the total amount <strong>of</strong> mass removed from the unit square <strong>of</strong> the<br />
material being spray freeze dried in unit time (in second). The constitutive<br />
equations for water vapor and inerts mass flux in the pores <strong>of</strong> dried layer I can<br />
be obtain from dusty-gas model [2,7,39] .<br />
M ⎛ ∂p w<br />
w,1 ⎛ ∂pin,1 ∂pw,1<br />
⎞⎞<br />
Nw,1 = − ⎜ k1, II<br />
+ k2, II<br />
pw,1<br />
⎜ + ⎟⎟<br />
RgTI<br />
⎝ ∂z ⎝ ∂z ∂z<br />
⎠⎠<br />
(3)<br />
M ⎛ ∂p in<br />
in,1 ⎛ ∂pin,1 ∂pw,1<br />
⎞⎞<br />
Nin,1 = − ⎜ k3, II<br />
+ k4, II<br />
pin,1<br />
⎜ + ⎟⎟<br />
RgTI<br />
⎝ ∂z ⎝ ∂z ∂z<br />
⎠⎠<br />
(4)<br />
The parameters k 1 and k 3 are the bulk diffusivity constants, k 2 and k 4 are<br />
the self-diffusivity constants and p w and p in are the partial pressures for water<br />
vapor and inerts, respectively, in dried layer I. The dusty-gas model does not<br />
require detailed information about the porous structure <strong>of</strong> the dried layer I [7] ,<br />
and it is easy to use. The Darcy’s flow permeability, C 01 that is parameter for<br />
self-diffusivity constants (k 2 , k 34 ) could be obtained from the Blake-Kozeny<br />
correlation [7,40] .<br />
C<br />
ε<br />
3<br />
pb<br />
01<br />
≅ −<br />
2<br />
150(1 − ε<br />
pb)<br />
d<br />
2<br />
p<br />
(5)<br />
Where, d p denotes the diameter <strong>of</strong> the frozen particles packed on a tray<br />
while ε pb represents the porosity <strong>of</strong> the packed bed formed by packing frozen<br />
particles.<br />
ε<br />
pb<br />
=<br />
volume <strong>of</strong> pores in the particle<br />
volume <strong>of</strong> the particle<br />
Experimently proven [7] that dimensional change <strong>of</strong> spray frozen particle<br />
during both primary and secondary drying stages is negligible and the value <strong>of</strong><br />
the d p is considered to be constant during entire drying run. As a result <strong>of</strong> the<br />
minimal dimensional change in the diameter <strong>of</strong> frozen particle, macroporosity,<br />
ε pb , <strong>of</strong> packed considered to be the same for both dried layer I and partially<br />
saturated porous frozen layer II. The heat and mass transfer resistances in<br />
dried layer <strong>of</strong> a material undergoing spray freeze drying is larger than that<br />
could be encountered in dried layer <strong>of</strong> the same material undergoing the<br />
conventional freeze drying, because, the porosity <strong>of</strong> the dried layer I in spray<br />
freeze drying is significantly lower than the conventional freeze drying. The<br />
expression for the removal <strong>of</strong> the bound water is as follows:<br />
∂c<br />
∂t<br />
sw<br />
= −k<br />
des<br />
c<br />
sw<br />
(6)<br />
Sadikoglu – <strong>Spray</strong> freeze drying 168
where, the parameter k des , represents desorption rate constant <strong>of</strong> the linear<br />
rate mechanism that could be used to describe the desorption (removal) <strong>of</strong><br />
bound water [7,39] .<br />
The ice saturation, S, that is defined as the fraction <strong>of</strong> the ice volume to the<br />
pore volume in the particle is given by:<br />
4<br />
ε<br />
pπ<br />
d<br />
S = 3 = 4 3<br />
⎜<br />
ε<br />
d ⎟<br />
p<br />
pπ<br />
d ⎝ ⎠<br />
p<br />
3<br />
3 3<br />
ice ⎛ d ⎞<br />
ice<br />
(7)<br />
where, the parameter, d ice , represents the diameter <strong>of</strong> an ice core in the<br />
particle. The continuity equations for the water vapor and the inert gas in the<br />
pores <strong>of</strong> the porous dried layer I can be expressed as follows:<br />
∂p R T ⎛ ∂N ∂C<br />
= − + ρ<br />
∂ ⎝ ∂ ∂<br />
w, I g I t,<br />
I sw<br />
⎜<br />
I<br />
t εt,<br />
I<br />
M<br />
w<br />
z t<br />
⎞<br />
⎟<br />
⎠<br />
(8)<br />
∂pin,1 RgTI<br />
⎛ ∂Nt , I ⎞<br />
= − ⎜ ⎟<br />
∂t εt,1M in ⎝ ∂z<br />
⎠<br />
(9)<br />
The parameter, ε pb , represents the total porosity <strong>of</strong> the dried layer I, and can<br />
be expressed as follows:<br />
ε = ε + (1 − ε ) ε<br />
(10)<br />
t,I pb pb p<br />
z=0<br />
z=L<br />
z=Z(t)<br />
b<br />
Sadikoglu – <strong>Spray</strong> freeze drying 169
Figure 2<br />
(a) Diagram <strong>of</strong> a material being spray freeze dried in a tray. (b)<br />
Depictions <strong>of</strong> the frozen solvent (water) in a frozen particle and<br />
the pores resulting from the sublimation <strong>of</strong> frozen water during<br />
the primary drying stage to form a porous dried particle.<br />
The energy and material balances in the porous frozen layer II are as<br />
follows [7] :<br />
2<br />
∂TII ∂ T c<br />
I pg ⎛ ∂Nt , II ∂TII<br />
⎞ ∆H s<br />
∂S<br />
∆HV ρI ⎛ ∂Csw<br />
⎞<br />
= α<br />
II<br />
− T<br />
2 ⎜ II<br />
− Nt,<br />
II ⎟ + ( ρ<br />
f<br />
− ρd<br />
) +<br />
∂t ∂z ρIIc pII<br />
∂z ∂z ρIIcpII ∂t ρIIc ⎜<br />
pII<br />
∂t<br />
⎟<br />
⎝<br />
⎠<br />
⎝ ⎠<br />
(11)<br />
∂<br />
∂<br />
( ε )<br />
p R T ⎛ ∂N ∂C ∂S<br />
⎞<br />
( ) ⎟<br />
∂t M ⎝ ∂z ∂t ∂t<br />
⎠<br />
t, II w, II g II w,<br />
II sw<br />
= − ⎜ + ρI − ρ<br />
f<br />
− ρd<br />
w<br />
( ε )<br />
p R T ⎛ ∂N<br />
⎞<br />
= − ⎜ ⎟<br />
∂t εt,<br />
II<br />
M<br />
in ⎝ ∂z<br />
⎠<br />
t, II in, II g II in,<br />
II<br />
(12)<br />
(13)<br />
Water vapor and inerts mass flux in unsaturated porous frozen layer II can be<br />
determined using Eq. (14) and Eq.(15), respectively.<br />
M ⎛ ∂p w<br />
w, II ⎛ ∂pin, II<br />
∂pw,<br />
II ⎞⎞<br />
Nw, II<br />
= − ⎜ k1, II<br />
+ k2, II<br />
pw,<br />
II ⎜ + ⎟⎟<br />
RgTII<br />
⎝ ∂z ⎝ ∂z ∂z<br />
⎠⎠<br />
(14)<br />
M ⎛ ∂p in<br />
in, II ⎛ ∂pin, II<br />
∂pw,<br />
II ⎞⎞<br />
Nin, II<br />
= − ⎜ k3, II<br />
+ k4, II<br />
pin,<br />
II ⎜ + ⎟⎟<br />
RgTII<br />
⎝ ∂z ⎝ ∂z ∂z<br />
⎠⎠<br />
(15)<br />
The parameters used in Eq. (11) through Eq. (15) can be calculated by using<br />
volume- averaged approach [7,40] .<br />
ε = ε + (1 − ε ) ε (1 − )<br />
(16)<br />
t,II pb pb p<br />
S av<br />
( )<br />
ρ ≅ S ρ + (1 − S ) ρ = (1 − ε ) S ρ + (1 − S ) ρ<br />
(17)<br />
II av f av d pb av f , s av d , s<br />
( )<br />
ρ c ≅ S ρ c + (1 − S ) ρ c = (1 − ε ) S ρ c + (1 − S ) ρ c (18)<br />
II pII av f pf av d pd pb av f , s pf , s av d , s pd , s<br />
k = S k + (1 − S ) k = S (1 − ε ) k + (1 − S )(1 − ε ) k<br />
(19)<br />
3/ 2 3/ 2<br />
II av f av d av pb f , s av pb d , s<br />
ρf = (1 − ε<br />
pb<br />
) ρ<br />
f , s<br />
(20)<br />
Sadikoglu – <strong>Spray</strong> freeze drying 170
ρd = (1 − ε<br />
pb<br />
) ρ d , s<br />
(21)<br />
ρ<br />
= (1 − C ) ρ d s f<br />
(22)<br />
d,s sw , ,<br />
ρI = (1 − ε<br />
pb<br />
) ρ d , s , f<br />
(23)<br />
The parameter, S av , represents the volume-averaged ice saturation<br />
( 0 ≤ Sav<br />
≤ 1) and equal to integral mean <strong>of</strong> dimensionless ice saturation, S,<br />
over the volume <strong>of</strong> the porous frozen region II occupied by particles. In Eq.<br />
(16), ε p,II , represents the total porosity <strong>of</strong> the porous frozen layer II, and its<br />
value varies with time because the value <strong>of</strong> the volume-averaged ice<br />
saturation, S av , varies with time.<br />
S<br />
av<br />
V II , p<br />
1<br />
= SdVII , p<br />
V<br />
∫ (24)<br />
II , p 0<br />
The parameters, ρ f , c pf , and k f , defined in Eqs. (17) through (20) represent the<br />
apparent density, heat capacity and thermal conductivity <strong>of</strong> a frozen particle<br />
based material (S av =1), respectively, while the parameters ρ d , c pd , and k d<br />
defined in Eqs. (17) through (19) and (21) denote apparent density, heat<br />
capacity and thermal conductivity <strong>of</strong> a dried particle based material,<br />
respectively, after the primary drying (S av =0). The parameters, c pf,s and k f,s ,<br />
defined in Eqs. (18)-(19) represent the heat capacity and thermal conductivity<br />
<strong>of</strong> a frozen solution based material, respectively, while the parameters c pf,d<br />
and k f,d that defined in Eqs. (18)-(19) denote heat capacity and thermal<br />
conductivity <strong>of</strong> a dried solution based material, respectively. Finally, the<br />
parameter, ρ d,s,f , denotes the density <strong>of</strong> the solution based material when it is<br />
fully dried and both forms <strong>of</strong> frozen and sorbed water have been removed [7] .<br />
The water vapor pressure in porous frozen layer II can be calculated directly<br />
from the following expression [7,40] :<br />
( )<br />
p p T<br />
sat<br />
( − 2663.5/ TII<br />
) + 12.537<br />
w, II<br />
=<br />
w II<br />
= 10 (25)<br />
When the value <strong>of</strong> S>0, the term ∂p<br />
,<br />
the following equation:<br />
w II<br />
∂t<br />
in Eq. (12) could be determined from<br />
∂p dp ∂T<br />
=<br />
∂t dT ∂t<br />
sat<br />
w,<br />
II w II<br />
II<br />
(26)<br />
where, the term ∂T<br />
II<br />
∂t<br />
can be obtained by solving <strong>of</strong> Eq. (11). The evolution <strong>of</strong><br />
ice saturation, S, can be obtained by solving <strong>of</strong> Eq. (12). An energy balance<br />
at the moving interface, whose thickness is taken infinitesimal, can be express<br />
as follows:<br />
k ∂T − k ∂T + c T − c T ∂Z<br />
+ c T N = ∆H N<br />
∂z ∂z ∂t<br />
( ρ ρ ) int ,int ,int<br />
II<br />
I<br />
II Ie II pII II I pI I pg erf t erf s w erf<br />
(27)<br />
Sadikoglu – <strong>Spray</strong> freeze drying 171
In Eq.(27), T interf , denotes the temperature <strong>of</strong> the interface (T interf =T I =T II ),<br />
N w,interf represents water vapor mass flux at the moving interface and N t,interf<br />
represents total mass flux (sum <strong>of</strong> water vapor mass flux and inert mass flux)<br />
at the moving interface. ∂Z<br />
∂t<br />
denotes the velocity <strong>of</strong> the moving interface and<br />
can be defined as follows [2-3,7,37, 39] :<br />
∂ Z Nw,int<br />
erf<br />
= −<br />
∂t ρ − ρ<br />
II<br />
I<br />
(28)<br />
Table 1 Expressions and values for the physical parameters<br />
c pd,s = 2590 J/kg K<br />
c pf,s = 1930 J/kg K<br />
c pg = 1616.6 J/kg K<br />
0<br />
C =0.6415 kg water/kg solid<br />
sw<br />
( )<br />
( z=0 z=Z<br />
)<br />
-6 2.334<br />
( w,in ) ( i )<br />
i<br />
i<br />
3/ 2<br />
-4<br />
kIe<br />
( ε<br />
pb ) ( I I )<br />
D = 4.342x10 T /P m 2 /s for I and II<br />
= 1− 2.596x10 P + P + 0.039806 W/m K<br />
k des = 6.48x10 -7 s -1 during the primary drying stage<br />
k des = 7. 80x10 -5 s -1 during the secondary drying stage<br />
k d,s = 2.596x10 -4 (P II | z=Z + P II | z = L ) + 0.039806 W/m K<br />
k f,s = 2.56 W/m K<br />
L = 0.01 m<br />
M in = 28.82 kg/kmol<br />
M w = 18.00 kg/kmol<br />
p =5.07 Pa, at t = 0 and 0≤z≤ L for i = I, II<br />
p<br />
p<br />
0<br />
i<br />
0<br />
in,i<br />
0<br />
w,i<br />
=4.0 Pa, at t = 0 and 0≤z≤ L for i = I, II<br />
=1.7 Pa, at t = 0 and 0≤z≤ L for i = I, II<br />
R g = 8.314 J/K mol<br />
T lp = T up = 253.15 K for primary drying stage<br />
T lp = T up = 293.15 K for secondary drying stage<br />
T m = 263.15 K<br />
T scor = 313.15 K<br />
0<br />
T<br />
i<br />
=233.15 K, at t = 0 and 0≤z≤ L for i = I, II<br />
∆H s =2687.4 kJ/kg<br />
∆H v =2840 kJ/kg<br />
ε p = 0.785<br />
ε pb = 0.50<br />
−7 1.5<br />
µ = 18.4558x10 T / T + 650 kg/ms, for i = I, II<br />
( ( ))<br />
mx i i<br />
0<br />
( C ) ( C )<br />
ρd , s<br />
= 328 ⎡ 1<br />
sw<br />
/ 1 ⎤<br />
⎣<br />
+ +<br />
sw ⎦ kg/m3<br />
ρ d,s,f = 199.817 kg/m3<br />
ρ f,s = 1030 kg/m3<br />
( ) ,<br />
c<br />
,<br />
ρ c ≅ 328 1−<br />
ε ρ<br />
Ie pIe pb d s pd s<br />
τ<br />
I<br />
=<br />
2 dimensionless<br />
Sadikoglu – <strong>Spray</strong> freeze drying 172
τ = 2 dimensionless<br />
II<br />
The initial and boundary conditions for Eqs.(2), (6), and (8) through (13) for<br />
spray freeze frying on a tray are as follows:<br />
= = = = 0 , 0 ≤ ≤ (29)<br />
0<br />
TI TII TZ<br />
T at t z L<br />
p = p , p = p at t = 0 , 0 ≤ z ≤ Z( t)<br />
(30)<br />
0 0<br />
w w in in<br />
C = C at t = 0 , 0 ≤ z ≤ L<br />
(31)<br />
sw<br />
0<br />
sw<br />
∂T<br />
q = k at z = 0 , t ≥ 0 where q = σ F T −T (0, t)<br />
4 4<br />
( )<br />
I<br />
I Ie I up I<br />
∂z<br />
z=<br />
0<br />
(32)<br />
T = T = T at z = Z( t), t ≥ 0<br />
(33)<br />
I II Z<br />
∂TII<br />
qII<br />
= kII<br />
at z = L , t ≥ 0<br />
∂<br />
z<br />
z=<br />
L<br />
(34)<br />
For radiation heat transfer to the bottom <strong>of</strong> tray,<br />
4<br />
( 4 ( , ))<br />
q = σ F T − T L t<br />
(35)<br />
II lp II<br />
For a thin film between the frozen material and lower plate,<br />
( ( , ))<br />
q = h T − T L t<br />
(36)<br />
II Lp II<br />
The value <strong>of</strong> the thermal film conductivity, h, could be found in [2,3,39] , and<br />
suitably adjusted to account for the lowered pressure in the freeze-drying<br />
process. The variable, p w0 , is the partial pressure <strong>of</strong> water vapor in the<br />
chamber, usually determined by the condenser design and assumed constant<br />
within the drying chamber [39] . The variable, P 0 , denotes the sum <strong>of</strong> partial<br />
pressure <strong>of</strong> water vapor and inerts (P 0 = p w0 + p in0 ) at z = 0, and is usually<br />
considered to be approximately equal to the total pressure in the drying<br />
chamber.<br />
p = p , p = P − p at z = 0 , t ≥ 0<br />
(37)<br />
w w0 in c w0<br />
Sadikoglu – <strong>Spray</strong> freeze drying 173
( z=<br />
Z t )<br />
pw<br />
= f T at z = Z( t) , 0 ≤ t ≤ t<br />
( ) pd<br />
(38)<br />
∂p<br />
∂<br />
in<br />
z<br />
z=<br />
Z ( t )<br />
= 0 at z = Z( t), 0 ≤ t ≤ t<br />
pd<br />
(39)<br />
The initial condition for Eq. (28) is as follows:<br />
Z = 0 at t = 0<br />
(40)<br />
The initial and boundary conditions for Eqs. (12) and (13) are as follows:<br />
S = 1 at t = 0<br />
(41)<br />
p = p at t = (42)<br />
0<br />
in, II in, II<br />
0<br />
∂<br />
p in , II<br />
∂z<br />
= 0 at impermeable surfaces<br />
(43)<br />
The equations given from Eq. (2) through Eq. (42) represent the<br />
mathematical model and the parameters that could be used to describe the<br />
dynamic behavior <strong>of</strong> the primary drying stage <strong>of</strong> spray freeze drying in a tray.<br />
The heat input from the upper heating plates to the top surface <strong>of</strong> the sample<br />
(q I ), the heat input from lower heating plates to the bottom surface <strong>of</strong> the<br />
sample (q II ), and drying chamber pressure (P 0 ) are the natural control<br />
variables. The control variables must be selected from set <strong>of</strong> admissible<br />
controllers that (i) the temperature, T interf , <strong>of</strong> moving interface and the<br />
temperature, T II , in the region <strong>of</strong> the porous frozen layer II (S>0) must be less<br />
than the melting temperature, T m , <strong>of</strong> the frozen material, (ii) and the<br />
temperature, T I , in porous dried layer I and the temperature, T II , in the porous<br />
frozen layer II (S=0) must be less than the scorch temperature, T scor , <strong>of</strong> the<br />
material being spray freeze dried.<br />
3.2 Secondary drying stage<br />
In the secondary drying stage, there is no longer porous frozen layer II<br />
available, and thus, there is no moving sublimation interface. The secondary<br />
drying stage involves the removal <strong>of</strong> bound (unfrozen) water. The thickness <strong>of</strong><br />
the dried layer is L, and the energy balance in this layer is as follows:<br />
2<br />
∂TI ∂ T c<br />
I pg ⎛ ∂Nt , I ∂TI<br />
⎞ ∆HV ρI ⎛ ∂Csw<br />
⎞<br />
= α<br />
Ie<br />
− T<br />
2 ⎜ I<br />
− Nt,<br />
I ⎟ + ⎜ ⎟<br />
∂t ∂z ρIecpIe ⎝ ∂z ∂z ⎠ ρIecpIe<br />
⎝ ∂t<br />
⎠<br />
(44)<br />
The initial and boundary conditions <strong>of</strong> Eq.(43) are:<br />
T = γ ( z) at t = t , 0 ≤ z ≤ L<br />
(45)<br />
I<br />
pd<br />
Sadikoglu – <strong>Spray</strong> freeze drying 174
∂T<br />
q = k at z = 0 , t ≥ 0 where q = σ F T −T (0, t)<br />
4 4<br />
( )<br />
I<br />
I Ie I up I<br />
∂z<br />
z=<br />
0<br />
∂TI<br />
qII<br />
= kIe<br />
at z = L , t ≥ 0<br />
∂<br />
z<br />
z=<br />
L<br />
(46)<br />
(47)<br />
For radiation heat transfer to the bottom <strong>of</strong> tray,<br />
4<br />
( 4 ( , ))<br />
q = σ F T − T L t<br />
(48)<br />
II lp I<br />
For a thin film between the frozen material and lower plate,<br />
( ( , ))<br />
q = h T − T L t<br />
(49)<br />
II Lp I<br />
The continuity equations for water vapor and inert gas are given in Eqs.<br />
(7) and (8) while the equation for the removal <strong>of</strong> bound water is given in Eq.<br />
(6). The initial and boundary conditions for the material balance equations for<br />
the secondary drying stage are given by the following expressions [39] :<br />
p = δ ( z) at t = t , 0 ≤ z ≤ L<br />
(50)<br />
w<br />
pd<br />
p = µ ( z) at t = t , 0 ≤ z ≤ L<br />
(51)<br />
in<br />
pd<br />
C = θ ( z) at t = t , 0 ≤ z ≤ L<br />
(52)<br />
sw<br />
pd<br />
p = p , p = P − p at z = 0 , t ≥ t<br />
(53)<br />
w w0 in c w0<br />
pd<br />
∂p<br />
∂<br />
∂p<br />
∂<br />
w<br />
z<br />
z=<br />
L<br />
in<br />
z<br />
z=<br />
L<br />
= 0 at z = L,<br />
t > t<br />
= 0 at z = L,<br />
t > t<br />
pd<br />
pd<br />
(54)<br />
(55)<br />
The functions γ(z), δ(z), µ(z), and θ(z) provide the pr<strong>of</strong>iles <strong>of</strong> T I , p w , p in ,<br />
and C sw at the end <strong>of</strong> the primary drying stage or at the beginning <strong>of</strong> the<br />
secondary drying stage in which; these pr<strong>of</strong>iles are obtained by the solution <strong>of</strong><br />
the model equations for the primary drying stage. Eqs. from (43) through (54),<br />
(7) and (8) represent the mathematical model that could be used to describe<br />
the dynamic behavior <strong>of</strong> the secondary drying stage <strong>of</strong> spray freeze drying in<br />
a tray. It should be noted that the control variables q I , q II , and P 0 , must have<br />
dynamic values during the secondary drying stage such that the temperature<br />
everywhere in the sample (0≤z≤L) should be kept below the scorch<br />
temperature, T scor , (T I ≤ T scor ) <strong>of</strong> the material being dried.<br />
4.0 Conclusion<br />
Sadikoglu – <strong>Spray</strong> freeze drying 175
The current studies have shown that the utilization <strong>of</strong> the spray freeze<br />
drying process in pharmaceutical, bio-chemicals, food, ceramics and fine<br />
chemicals industries will increase dramatically. The ability <strong>of</strong> producing<br />
sprayed protein powders with a very fine and friable microstructure that<br />
controlled release <strong>of</strong> therapeutic proteins. This makes spray freeze drying<br />
process <strong>of</strong> favorable for micro-encapsulation. In ceramics the industry,<br />
precursor powders that have similar density and homogeneity <strong>of</strong> original<br />
suspension can be produced by using the spray freeze drying. The spray<br />
freeze drying has a wide range <strong>of</strong> application from the ceramics industry<br />
(production <strong>of</strong> fine precursors to synthesize advanced ceramics such as<br />
superconductors, temperature resistant and highly durable materials) to the<br />
food industry (production <strong>of</strong> functional foods such as probiotics and high value<br />
foods), but it has undisputed future in pharmaceutical industry especially in<br />
producing pulmonary inhalable drugs. Large porous particles with small mass<br />
density, large geometric diameter and optimal aerodynamic diameter (1–3<br />
µm) are highly effective for pulmonary drug delivery, and they can be<br />
produced by using spray freeze drying method. Reducing the operation cost<br />
which is the function <strong>of</strong> drying time, without causing any loss in product quality<br />
will be the main challenge for future <strong>of</strong> the spray freeze drying process.<br />
5.0 References<br />
1. Sadikoglu, H.; Ozdemir, M.; Seker, M. Freeze-<strong>Drying</strong> <strong>of</strong> Pharmaceutical<br />
Products: Research and Development Needs. Journal <strong>of</strong> <strong>Drying</strong><br />
<strong>Technology</strong>, 2006, 24, 849-861.<br />
2. Sadikoglu, H.; Liapis, A. I. and Crosser, O. K. Optimal Control <strong>of</strong> the<br />
Primary and Secondary <strong>Drying</strong> Stages <strong>of</strong> Bulk Solution Freeze <strong>Drying</strong> in<br />
Trays. Journal <strong>of</strong> <strong>Drying</strong> <strong>Technology</strong> 1998, 16, 399-431.<br />
3. Sadikoglu, H.; Ozdemir, M.; Seker, M. Optimal control <strong>of</strong> the primary<br />
drying stage <strong>of</strong> freeze drying process in vials using variational calculus.<br />
Journal <strong>of</strong> <strong>Drying</strong> <strong>Technology</strong>, 2003, 21(7), 1307-1331.<br />
4. Gohel, M. C.; Parikh .R.K, Nagori, S.A. <strong>Spray</strong> <strong>Drying</strong>: A Review.<br />
Pharmaceutical Review 2009, 5(7), http://www.pharmainfo.net/volumesand-issues/2009/vol-7-issue-5<br />
5. Filkova, I.; Huang, L. X.; Mujumdar, A. S. Industrial <strong>Spray</strong> <strong>Drying</strong> Systems.<br />
in AS. Mujumdar (ed), Handbook <strong>of</strong> Industrial <strong>Drying</strong>, (Second Edition).<br />
Marcel Dekker, New York and Basel, pp. 309-343.<br />
6. Leuenberger, H. <strong>Spray</strong> freeze-drying – the process <strong>of</strong> choice for low water<br />
soluble drugs, Journal <strong>of</strong> Nanoparticle Research 2002, 4, 111–119.<br />
7. Liapis, A. I.; Bruttini, R. A mathematical model for the spray freeze drying<br />
process: the drying <strong>of</strong> frozen particles in trays and in vials on trays.<br />
International Journal <strong>of</strong> Heat and Mass Transfer 2009, 52(1-2), 100-111.<br />
Sadikoglu – <strong>Spray</strong> freeze drying 176
8. Sonner C, Maa Y-F, Lee G. <strong>Spray</strong>-freezing-drying for protein powder<br />
preparation: particle characterization and a case study with trypsinogen<br />
stability. Journal <strong>of</strong> Pharmaceutical Science 2002, 91(10), 2122-2139.<br />
9. Maa, Y.-F.; Nguyen, P.-A.; Sweeney, T.; Shire, S.J.; Hsu, C.C. Protein<br />
inhalation powders: spray drying vs spray freeze drying, Pharmaceutical<br />
Research 1999, 16, 249–254.<br />
10. Costantino, H.R.; Johnson, O.L.; Zale, S.E. Relationship between<br />
encapsulated drug particle size and initial release <strong>of</strong> recombinant human<br />
growth hormone from biodegradable microspheres. Journal <strong>of</strong><br />
Pharmaceutical Science 2004, 10, 2624-2634.<br />
11. Benson, S.W.; Ellis, D.A. Surface areas <strong>of</strong> proteins. I. Surface areas and<br />
heat <strong>of</strong> adsorption. Journal <strong>of</strong> the American Chemical Society 1948, 70,<br />
3563-3569.<br />
12. Werly, E.F.; Baumann, E.K. Production <strong>of</strong> sub-micronized powder by<br />
spray-freezing. Archives <strong>of</strong> environmental health 1964, 9, 567-571.<br />
13. Maa,Y.-F.; Nguyen, P.-A. Method <strong>of</strong> spray freeze drying proteins for<br />
pharmaceutical administration, US Patent 6,282,282 (2001).<br />
14. Wang, Z.; Finlay, H. F. Powder formation by atmospheric spray freeze<br />
drying. US Patent 2008/0155853 A1 (2008).<br />
15. Maa,Y.-F.; Prestreski, S. J.; Burkoth, T. L. <strong>Spray</strong> freeze dried<br />
compositions. US Patent 2003/0202978 A1 (2003).<br />
16. Gombotz, W. R.; Healy, M. S.; Brown , L. R.; Auer, H. E. Process for<br />
producing particles <strong>of</strong> biologically active molecules. US Patent 6,569,458<br />
B1 (2003).<br />
17. Costantino, H.R.; Firouzabadian, L.; Hogeland, K.; Wu, C.; Beganski, C.;<br />
Carrasquillo, K.G.; Cordova, M.; Griebenow, K.; Zale, S.E.; Tracy, M.A.<br />
Protein spray freeze drying. Effect <strong>of</strong> atomization conditions on particle<br />
size and stability, Pharmaceutical Research 2000, 17, 1374–1382.<br />
18. Costantino, H.R.; Firouzabadian, L.; Wu, C.; Carrasquillo, K.G.;<br />
Griebenow, K.; Zale, S.E.; Tracy, M.A. Protein spray freeze drying. 2.<br />
Effect <strong>of</strong> formulation variables on particle size and stability. Journal <strong>of</strong><br />
Pharmaceutical Science 2002, 91(2), 388-395.<br />
19. Rogers, T.L.; Nelsen, A.C.; Hua, J.; Brown, J. N.; Sarkari, M.; Young, T.J.;<br />
Johnston, K. P.; Williams III, R.O. A novel particle engineering technology<br />
to enhance dissolution <strong>of</strong> poorly water soluble drugs: spray-freezing into<br />
liquid. European Journal <strong>of</strong> Pharmaceutics and Biopharmaceutics 2002,<br />
54, 271–280.<br />
20. Rogers, T.L.; Nelsen, A.C.; Sarkari, M.; Young, T.J.; Johnston, K. P.;<br />
Williams III, R.O. Enhanced aqueous dssolution <strong>of</strong> a poorly water soluble<br />
drug by novel particle engineering technology: spray-freezing into liquid<br />
with atmospheric freeze-drying. Pharmaceutical Research 2003, 3(20),<br />
485-493.<br />
21. Carrasquillo, K.G.; Stanley, A.M.; Aponte-Carro, J.C.; De Jésus, P.;<br />
Costantino, H.R.; Bosques, C.J.; Griebenow K. Non-aqueous<br />
encapsulation <strong>of</strong> excipient-stabilized spray-freeze dried BSA into<br />
poly(lactide-co-glycolide) microspheres results in release <strong>of</strong> native protein.<br />
Journal <strong>of</strong> Control Release 2001, 76(3),199-208.<br />
Sadikoglu – <strong>Spray</strong> freeze drying 177
22. Yin, W.; Yates, M.Z. Encapsulation and sustained release from<br />
biodegradable microcapsules made by emulsification/freeze drying and<br />
spray/freeze drying. Journal <strong>of</strong> Colloid and Interface Science 2009, 336,<br />
155–161.<br />
23. Wang, J.; Chua, K.M.; Wang, C.H. Stabilization and encapsulation <strong>of</strong><br />
human immunoglobulin G into biodegradable microspheres. Journal <strong>of</strong><br />
Colloid Interface Science 2004, 71(1), 92-101.<br />
24. Lam, X.M.; Duenas, E.T.; Cleland, J,L.Encapsulation and stabilization <strong>of</strong><br />
nerve growth factor into poly (lactic-co-glycolic) acid microspheres. Journal<br />
<strong>of</strong> Pharmaceutical Science 2001, 90(9), 1356-1365.<br />
25. Semyonov, D.; Ramon, D.; Kaplun, Z.; Levin-Brener, L.; Gurevich, N.;<br />
Shimoni, E. Microencapsulation <strong>of</strong> Lactobacillus paracasei by spray freeze<br />
drying. Food Research International 2010, 43, 193–202.<br />
26. Nguyen, X.C.; Herberger, J.D.; Burke, P.A. Protein powders for<br />
encapsulation: a comparison <strong>of</strong> spray-freeze drying and spray drying <strong>of</strong><br />
darbepoetin alfa. Pharmaceutical Research 2004, 20(3), 507-514.<br />
27. Burke, P.A.; Klumb, L.A.; Herberger, J.D.; Nguyen, X.C.; Harrell, R.A.;<br />
Zordich, M. Poly(lactide-co-glycolide) microsphere formulations <strong>of</strong><br />
darbepoetin alfa: spray drying is an alternative to encapsulation by sprayfreeze<br />
drying. Pharmaceutical Research 2004, 3(20), 500-506.<br />
28. Yokota, T.; Takahata, Y.; Katsuyama, T.; Matsuda, Y. A new technique for<br />
preparing ceramics for catalyst support exhibiting high porosity and high<br />
heat resistance. Catalysis Today 2001, 69, 11–15.<br />
29. Badica, P.; Aldica, G. Bi-2223 freeze-dried ceramic: specific features,<br />
related problems and search for new solutions. Journal <strong>of</strong> Optoelectronics<br />
and Advanced Materials 2003, 4(5), 1029 – 1039.<br />
30. Lee, S. H.; Lee, J. Y.; Park, Y.M. Complete oxidation <strong>of</strong> methane and CO<br />
at low temperature over LaCoO3 prepared by spray-freezing/freeze-drying<br />
method. Catalysis Today 2006, 117, 376–381.<br />
31. Itatani, K.; Iwafune, K.; Howell, F. S.; Aizawa, M. Preparation <strong>of</strong> various<br />
calcium-phosphate powders by ultrasonic spray freeze-drying technique.<br />
Materials Research Bulletin 2000, 35, 575–585.<br />
32. Badica, P.; Aldica, G.; Morozov, V.V.; Popa, S.; Mandache, S. The<br />
influence <strong>of</strong> sintering environment and Intermediate grounding on the<br />
scattering <strong>of</strong> the superconducting characteristics in BSCCO Ceramic<br />
produced by spray-frozen, freeze drying method. Applied<br />
Superconductivity 1996, 12(4), 583-589.<br />
33. Chow, A. H. L.; Tong, H. H. Y.; Chattopadhyay, P.; Shekunov, B. Y.<br />
Particle Engineering for Pulmonary Drug Delivery. Pharmaceutical<br />
Research 2007, 3(24), 411-437.<br />
34. Edwards, D.A.; Dunbar C. Bioengineering <strong>of</strong> therapeutic aerosols. Annual<br />
Review <strong>of</strong> Biomedical Engineering 2002, 4, 93-107.<br />
35. Koushik, K.; Kompella, U. B. Particle and device engineering for inhalation<br />
drug delivery. Drug Delivery <strong>Technology</strong> 2004, 2(4), 40-50.<br />
Sadikoglu – <strong>Spray</strong> freeze drying 178
36. Edwards, D. A.; Ben-Jebria, A.; Langer, R. Recent advances in pulmonary<br />
drug delivery using large, porous inhaled particles. Journal <strong>of</strong> Applied<br />
Physiology 1998, 85, 379-385.<br />
37. Sheehan, P.; Liapis, A. I. Modeling <strong>of</strong> the primary and secondary drying<br />
stages <strong>of</strong> the freeze drying <strong>of</strong> pharmaceutical products in vials: numerical<br />
results obtained from the solution <strong>of</strong> a dynamic and spatially multidimensional<br />
lyophilization model for different operational policies.<br />
Biotechnology and Bioengineering 1998, 60, 712–728.<br />
38. Whitaker, S. Simultaneous Heat, Mass, and Momentum Transfer in<br />
Porous Media: A Theory <strong>of</strong> <strong>Drying</strong>, Advances in Heat Transfer, vol. 13,<br />
Academic Press, New York, NY, USA, 1977, 119–203.<br />
39. Sadikoglu, H.; Liapis, A. I. Mathematical Modelling <strong>of</strong> the Primary and<br />
Secondary <strong>Drying</strong> Stages <strong>of</strong> Bulk Solution Freeze-<strong>Drying</strong> in Trays:<br />
Parameter Estimation and Model Discrimination by Comparison <strong>of</strong><br />
Theoretical Results with Experimental Data. <strong>Drying</strong> <strong>Technology</strong> 1997, 15,<br />
791-810.<br />
40. Marti, J.; Mauersberger, K. A survey and new measurements <strong>of</strong> ice vapor<br />
pressure at temperatures between 170 and 250 K, Geophysical Research<br />
Letters 1993, 20, 363–366.<br />
5.0 Nomenclatures<br />
c p<br />
C sw<br />
C 01<br />
heat capacity (kJ/kg)<br />
concentration <strong>of</strong> bound (sorbed) water (kg water/kg solid)<br />
constant dependent only upon the structure <strong>of</strong> the porous medium and<br />
giving relative<br />
Darcy flow permeability (m 2 )<br />
C 1 constant dependent only upon the structure <strong>of</strong> the porous medium and<br />
giving relative Knudsen flow permeability (m)<br />
C 2 constant dependent only upon the structure <strong>of</strong> the porous medium and<br />
giving the ratio <strong>of</strong> bulk diffusivity within the porous medium to the free<br />
gas bulk diffusivity (dimensionless)<br />
d ice diameter <strong>of</strong> ice core in particle (m)<br />
d p diameter <strong>of</strong> particle (m)<br />
d pore mean pore diameter <strong>of</strong> porous layer formed from the packing <strong>of</strong> the<br />
particles (m)<br />
D w,in free gas mutual diffusivity in a binary mixture <strong>of</strong> water vapor and inert<br />
gas (m 2 /s)<br />
D D w,in P (N/s)<br />
0<br />
w,in<br />
Z(t) geometric shape (as per Fig. 1b) <strong>of</strong> the moving interface, a function <strong>of</strong><br />
time (m)<br />
k thermal conductivity (W/K m)<br />
k = C D 0 K / C D 0 + K P (m2/s)<br />
k 1 bulk diffusivity constant,<br />
1 2 w, in w ( 2 w,<br />
in mx )<br />
k 2 , k 4 self-diffusivity constant, ( 0<br />
)<br />
(m 4 /N s)<br />
( w in<br />
/<br />
w in mx ) ( /<br />
mx )<br />
k = k = K K C D + K P + C µ<br />
2 4 2 , 01<br />
k3 bulk diffusivity constant, k 0 ( 0<br />
3<br />
C2 Dw, inKin / C2 Dw,<br />
in<br />
KmxP)<br />
= + (m 2 /s)<br />
Sadikoglu – <strong>Spray</strong> freeze drying 179
k des rate constant in the desorption mechanism <strong>of</strong> bound water, Eq. (6) (s -1 )<br />
K w Knudsen diffusivity for water vapor, K = C1 R T / M (m 2 /s)<br />
w g w<br />
Kin Knudsen diffusivity <strong>of</strong> inert gas, K = C1 R T / M (m 2 /s)<br />
in g in<br />
K mx mean Knudsen diffusivity for binary gas mixture, K mx = y w K in + y in K w<br />
(m 2 /s)<br />
L length (height) <strong>of</strong> material in tray (m)<br />
m w amount <strong>of</strong> free water in material (kg/m 2 )<br />
M molecular weight (kg/kmol)<br />
N mass flux (kg/m 2 s)<br />
p partial pressure (Pa)<br />
p saturated water vapor pressure (Pa)<br />
sat<br />
w<br />
P total pressure (Pa)<br />
P dcham pressure in drying chamber (Pa)<br />
q heat flux (W/m 2 )<br />
R radius <strong>of</strong> vial (m)<br />
R g ideal gas constant (J/K mol)<br />
S ice saturation, Eq. (7) (dimensionless)<br />
S av volume-averaged ice saturation, Eq. (16) (dimensionless)<br />
t time (s)<br />
T temperature (K)<br />
T Z temperature at surface <strong>of</strong> moving interface (K)<br />
V velocity <strong>of</strong> moving interface (m/s)<br />
z space coordinate <strong>of</strong> distance along the length (height) <strong>of</strong> the material in<br />
the tray (m)<br />
Z position <strong>of</strong> moving interface in the material in the tray (m) y mole<br />
fraction (dimensionless)<br />
Greek letters<br />
∆H s heat <strong>of</strong> sublimation <strong>of</strong> ice (J/kg)<br />
∆H v heat <strong>of</strong> vaporization <strong>of</strong> bound water (J/kg)<br />
ε p particle porosity (dimensionless)<br />
ε pb porosity <strong>of</strong> the bed formed by the packed particles (dimensionless)<br />
µ mx viscosity <strong>of</strong> vapor phase in the pores (kg/m s)<br />
ρ density (kg/m 3 )<br />
τ tortuosity (dimensionless)<br />
Superscripts<br />
o<br />
Subscripts<br />
d<br />
d,s<br />
d,s,f<br />
e<br />
f<br />
f,s<br />
g<br />
I<br />
initial value<br />
dried particle based material after primary drying<br />
dried solution based material after primary drying<br />
dried solution based material when frozen and sorbed water have been<br />
removed<br />
effective<br />
frozen particle based material<br />
frozen solution based material<br />
gas<br />
region I, porous dried layer<br />
Sadikoglu – <strong>Spray</strong> freeze drying 180
II region II, unsaturated porous frozen layer<br />
in inert gas<br />
interf moving interface<br />
lp lower heating plate<br />
m melting<br />
mx binary mixture <strong>of</strong> water vapor and inert gas<br />
pd primary drying stage<br />
scor scorch<br />
t total<br />
up upper heating plate<br />
w water vapor<br />
Sadikoglu – <strong>Spray</strong> freeze drying 181
Sadikoglu – <strong>Spray</strong> freeze drying 182
Chen, X.D., Lin, S.X.Q., Patel, K.C., Woo, M.W. A simplified design procedure for spray<br />
dryers for milk powder manufacture - Volume 1, Ed. Woo, M.W., Mujumdar, A.S. and<br />
Daud, W.R.W., 2010, ISBN - 978-981-08-6270-1, Published in <strong>Singapore</strong>, pp. 183-196.<br />
A simplified design procedure for spray dryers for<br />
milk powder manufacture<br />
Chapter 7<br />
Chen X.D. 1,2 , Lin S.X.Q. 1 , Patel K.C. 1 , Woo M.W. 1<br />
1 Department <strong>of</strong> Chemical Engineering, Monash <strong>University</strong><br />
2 Department <strong>of</strong> Chemical and Biochemical Engineering, College <strong>of</strong> Chemistry and Chemical<br />
Engineering, Xiamen <strong>University</strong>, Xiamen City, P.R. China<br />
Contents<br />
Page<br />
1.0 Introduction 183<br />
2.0 Overall component selection 184<br />
3.0 Heat balance <strong>of</strong> a spray dryer 185<br />
4.0 Estimation <strong>of</strong> particle residence time 188<br />
4.1 Heat balance 189<br />
4.2 Mass balance 190<br />
4.3 Momentum balance 190<br />
4.4 Implementation <strong>of</strong> one-dimensional model 190<br />
4.5 Reaction Engineering Approach 191<br />
5.0 Estimation <strong>of</strong> the dryer diameter 194<br />
6.0 References 195<br />
1.0 Introduction<br />
<strong>Spray</strong> drying is by definition the transformation <strong>of</strong> feed from a fluid state<br />
into a dried particulate form by spraying the feed into a hot drying medium [1] .<br />
Application <strong>of</strong> this process can be widely found in the manufacture <strong>of</strong><br />
powdered food: for example, milk powder, instant c<strong>of</strong>fee, dried eggs, soups,<br />
baby foods and sweeteners. This chapter provides a simplified practical tool<br />
or approach in designing a spry dryer for milk manufacture. Steps involved in<br />
the proposed design approach, in chronological order, are: (1) overall<br />
component selection, (2) performing an overall heat and mass balance for the<br />
dryer, (3) scaling <strong>of</strong> the dryer length based on the required particle residence<br />
time and (4) determining the required dryer diameter. Discussion on step 1<br />
and 2 can be found in a few established literatures on spray drying [1][2] .<br />
Therefore, they will only be briefly included here for completeness.<br />
Chen, Lin, Patel, Woo – Design <strong>of</strong> spray dryers 183
However, there is no report on an effective yet simple estimation <strong>of</strong> the<br />
spray drying residence time and on the estimation <strong>of</strong> the drying chamber<br />
diameter. A simplified method to estimate the spray drying time will be<br />
discussed here. In the final section, the nozzle coverage diameter will be used<br />
to evaluate the drying chamber diameter.<br />
2.0 Overall component selection<br />
The main components <strong>of</strong> a single stage spray drying system are shown in<br />
Figure 1:<br />
• <strong>Drying</strong> chamber<br />
• Air distributor with the hot air supply system which includes the main air<br />
filter, supply fan, air heater and air distributor<br />
• Atomization device with feed supply system which includes feed tank,<br />
feed pump, water tank, feed heater and atomization device<br />
• Powder recovery system which includes outlet duct, main cyclone,<br />
exhaust fan and fine recovery cyclone (or filter bag)<br />
• Instruction<br />
Figure 1<br />
Main components <strong>of</strong> a single stage spray drying system<br />
The shape <strong>of</strong> the drying chamber, location <strong>of</strong> the drying air disperser,<br />
atomization device, position <strong>of</strong> the exhaust air and powder discharge position<br />
determine the air flow pattern and product flow. This subsequently affects the<br />
resultant powder characteristics. For vertical cylinder chamber, there are three<br />
distinct types <strong>of</strong> chamber shape, i.e., wide body, tall form and horizontal type.<br />
Products leaving the drying chamber can follow the exhaust air or be partially<br />
separated from the exhaust air in the drying chamber. The drying air can flow<br />
directly downwards, rotary downwards (spiral) or horizontally. In addition to<br />
Chen, Lin, Patel, Woo – Design <strong>of</strong> spray dryers 184
these configurations, the direction <strong>of</strong> the drying air can be concurrent or<br />
count-current in relation to the atomized liquid spray.<br />
There are three conventional configurations with regards to atomization<br />
options, i.e., open mode design with single point powder discharge, open<br />
mode design with two point powder discharge and close cycle design with<br />
single point powder discharge. Three types <strong>of</strong> atomizers can be used, i.e.,<br />
rotary atomizer, pressure nozzle atomizer and two-fluid nozzle atomizer. The<br />
selection <strong>of</strong> the atomization device depends mainly on the desired<br />
characteristics <strong>of</strong> the powder as well as the properties <strong>of</strong> the bulk liquid feed<br />
to be atomized. The designer should consult with nozzle manufacture and<br />
literature [2] . This selection <strong>of</strong> an atomization system will be important in<br />
providing the preliminary design information, initial droplet size distribution<br />
and feed rate, for subsequent estimation <strong>of</strong> the particle residence time.<br />
There are five options for post-operation on the powder, i.e., no<br />
treatment, pneumatic transport, external fluid bed, integrated fluid bed and<br />
integrated belt [2] . Various options are available for powder separation.<br />
However, from the consideration <strong>of</strong> hygienic and safety, only cyclone<br />
separator, bag filter and wet scrubber are used in milk powder production.<br />
The capability <strong>of</strong> the spray dryer is determined by the type <strong>of</strong> the<br />
chamber and by the components integrated. For example, the selection <strong>of</strong><br />
different type <strong>of</strong> the nozzle and different post-operations <strong>of</strong> the powder will<br />
result in different powder size and size distribution and functionality. Detailed<br />
discussion on the capabilities <strong>of</strong> different spray drying installations in terms <strong>of</strong><br />
the combinations <strong>of</strong> the type <strong>of</strong> chamber, after treatment and atomization<br />
device, can be found elsewhere [2] .<br />
3.0 Heat balance <strong>of</strong> a spray dryer<br />
For continuous operation <strong>of</strong> a spray dryer, the mass flow rate <strong>of</strong> the input<br />
air and feed equals the mass rate <strong>of</strong> the output <strong>of</strong> air and product. Heat input<br />
<strong>of</strong> air and feed equals the sum <strong>of</strong> heat output <strong>of</strong> air and product and heat<br />
losses from the dryer. The physical input components are:<br />
• <strong>Drying</strong> air;<br />
• Auxiliary air, for example, cooling air (for cooling the atomizer to avoid<br />
overheating) and fine powder transport air etc.;<br />
• Liquid feed to be dried.<br />
The physical output components are exhaust air and powder. For a given<br />
amount <strong>of</strong> feed to be dried to a certain level <strong>of</strong> moisture content, the amount<br />
<strong>of</strong> air required can be calculated by collating the individual heat requirements<br />
for evaporating the moisture from the droplet, heating or cooling each<br />
individual component from its inlet to its outlet temperature and heat losses.<br />
The inlet and outlet parameters are as follows:<br />
• <strong>Drying</strong> air inlet temperature t inlet ( o C) and humidity H ambient (kg/kg);<br />
• Ambient air temperature t ambient ( o C) and humidity H ambient (kg/kg);<br />
• <strong>Drying</strong> air feed rate (which has to be calculated) G inlet (kg/s);<br />
• Atomization device cooling air temperature t cooling ( o C), humidity H ambient<br />
(kg/kg) and mass flow rate G cooling (kg/s);<br />
Chen, Lin, Patel, Woo – Design <strong>of</strong> spray dryers 185
• Fine powder transport air temperature t transport ( o C), humidity H ambient<br />
(kg/kg) and mass flow rate G transport (kg/s);<br />
• Feed concentrate temperature t feed ( o C), mass flow rate G feed (kg/s)<br />
and solids content TS (wt%);<br />
• The ratio <strong>of</strong> the recycled fines to the total powder production R fine . Fine<br />
powder returns to the dryer at t transport , i.e., the same temperature as<br />
the fines transport air temperature);<br />
• Powder moisture content m powder (wt%);<br />
• Dryer wall surface area A dryer (m 2 );<br />
• Exhaust air temperature t outlet ( o C) and humidity H outlet (kg/kg);<br />
• Heat loss coefficient K (W/m 2 K)<br />
The inlet and outlet conditions need to be initially fixed. Normally this is<br />
determined by manufacturing experience on the product <strong>of</strong> interest,<br />
knowledge on inlet drying air temperature and the required outlet air<br />
temperature for the desired powder moisture content. With the other operation<br />
parameters outlined above, the heat balance can be estimated as follows:<br />
Heat <strong>of</strong> evaporation <strong>of</strong> water:<br />
Q<br />
⎛ TS ⎞<br />
⎜1 ⎟[ ∆H<br />
+ C × ( toutlet<br />
− t<br />
feed<br />
)]<br />
(1)<br />
⎝<br />
⎠<br />
evap<br />
= G<br />
feed<br />
× −<br />
⎜<br />
water v outlet<br />
− m ⎟<br />
,<br />
1<br />
powder<br />
where ∆H water (kJ/kg) is the latent heat for water evaporation and C v,outlet is the<br />
specific heat capacity <strong>of</strong> water vapour at the dryer’s outlet temperature.<br />
Heat <strong>of</strong> powder/product:<br />
powder<br />
[ C ( − m ) C m ]<br />
TS<br />
Q<br />
powder<br />
= G<br />
feed<br />
× ×<br />
powder<br />
1<br />
powder<br />
+<br />
1−<br />
m<br />
water<br />
powder<br />
(2)<br />
where C powder (kJ/kgK) and C water (kJ/kgK) are specific heat capacity <strong>of</strong> dry<br />
powder and water.<br />
Heat <strong>of</strong> cooling air:<br />
⎛ toutletC<br />
−<br />
= ⎜<br />
a , outlet<br />
tambientCa,<br />
ambient<br />
Gcooling<br />
+ H<br />
ambient outlet v,<br />
outlet ambient v ambient<br />
⎝ 1+<br />
H<br />
ambient<br />
( t C − t C ) ⎟ Q<br />
cooling<br />
,<br />
⎞<br />
⎠<br />
(3)<br />
where C a,outlet (kJ/kgK) and C a,ambient (kJ/kgK) are specific heat capacity <strong>of</strong> air at<br />
dryer’s outlet temperature and ambient temperature respectively, C v,ambientt is<br />
specific heat capacity <strong>of</strong> water vapour at ambient temperature.<br />
Heat <strong>of</strong> fines transport air:<br />
Q<br />
fine−transport<br />
⎛ t<br />
×<br />
⎜<br />
⎝<br />
outlet<br />
C<br />
= G<br />
a,<br />
outlet<br />
− t<br />
1+<br />
H<br />
transport<br />
transport<br />
ambient<br />
C<br />
a,<br />
transport<br />
+ H<br />
ambient<br />
×<br />
( t C − t C ) ⎟ outlet<br />
v,<br />
outlet<br />
transport<br />
v,<br />
transport<br />
⎞ (4)<br />
⎠<br />
Chen, Lin, Patel, Woo – Design <strong>of</strong> spray dryers 186
where C a,transport and C a,transort are specific heat capacity <strong>of</strong> the transport air and<br />
water vapour at the dryer’s outlet temperature respectively.<br />
Heat <strong>of</strong> fine powder:<br />
powder<br />
( t − t )[ C × ( − m ) C m ]<br />
TS<br />
Q<br />
fine<br />
= G<br />
feed<br />
× × R<br />
fine outlet transport powder<br />
1<br />
powder<br />
+<br />
1−<br />
m<br />
Heat loss to the ambient:<br />
water<br />
powder<br />
(5)<br />
Q<br />
loss<br />
dryer<br />
( t − t )<br />
≈ KA<br />
(6)<br />
outlet<br />
ambient<br />
Total energy required:<br />
Q = Q + Q + Q + Q<br />
−<br />
+ Q + Q<br />
(7)<br />
total<br />
evap<br />
powder<br />
cooling<br />
fine transport<br />
fine<br />
loss<br />
<strong>Drying</strong> air thus required:<br />
G<br />
inlet<br />
= Q<br />
t C<br />
(8)<br />
inlet<br />
total<br />
a, ambient<br />
− toutletCa,<br />
outlet<br />
+ H<br />
ambient inlet v,<br />
inlet<br />
−<br />
( t C t C )<br />
outlet<br />
v,<br />
outlet<br />
The following is an example heat balance <strong>of</strong> a pilot scale dryer. The<br />
specifications <strong>of</strong> the pilot scale dryer are as follow:<br />
• <strong>Drying</strong> chamber dimension: Ø 2500x2000 mm, 60° cone<br />
• Nominal main process gas flow: 1250 kg/hr<br />
• Water evaporation capacity: 20-110 kg/h<br />
• Typical mean particle size range: 30-300 micron (for the drying <strong>of</strong> large<br />
particle a very high temperature must be used. This is not suitable to<br />
food products)<br />
• atomizing devices: rotary atomizer, two-fluid nozzle and pressure<br />
nozzle<br />
Based on these overall specifications above, some <strong>of</strong> the possible operating<br />
parameters calculated with equation (1) to (8) are shown in Table 1.<br />
Table 1 Case studies <strong>of</strong> operating parameters obtained by overall mass and<br />
energy balance<br />
Case 1 Case 2 Case 3<br />
Inlet temperature (°C) 250 200 200<br />
Outlet temperature (°C) 110 90 100<br />
Water evaporation rate (kg/hr) 60 50 44<br />
Latent heat <strong>of</strong> evaporation (kJ/kg) 2260 2260 2260<br />
Specific heat capacity <strong>of</strong> air (kJ/kg K)<br />
1.022 (at<br />
180°C)<br />
1.013 (at<br />
140°C)<br />
1.013 (at<br />
140°C)<br />
Chen, Lin, Patel, Woo – Design <strong>of</strong> spray dryers 187
Nominal main process air flowrate<br />
(kg/hr)<br />
Specific heat capacity <strong>of</strong> air (kJ/kg K)<br />
1250 1250 1250<br />
1.013 (at<br />
130°C)<br />
1.009 (at<br />
100°C)<br />
1.009 (at<br />
100°C)<br />
Ambient air temperature (°C) 15 15 15<br />
Water evaporation rate without heat<br />
loss (kg/hr)<br />
79.1 61.6 56.0<br />
Net power input (kW) 82.7 64.8 64.8<br />
Heat loss (kW) 12.0 7.3 7.6<br />
Temperature difference between<br />
average chamber temperature and<br />
ambient temperature ( o C)<br />
Maximum required combustor power<br />
output/drying air power consumption<br />
@350°C (kW)<br />
150 115 120<br />
117.8<br />
4.0 Estimation <strong>of</strong> particle residence time<br />
For successful drying operation, under the actual drying air temperature<br />
and humidity, it is essential to have sufficient residence time to dry particles to<br />
the required moisture content. Heat balance only provides information on the<br />
required drying air flow rate through the dryer. However, whether or not the<br />
droplets can be sufficiently dried in the chamber is determined by the droplet<br />
residence time alongside with the drying air temperature and humidity.<br />
Simulation is a technique or tool that can provide predictions and trends<br />
<strong>of</strong> process and product parameters with acceptable accuracies. Simulation<br />
techniques are increasingly becoming popular within the s<strong>of</strong>tware<br />
development community to optimize the spray drying process and predict<br />
product properties before conducting real and usually expensive spray drying<br />
trials [3] .<br />
However, the spray drying process is complex, involving atomization <strong>of</strong><br />
the feed, spray air contact/mixing, and spray evaporation/drying [1] . Due to<br />
this complexity, it is difficult to mathematically capture the entire physical<br />
phenomena in a single simulation. One solution is to use CFD simulation in<br />
conjunction with single droplet drying kinetics. However, undertaking <strong>of</strong> CFD<br />
simulation requires special training and resources which might not be easily<br />
accessible. Furthermore, there is limited verification <strong>of</strong> CFD prediction in the<br />
industrial scale. One alternative is a simple one-dimensional simulation <strong>of</strong> the<br />
spray dryer.<br />
The main assumption <strong>of</strong> this approach is a plug-flow behaviour <strong>of</strong> the<br />
particles [3] . In this approach, mass, heat and momentum are applied to<br />
individual droplet moving through the length <strong>of</strong> the dryer which is dicretized<br />
axially into many small adjacent cells. Within these discretized cells, the<br />
Chen, Lin, Patel, Woo – Design <strong>of</strong> spray dryers 188
drying air is assumed well mixed. The drying air and droplets are assumed to<br />
be moving in parallel.<br />
The heat balance <strong>of</strong> the drying air for individual cell is:<br />
Heat in - Heat out = Heat used for heating droplet and evaporation + Heat<br />
loss<br />
G<br />
4.1 Heat balance<br />
in<br />
C<br />
= hA<br />
p,<br />
in<br />
droplet<br />
( T − T ) ∆t<br />
− G C ( T − T )<br />
in<br />
( T<br />
bulk<br />
ref<br />
− T<br />
air<br />
droplet<br />
) N<br />
out<br />
droplet<br />
p,<br />
out<br />
∆t<br />
out<br />
droplet<br />
ref<br />
+ KA<br />
∆t<br />
cell<br />
air<br />
( T<br />
bulk<br />
− T<br />
ambient<br />
) ∆t<br />
air<br />
(9)<br />
where G in and G out (kg/s) are mass flow rates at the cell inlet and outlet, C p,in<br />
and C p,out (kJ/kgK) are specific heat <strong>of</strong> the drying air at cell inlet and outlet<br />
humidity, T in and T out ( o C) are drying air temperature at cell inlet and outlet, T ref<br />
( o C) is the reference temperature for heat balance calculation (it can typically<br />
be taken as 0 o C), A droplet (m 2 ) is droplet surface area, T bulk and T droplet ( o C) are<br />
bulk air temperature and droplet temperature respectively, N droplet is the<br />
number <strong>of</strong> droplet passing the cell, A cell (m 2 ) is cell surface area exposure to<br />
ambient, ∆t air (s) is the residence time <strong>of</strong> drying air in the cell and ∆t droplet (s) is<br />
the residence time <strong>of</strong> the droplet in the cell.<br />
The residence time <strong>of</strong> the drying air in the cell can be calculated as follows:<br />
∆t<br />
air<br />
=<br />
A<br />
cell,<br />
cross<br />
V<br />
air<br />
∆L<br />
(10)<br />
where ∆L (m) is the length <strong>of</strong> the cell (along the axis <strong>of</strong> a spray dryer), V air<br />
(m 3 /s) is the volumetric flow rate <strong>of</strong> the drying air and A cell,cross (m 2 ) is the cross<br />
section area <strong>of</strong> the cell. The residence time <strong>of</strong> the droplet in the cell can be<br />
calculated as follows:<br />
∆L<br />
∆ tdroplet<br />
=<br />
(11)<br />
v<br />
droplet<br />
where v droplet (m/s) is the velocity <strong>of</strong> the droplet travelling the distance <strong>of</strong> cell’s<br />
length. The number <strong>of</strong> the droplet passing through the cell can be calculated<br />
as follows:<br />
N<br />
= N∆<br />
(12)<br />
droplet<br />
t air<br />
where N (1/s) is the total droplet number generated per second.<br />
Chen, Lin, Patel, Woo – Design <strong>of</strong> spray dryers 189
4.2 Mass balance<br />
Similar to the heat balance, the following equation can be used to calculate<br />
the outlet humidity <strong>of</strong> the cell.<br />
Moisture in + Moisture removed from droplets = Moisture out<br />
Gin∆t<br />
1+<br />
H<br />
air<br />
in<br />
× H<br />
in<br />
G<br />
∆t<br />
out air<br />
&<br />
droplet∆tdroplet<br />
= × Hout<br />
(13)<br />
1+<br />
Hout<br />
+ mN<br />
where G in (kg/s) and G out (kg/s) are the mass flow rates at cell inlet and outlet,<br />
H in (kg/kg) and H out (kg/kg) are the humidity at cell inlet and outlet, m& is<br />
drying rate <strong>of</strong> the droplet which can be estimated from Equation (17). The<br />
mass flow rate <strong>of</strong> the outlet <strong>of</strong> the cell can be calculated as follows:<br />
G<br />
outlet<br />
= G + mN & ∆t<br />
(14)<br />
inlet<br />
droplet<br />
droplet<br />
4.3 Momentum balance<br />
The axial velocity <strong>of</strong> the droplet v droplet (m/s) can be estimated with the<br />
following equation [3] :<br />
dv<br />
droplet<br />
dt<br />
=<br />
( ρ − ρ ) g 0. 75C<br />
ρ ( v − v )<br />
droplet<br />
ρ<br />
droplet<br />
air<br />
−<br />
D<br />
d<br />
air<br />
droplet<br />
v<br />
droplet<br />
droplet<br />
air<br />
(15)<br />
where ρ droplet (kg/m 3 ), ρ air (kg/m 3 ) is density <strong>of</strong> the droplet and air respectively,<br />
C D (-) is the drag coefficient, d droplet (m) is the diameter <strong>of</strong> the droplet and t (s)<br />
is the time.<br />
4.4 Implementation <strong>of</strong> the one-dimensional model<br />
The discretized heat, mass and momentum equations above can be<br />
easily implemented in a spreadsheet. In implementing the one-dimensional<br />
model, it is important that the dryer length is sufficiently discretized to ensure<br />
accuracy and stability <strong>of</strong> the computation. Depending on the predicted<br />
product moisture, the length <strong>of</strong> the dryer can then be varied under different<br />
operating conditions to give different design combinations. In the heat and<br />
mass balance equation, it can be seen that the evaporation mass transfer<br />
source terms links the particle and the air phase. This source term can be<br />
calculated using the Reaction Engineering Approach [9] drying model which<br />
will be outlined below. Case studies <strong>of</strong> the residence time predicted for<br />
different particle sizes are listed in Table 2.<br />
Chen, Lin, Patel, Woo – Design <strong>of</strong> spray dryers 190
Table 2 Residence time <strong>of</strong> the milk droplet drying from 50 wt% to 9 wt%<br />
Initial partial size (mm) 50 100 200 300<br />
Residence time (sec) 0.4 6 12.2 26<br />
Note: mass ratio <strong>of</strong> drying air to feed: 9.17; drying air inlet<br />
temperature: 204 o C; drying air outlet temperature: 60 o C.<br />
4.5 Reaction engineering approach<br />
Accurate description <strong>of</strong> the drying kinetic is a key element in such spray<br />
drying simulation. There are four types <strong>of</strong> drying kinetic approaches which are<br />
commonly used in drying modelling.<br />
• Reaction engineering approach (REA);<br />
• Characteristic drying curves (CDC) approach;<br />
• Internal moisture diffusion-based approaches;<br />
• Receding interface (or moving boundary) approaches.<br />
The REA model has been reported to be robust among various studies<br />
and will be the choice <strong>of</strong> our approach for the design [4][5] .<br />
The reaction engineering approach assumes that evaporation is an<br />
‘activation’ process having to overcome an ‘energy barrier’ whilst<br />
condensation or adsorption is not [4] . It uses a simple equation to describe the<br />
relationship between the droplet surface vapour concentration and the water<br />
content and temperature <strong>of</strong> the droplet:<br />
⎛ ∆E<br />
⎞<br />
v<br />
ρ =<br />
⎜−<br />
⎟<br />
v<br />
ρv,<br />
sat<br />
exp<br />
(16)<br />
⎝ RTd<br />
⎠<br />
where ∆ Ev<br />
(J/kmol) is essentially a ‘correction factor’ <strong>of</strong> the apparent<br />
activation energy for drying due to the increasing difficulty in removing the<br />
moisture at low moisture content levels, ρ (kg/m 3 ) and ρ (kg/m 3 ) are the<br />
vapour concentration at the particle-gas interface and saturation vapour<br />
concentration respectively, and R (J/mol.K) is the universal gas constant. The<br />
interface temperature can be approximated to be equal to the droplet<br />
temperature T d ( o C) as the Biot number [10] is normally very small for such<br />
application. Thus the mass balance can be expressed as follows:<br />
dm dX<br />
⎛ ∆Ev<br />
⎞<br />
m& = = ms<br />
= −hm<br />
A[ ρ<br />
v, sat<br />
exp − ρv,<br />
b<br />
]<br />
dt dt<br />
⎜−<br />
RT<br />
⎟<br />
(17)<br />
⎝ d ⎠<br />
where m (kg) and m s (kg) are the droplet weight and droplet mass<br />
respectively, t (s) is the drying time, h m (m.s -1 ) is the external mass transfer<br />
coefficient and ρ v, b (kg/m 3 ) is the bulk vapour concentration. The heat<br />
transfer coefficient h (W/m -2 .K).and the mass transfer coefficient h m can be<br />
v<br />
v, sat<br />
Chen, Lin, Patel, Woo – Design <strong>of</strong> spray dryers 191
obtained from established correlations such as the Ranz-Marshall correlation<br />
[6] , which takes the following form:<br />
Nu=2+0.60Re 1/2 Pr 1/3 (18)<br />
Sh=2+0.60Re 1/2 Sc 1/3 (19)<br />
The energy balance used for the model is given by the following form:<br />
dTd<br />
dX<br />
mC<br />
p, d<br />
= hA(<br />
Tb<br />
− Td<br />
) + ∆H<br />
waterms<br />
(20)<br />
dt<br />
dt<br />
where C p,d (kJ/kgK) is the specific heat capacity <strong>of</strong> the droplet, T b ( o C) is the<br />
drying air temperature, m s (kg) and X (kg/kg) are dry mass per droplet and<br />
average water content, respectively. The activation energy was calculated<br />
from the droplet weight loss versus time curves, which were obtained<br />
experimentally for the product <strong>of</strong> concern. The resulting correlations <strong>of</strong> the<br />
normalized activation energy versus moisture content difference for skim and<br />
whole milk were reported by Chen and Lin [4] , taking the following form (initial<br />
solids content 20 wt% and 30 wt%):<br />
∆Ev<br />
0.930<br />
Skim milk = .998exp[ −1.405(<br />
X − X ) ]<br />
∆E<br />
v,<br />
b<br />
0<br />
b<br />
∆Ev<br />
0.934<br />
Whole milk = .957exp[ −1.291(<br />
X − X ) ]<br />
∆E<br />
v,<br />
b<br />
0<br />
b<br />
(21)<br />
(22)<br />
where ∆E v,b (J/kmol) is the ‘equilibrium’ activation energy (the maximum<br />
value) and X b (kg/kg) is the equilibrium moisture content on dry basis<br />
corresponding to the air humidity and temperature). It is noteworthy that As<br />
examples, equation 21 and 22 are initial solid concentration specific. For 40<br />
wt% and higher solid concentrations these pr<strong>of</strong>iles were approximated using a<br />
method shown by Patel et al. [5] . Equation 21 and 22 are relative activation<br />
energy correlations for the air drying <strong>of</strong> skim milk [3] .<br />
40 wt% milk solids:<br />
∆E<br />
∆E<br />
v<br />
v,<br />
b<br />
= 0.9975 −1.28962<br />
× ( X − X<br />
− 4.6627 × ( X − X<br />
b<br />
)<br />
4<br />
+ 3.2613×<br />
( X − X<br />
b<br />
) − 0.0096×<br />
( X − X<br />
b<br />
)<br />
5<br />
− 0.8469 × ( X − X<br />
b<br />
)<br />
2<br />
+ 2.8014 × ( X<br />
b<br />
)<br />
6<br />
− X<br />
b<br />
)<br />
3<br />
(23)<br />
50 wt% milk solids:<br />
∆E<br />
∆E<br />
v<br />
v,<br />
b<br />
= 1.0063 −1.5828×<br />
( X − X<br />
+ 12.22 × ( X − X<br />
b<br />
)<br />
4<br />
− 5.5924 × ( X − X<br />
b<br />
) + 3.3561×<br />
( X<br />
b<br />
)<br />
5<br />
− X<br />
b<br />
)<br />
2<br />
− 9.389 × ( X<br />
− X<br />
b<br />
)<br />
3<br />
(24)<br />
The parameter ∆E v,b can be calculated using the relative humidity and<br />
temperature <strong>of</strong> drying air.<br />
Chen, Lin, Patel, Woo – Design <strong>of</strong> spray dryers 192
⎛ ρ<br />
⎜<br />
v<br />
∆E v , b = −RTb<br />
ln ⎝ ρ v,<br />
, b<br />
sat<br />
⎞<br />
⎟<br />
⎠<br />
(25)<br />
The equilibrium vapour concentration ρ v, b is related to the corresponding<br />
equilibrium water content <strong>of</strong> milk at different temperatures through the<br />
desorption isotherm. The GAB model, which was fitted at elevated<br />
temperatures <strong>of</strong> up to 90 °C and a wide range relative humidities up to 100%,<br />
can be used to estimate X b <strong>of</strong> skim and whole milk [7] :<br />
X<br />
b<br />
= Ckm0aw<br />
(1 − ka )(1 − ka + Cka )<br />
(26)<br />
w<br />
w<br />
w<br />
where X b (kg/kg) is the equilibrium moisture content, m 0 (kg/kg) is the<br />
monolayer moisture content, a w is the water activity (which is the same as the<br />
relative humidity in this case, a w =RH), C and k and are temperature<br />
dependent constants.<br />
⎛ ∆H<br />
⎞<br />
= C0 exp ⎜ ⎟<br />
(27)<br />
⎝ RT ⎠<br />
C<br />
1<br />
⎛ ∆H<br />
⎞<br />
= k0 exp ⎜ ⎟<br />
(28)<br />
⎝ RT ⎠<br />
k<br />
2<br />
where T (K) is the temperature, ∆H 1 (J/mol) and ∆H 2 (J/mol) are heats <strong>of</strong><br />
sorption <strong>of</strong> water in milk and c 0 and k 0 are constants. These constants are<br />
listed in Table 3.<br />
Table 3 GAB constant for skim milk and whole milk<br />
m 0 (kg/kg) C 0 k 0 ∆H 1 (J/mol) ∆H 2 (J/mol)<br />
Skim milk 0.06156 0.001645 5.710 24831 -5118<br />
Whole milk 0.04277 0.1925 2.960 10485 -3215<br />
The REA parameters above can be used for the simulation <strong>of</strong> droplet<br />
drying under changing ambient drying air humidity and temperature typically<br />
found in spray dryers. Implementation <strong>of</strong> the REA approach can be<br />
undertaken using the finite difference procedures given below [4] :<br />
1. The droplet weight, temperature, diameter and moisture content at the<br />
entry <strong>of</strong> the discretized cell are set as initial values.<br />
2. Average droplet film temperature can be calculated. The heat and<br />
mass transfer coefficients were then computed from the Nu and Sh<br />
number using Equation 18 and 19.<br />
3. The saturated vapour concentration can then be determined at the<br />
droplet temperature and the activation energy can be calculated using<br />
Equation 21 and 22 for skim or whole milk, respectively. Then the<br />
Chen, Lin, Patel, Woo – Design <strong>of</strong> spray dryers 193
droplet surface vapour concentration was calculated using Equation<br />
16.<br />
4. The drying rate dm/dt is further calculated using Equation 17 and the<br />
rate <strong>of</strong> the droplet temperature change dT/dt determined using<br />
Equation 20.<br />
5. Based on the rate <strong>of</strong> drying and temperature change, the particle mass<br />
and temperature was updated. The time interval in determining the<br />
magnitude change <strong>of</strong> these properties is obtained by comparing the<br />
particle velocity with the spatial length <strong>of</strong> the discretized section.<br />
6. At the inlet <strong>of</strong> the next discretized cell, the initial droplet weight and<br />
temperature were calculated using the values at the previous cell exit.<br />
The droplet diameter change can be calculated using the experimental<br />
correlation given below.<br />
7. This calculation cycle can be repeated until the last discretized section<br />
<strong>of</strong> the dryer.<br />
Droplet diameter change data was reported by Lin and Chen [8] . The data<br />
were correlated approximately against the solids content using the following<br />
equation:<br />
D<br />
D<br />
X<br />
= b + ( 1−<br />
b)<br />
(29)<br />
o<br />
X o<br />
where D (m) is the droplet diameter at drying time t (s), D 0 (m) is the droplet<br />
initial diameter, X (kg/kg) is the water content <strong>of</strong> the droplet at drying time t, X 0<br />
(kg/kg) is the initial water content <strong>of</strong> the droplet and b is the shrinkage<br />
coefficient. Under the circumstances <strong>of</strong> limited data, the coefficient b values<br />
were correlated as following [8] :<br />
2<br />
Skim milk: b = .0117X<br />
− 0.1295X<br />
1. 00<br />
(30)<br />
0<br />
0 0<br />
+<br />
2<br />
Whole milk: b = .0083X<br />
− 0.1036X<br />
1. 00<br />
(31)<br />
0<br />
0 0<br />
+<br />
Validations <strong>of</strong> the experimental data for the above correlations are up to 40<br />
wt% for the solids content. The drying air temperature is up to 110 o C and<br />
drying air velocity is up to 1 m/s. extrapolation is possible but may require<br />
some caution.<br />
5.0 Estimation <strong>of</strong> the dryer diameter<br />
The dryer can be designed more compact by careful estimation <strong>of</strong> its<br />
diameter (to same material for construction). This diameter may evaluated by<br />
the spray nozzle coverage along with the droplets deceleration path length.<br />
Four terms are commonly used to describe spray coverage and they are<br />
available from nozzle manufacturers (Figure 2):<br />
• <strong>Spray</strong> Angle: the included angle <strong>of</strong> the spray as measured close to the<br />
nozzle orifice. Due to the gravity and air flow affects, this parameter is<br />
useful only for determining spray coverage close to the nozzle.<br />
Chen, Lin, Patel, Woo – Design <strong>of</strong> spray dryers 194
• Actual spray coverage: the actual coverage at a specified distance<br />
from the nozzle.<br />
• Effective spray angle: the angle calculated from the actual coverage at<br />
a distance.<br />
• Theoretical spray coverage: the spray coverage at a specified distance<br />
if assuming spray moving in straight lines.<br />
Figure 2<br />
<strong>Spray</strong> angle and coverage (A: spray angle; B: effective spray<br />
angle; C: the actual coverage at a specified distance; D: the<br />
theoretical coverage at distance E)<br />
Milk concentrate leaves the atomizing device at a very high speed. The<br />
droplets contact with the drying air immediately and decelerate to reach the<br />
velocity <strong>of</strong> the surroundings. In milk powder production, the smallest droplets<br />
take about 0.1 m to decelerate and the largest droplets take about a 1 m path<br />
[2] . The actual spray coverage data at the distance when droplets reach the<br />
surrounding air velocity can be used to evaluate the diameter <strong>of</strong> the dryer.<br />
This data might be available from the nozzle manufacturer or determined<br />
through experiment (if nozzle is available). A safety factor <strong>of</strong> 0.2 to 0.4 m<br />
might be necessary to avoid wall deposition. If the actual spray coverage is<br />
not available, the theoretical spray coverage/angle and 1 meter deceleration<br />
path can be used to estimate the diameter <strong>of</strong> the spray coverage. If more than<br />
one nozzle are used, overlap <strong>of</strong> the spray coverage should be avoided.<br />
6.0 References<br />
1. Masters, K. 1979. <strong>Spray</strong> <strong>Drying</strong> Handbook. p1, London: George<br />
Godwin Limited<br />
2. Pisecky, J. 1997. Handbook <strong>of</strong> Milk Powder Manufacture. P44-51, 79.<br />
Copenhagen, Denmark: Niro A/S.<br />
3. Patel, K.; Chen, X. D.; Jeantet, R.; Schuck, P. One-dimensional<br />
simulation <strong>of</strong> co-current, dairy spray drying systems – pros and cons.<br />
Dairy Science <strong>Technology</strong> 2010, 90(2-3), 181-210.<br />
4. Chen, X. D.; Lin, S. X. Q. Air drying <strong>of</strong> milk droplet under constant and<br />
time-dependent conditions. AIChE Journal 2005, 51, 1790–1799.<br />
Chen, Lin, Patel, Woo – Design <strong>of</strong> spray dryers 195
5. Patel, K.C.; Chen, X. D.; Lin, S. X. Q.; Adhikari, B. A composite<br />
reaction engineering approach to drying <strong>of</strong> aqueous droplets containing<br />
sucrose, maltodextrin (de6) and their mixtures. AIChE Journal 2009,<br />
55, 217-223.<br />
6. Ranz, W.E.; Marshall, W.R. Evaporation from drops, Chemical<br />
Engineering Progress 1952, 48(3), 141-146.<br />
7. Lin, S. X. Q.; Chen, X. D.; Pearce, D. L. Desorption isotherm <strong>of</strong> milk<br />
powders at elevated temperatures and over a wide range <strong>of</strong> relative<br />
humidity. Journal <strong>of</strong> Food Engineering 2005, 68, 257-264.<br />
8. Lin, S. X. Q.; Chen, X. D. Engineering data <strong>of</strong> diameter change during<br />
air drying <strong>of</strong> milk droplets with 40 wt% initial solids content. <strong>Drying</strong><br />
<strong>Technology</strong> 2009, 27, 1028-1032.<br />
9. Chen, X. D. The basics <strong>of</strong> a reaction engineering approach to<br />
modelling air-drying <strong>of</strong> small droplets or thin later materials. <strong>Drying</strong><br />
<strong>Technology</strong>, 2008, 26, 627-639.<br />
10. Chen, X. D. Critical Biot number for uniform temperature assumption<br />
in transient heat and mass transfer calculations. International Journal <strong>of</strong><br />
Food Engineering, 2005, 1(3), Article 6, 1-8.<br />
Chen, Lin, Patel, Woo – Design <strong>of</strong> spray dryers 196
Perea-Flores, M.J., Chanona-Perez, J.J., Terres-Rojas, E., Calderon-Dominguez, G., Garibay-<br />
Febles, V., Alamilla-Beltran, L., Gutierrez- Lopez, G.F. A simplified design procedure for sprya<br />
dryers for milk powder manufacture - Volume 1, Ed. Woo, M.W., Mujumdar, A.S. and Daud,<br />
W.R.W., 2010, ISBN - 978-981-08-6270-1, Published in <strong>Singapore</strong>, pp. 197-218.<br />
Microstructure characterization <strong>of</strong> milk powders and their<br />
relationshp with rehydration properties<br />
Chapter 8<br />
Perea-Flores M.J. 1 , Chanona-Perez J.J. 1 , Terres-Rojas E. 1 , Calderon-<br />
Dominguez G. 1 , Garibay-Febles V. 2 , Alamilla-Beltran L. 1 , Gutierrez- Lopez<br />
G.F. 1<br />
1 Departamento de Ingeniería Bioquímica, Sección de Graduados e Investigación. Escuela Nacional de<br />
Ciencias Biológicas del Instituto Politécnico Nacional<br />
2 Laboratorio de Microscopia Electrónica de Ultra-Alta Resolución del Instituto Mexicano de Petróleo<br />
Chemical Engineering Department, Federal <strong>University</strong> <strong>of</strong> Minas Gerais, Brazil<br />
Contents<br />
Page<br />
1.0 Introduction 198<br />
2.0 Physical properties <strong>of</strong> powder 198<br />
2.1 Moisture 199<br />
2.2 Particle size 199<br />
2.3 Particle shape 200<br />
2.4 Bulk density and packed bulk density 200<br />
3.0 Rehydration properties 201<br />
4.0 Microstructure <strong>of</strong> food powder 202<br />
4.1 Microscopy techniques 202<br />
4.2 Light microscopy and stereo light microscopy 203<br />
4.3 Confocal laser light microscopy 205<br />
4.4 Conventional and environmental scanning SEM 206<br />
4.5 Image analysis 206<br />
5.0 Case study: Milk powder 209<br />
5.1 Materials and method 209<br />
5.2 Results and discussion 210<br />
6.0 Conclusion 215<br />
7.0 Acknowledgement 215<br />
8.0 References 216<br />
Perea-Flores et al. – Microstructure and rehydration properties 197
1.0 Introduction<br />
The demand <strong>of</strong> food powder products with better functional properties,<br />
has increased as a result <strong>of</strong> the market globalization, playing their<br />
physicochemical and microstructure properties a very important role on their<br />
overall reconstitution properties. Nowadays, it is expected that when<br />
reconstituting a food powder, it can be easily rehydrated with water,<br />
preserving its original properties. In this context, several factors have been<br />
reported to contribute to the reconstitution <strong>of</strong> food powders [1] , such as<br />
composition, and physical (size, shape, surface properties, density) and<br />
microstructure (uniformity, air content) properties, being the microstructure a<br />
very important factor to understand the rehydration phenomena; however it<br />
was barely considered during the last century by food engineers, maybe as a<br />
result <strong>of</strong> the few knowledge about the underlying sciences linking food<br />
structure to product properties and the lack <strong>of</strong> techniques that allow acquiring<br />
better food structure images to be able to quantify [2][3] .<br />
Nowadays, image analysis has been applied to food images, as acquired<br />
by different microscopic systems, to obtain numerical data about morphology,<br />
structure and microstructure <strong>of</strong> the analyzed foods. The extracted information<br />
has been useful to improve the understanding <strong>of</strong> structure-function<br />
relationships <strong>of</strong> these complex systems, such as food and biological<br />
materials. On the other hand, fractal analysis has been successfully applied<br />
for the quantitative evaluation <strong>of</strong> irregular surfaces and textures <strong>of</strong> biological<br />
materials, and also to characterize ruggedness and geometric complexities <strong>of</strong><br />
different food particles, such as instant c<strong>of</strong>fee, skim milk, potato starch<br />
powder, maltodextrin particles and others. The key to quantify the irregularity<br />
<strong>of</strong> the contours and surfaces <strong>of</strong> food materials is by evaluating the apparent<br />
fractal dimension (FD) by extracting structural and microstructural features<br />
from different microscopy images. These results are important to understand<br />
the architecture and microstructure-functionality properties <strong>of</strong> food products.<br />
For this reason, microscopy and image analysis techniques could be<br />
considered as proper tools to evaluate qualitatively and quantitatively the food<br />
microstructure, making possible to carry out numerical correlations between<br />
microstructure data, as obtained from the images, and the functional<br />
properties <strong>of</strong> food powders. The objective <strong>of</strong> this contribution was to illustrate<br />
the application <strong>of</strong> image analysis to the study <strong>of</strong> milk powder microstructure.<br />
2.0 Physical properties <strong>of</strong> powder<br />
There are several characteristics <strong>of</strong> single particles or agglomerates that<br />
are important for physicochemical and functional properties such as moisture,<br />
particle size and shape, density, roughness, texture, rehydration capability,<br />
wettability, insolubility index, among others [4] . According to Bhandari [5] ,<br />
powder properties can be classified into fundamental, functional, defects and<br />
image parameters. Some powder properties are illustrated in Table 1.<br />
Perea-Flores et al. – Microstructure and rehydration properties 198
2.1 Moisture<br />
Milk powder show very low moisture content (
2.3 Particle shape<br />
All geometrical features <strong>of</strong> individual food powder particles or<br />
agglomerates can be related to their structures and individual shapes [4] . The<br />
shape <strong>of</strong> particles can be spherical, shriveled or fragmented depending on the<br />
type <strong>of</strong> the material and the process parameters used, mainly the temperature<br />
used to obtain them. The sphericity, also refers as circularity, is a parameter<br />
commonly applied to describe the shape <strong>of</strong> particles and agglomerates; when<br />
the sphericity parameter shows a value <strong>of</strong> 1.0, it makes reference to a perfect<br />
circle, while when values <strong>of</strong> 0.7-0.8 are observed, they indicate irregular<br />
particle shape.<br />
Particle shape influences functional properties <strong>of</strong> food powders such as<br />
mixing, flowability and bulk density. Normally, a low solid concentration feed<br />
during spray drying result in more spherical particles, whereas a high solid<br />
concentration feed or a poor atomization procedure generates irregular<br />
shapes (sometimes filament-like particles). Particle shapes can be observed<br />
in detail by stereo, optical, electronic or confocal scanning microscopy [4][5][7] .<br />
2.4 Bulk density and packed bulk density<br />
The density <strong>of</strong> a powder is defined as its total weigh divided by its total<br />
volume and normally is expressed as g/mL or kg/L. Density is considered<br />
quite relevant for determining other particle properties such as bulk powder<br />
structure and particle size [5][7][11] .<br />
Bulk density, also named apparent density, is the weight <strong>of</strong> powder per<br />
unit volume and is normally expressed in g/mL. It is dependent on the degree<br />
<strong>of</strong> interparticulate space or porosity <strong>of</strong> the bulk volume. Bulk density <strong>of</strong> powder<br />
is influenced by particle density, size distribution, shape, electrostatic effect<br />
and moisture content. This property is important in packaging, good<br />
reconstitution and retail use.<br />
Packed bulk density, also named compact or tapped density, differs from<br />
bulk density in the way they are measured. The packed bulk density is<br />
obtained by tapping the powder by a standard mechanical or dropping<br />
procedure, where a cylinder containing the powder is dropped straight onto a<br />
pad for a given number <strong>of</strong> times (in general 10 times to 100) from a certain<br />
height (10cm). It is much better to use a mechanical tapping device so that<br />
the conditions <strong>of</strong> sample preparation can be more reproducible [4][5] . Packed<br />
bulk density <strong>of</strong> powders can vary from 0.4-0.8g/mL, but it can be increased by<br />
the addition <strong>of</strong> binding agents to the feed, which improves the particle<br />
strength, prevents particle ballooning and allows to operate at higher solids<br />
concentration feed during spray drying [5][13] .<br />
Perea-Flores et al. – Microstructure and rehydration properties 200
3.0 Rehydration properties<br />
Food powder products, as obtained by spray drying or grinding, are<br />
difficult to rehydrate [7] and several factors have been related to this effect<br />
such as the size, shape, surface properties, density, uniformity, air content,<br />
composition and the presence <strong>of</strong> additives among others [1] . The rehydration<br />
capacity <strong>of</strong> food powders is generally evaluated by measuring four properties:<br />
wettability, sinkability, dispersability and solubility [1][4-5][7][12][14][15] .<br />
a) Wettability. This property describes the capacity or ability <strong>of</strong><br />
particles or bulk powder to absorb water on their surface, being the<br />
wetting time the most important variable when considering<br />
instantiation [7][15] . The wettability property depends largely on the<br />
size and on the shape <strong>of</strong> particles; small particles (less than 100<br />
m) tend to clump together, by increasing its surface:mass ratio<br />
and reducing the rate at which water penetrates. Therefore,<br />
increasing particle size (> 100 µm) can decrease the incidence <strong>of</strong><br />
clumping, by allowing particles or agglomerates to interact with<br />
water as it enters through the empty spaces between particles,<br />
separating them [1] .<br />
b) Sinkability. It is the ability <strong>of</strong> powders to sink in water when they are<br />
moistened [4] and it is evaluated by measuring the time they<br />
required to sink. This property depends on the particle density,<br />
shape and size, where larger and denser particles sink faster as<br />
compared to smaller and lighter ones. Particles with a higher<br />
content <strong>of</strong> occluded air exhibit poor sinkability as a result <strong>of</strong> their low<br />
density, regardless <strong>of</strong> how large they are. Agglomerated powders<br />
usually did not sink in water [1] .<br />
c) Dispersibility. It is described as the ability <strong>of</strong> powers to be<br />
distributed throughout the water, assisted or not by a low energy<br />
stirring. This property can be measured as a percentage <strong>of</strong><br />
dissolved powder after stirring the powder for 20 s and filtering the<br />
reconstituted liquid through a 150 µm sieve. It can also be<br />
quantified by the rate <strong>of</strong> increase <strong>of</strong> opacity or optical density <strong>of</strong> the<br />
solution. It’s also important that the particles settle slowly enough or<br />
remain suspended so they do not form sediments within a certain<br />
period <strong>of</strong> time.<br />
d) Solubility. It refers to the rate and extent at which the components <strong>of</strong><br />
the powder particles dissolve in water. After reconstituting the<br />
powder, the solution is centrifuged and the undissolved particles<br />
that settle on the bottom <strong>of</strong> the centrifuge tube are measured<br />
directly by volume (solubility index) or heated to dryness<br />
(percentage <strong>of</strong> soluble solids).<br />
Different techniques have been applied to evaluate food powder instant<br />
properties (Barbosa-Cánovas and Juliano, 2005) such as the penetration<br />
speed test, the standard dynamic wetting test and dynamic wetting test<br />
(Schubert 1980; Pietsch, 1999). However some <strong>of</strong> them do not consider some<br />
Perea-Flores et al. – Microstructure and rehydration properties 201
factors such as the solvent temperature, the liquid surface area, the amount <strong>of</strong><br />
material to be dissolved, or the method used for depositing the powders on<br />
the liquid surface [15] regardless they play an important role during the<br />
rehydration process.<br />
4.0 Microstructure <strong>of</strong> food powders<br />
Nowadays, the study <strong>of</strong> food powder microstructure is very important;<br />
however it was ignored by food engineers for a long time. In the past<br />
decades, the emphasis <strong>of</strong> the food industry development was given on<br />
designing safe and reliable processes, while innovation and quality were not<br />
major driving forces in the food market and the knowledge about the<br />
underlying sciences linking food structure to product properties was just<br />
initiating. Moreover, the techniques aiding in the study <strong>of</strong> microstructure were<br />
not fully developed to provide useful data (e.g. quantitative information) to<br />
engineers [3][16] .<br />
Currently, the study <strong>of</strong> food structure has grown in parallel with the<br />
development <strong>of</strong> better microscopy, visualization, and image<br />
processing/analysis techniques (Figure 1), including noninvasive and realtime<br />
methods, many <strong>of</strong> them taken from biology and material sciences. In the<br />
next pages, some <strong>of</strong> the available microscopy and image analysis techniques<br />
are explained.<br />
4.1 Microscopy technique<br />
Microscopy methods, as used in the food industry, are frequently a<br />
combination <strong>of</strong> those employed in biological and materials sciences [17] . These<br />
techniques, when applied in conjunction with image processing and micro<br />
analytical methods are useful to observe food structures as well as to provide<br />
the needed data to derive realistic physical or mathematical models <strong>of</strong> foods.<br />
Furthermore, advanced microprobe techniques, that combine microscopy and<br />
spectroscopy, have made possible the evaluation <strong>of</strong> sample’s composition as<br />
well as the state <strong>of</strong> the individual phases <strong>of</strong> the sample in a particular area in<br />
the field <strong>of</strong> view [16][18][19][20] .<br />
Examining food microstructure is always a difficult task because <strong>of</strong> the<br />
complexity <strong>of</strong> the materials involved. One useful approach to differentiate<br />
structural features from artifacts is correlative microscopy, defined as the<br />
practice <strong>of</strong> using a combination <strong>of</strong> microscopic techniques in order to<br />
distinguish real images from false responses during image interpretation.<br />
Some <strong>of</strong> the available methods to fulfill these purpose are light microscopy<br />
(LM), environmental, scanning electron microscopy (ESEM), and confocal<br />
laser scanning microscopy (CLSM), among others, that constitute a battery <strong>of</strong><br />
powerful techniques matchless in flexibility, intrusion or simplicity <strong>of</strong> sample<br />
preparation, covering the whole dimensional scale from the molecular to the<br />
macrostructural level [21-24]. The generated microstructural information can<br />
be used to understand different process and to assess the functionality <strong>of</strong><br />
finished products (so-called structure-function relationships). Efforts has been<br />
made to derive the appropriate scaling laws from the results obtained at the<br />
Perea-Flores et al. – Microstructure and rehydration properties 202
microstructural level and to convert them into a nanoestructural one. Figure 2<br />
shows some <strong>of</strong> the different microscopes used in food science.<br />
Figure 1<br />
Microscopy and image analysis techniques applied in the study<br />
<strong>of</strong> biomaterial’s microstructure.<br />
4.2 Light microscopy and stereo light microscopy<br />
The light microscope is an instrument for visualizing fine detail <strong>of</strong> an<br />
object by creating a magnified image through the use <strong>of</strong> a series <strong>of</strong> glass<br />
lenses, which first focus a beam <strong>of</strong> light onto or through an object, and convex<br />
objective lenses to enlarge the image formed [17] , in other words light<br />
microscopy involves passing visible light transmitted through or reflected from<br />
the sample through a single or multiple lenses to allow a magnified view <strong>of</strong> the<br />
sample [25] . This technique has a resolution about 10 3 times smaller than the<br />
human’s vision [26] . The magnification range extends from X10 to X1000, with<br />
a resolving power <strong>of</strong> the order <strong>of</strong> 0.2 µm, depending on the type and<br />
numerical aperture (area available for passage <strong>of</strong> light) <strong>of</strong> the objective lenses<br />
[17] ; in conventional LM, using blue light <strong>of</strong> wavelength <strong>of</strong> 470 nm and having<br />
an oil immersion objective lens with a numerical aperture equal to 1.40, the<br />
resolution would be limited to about 200 nm. However the magnification <strong>of</strong><br />
light microscopy is modest as compared to electron microscopy and atomic<br />
force microscopy [27][28] .<br />
Perea-Flores et al. – Microstructure and rehydration properties 203
A<br />
B<br />
Stereomicroscope (Nikon SMZ1500,<br />
ESEM XL-30 (Philips,<br />
C<br />
LSM 710 (Carl Zeiss,<br />
Figure 2<br />
Different kinds <strong>of</strong> microscopes applied in the study <strong>of</strong> food<br />
microstructure. A) Stereomicroscope, B) Environmental Scanning<br />
Electron Microscope, C) Confocal Laser Scanning Microscope.<br />
Sample preparation for LM is less complex than others microscopic<br />
techniques. Food materials can be examined as a whole, but usually studies<br />
<strong>of</strong> cellular structure require the cutting <strong>of</strong> sections. Microtomes allow cutting<br />
sections <strong>of</strong> uniform thickness, in order to maintain structural integrity; tissues<br />
are <strong>of</strong>ten embedded with materials such as paraffin wax, plastics, or resins;<br />
alternatively, sectioning can be performed on frozen material. In LM is<br />
common to apply a specific stain or dye in order to improve contrast or<br />
differentiate tissues. Finally, the specimen is placed on a glass microscope<br />
slide, a suitable mounting media is applied, and a cover glass is added.<br />
In LM, the microstructural details become visible due to the absorption <strong>of</strong><br />
a portion <strong>of</strong> the light. Incident light is mainly used for the examination <strong>of</strong> solid<br />
or opaque objects, although, new forms <strong>of</strong> light microscopes has been<br />
developed based on fluorescent materials’ properties, where the source <strong>of</strong><br />
light is <strong>of</strong>ten a single or multicolor tungsten or quartz halogen lamps, but<br />
xenon arc or mercury lamps provide more intense beams, as required for<br />
fluorescence microscopy [17] .<br />
The Stereo Light Microscope (SLM) is an invaluable tool for scientists in<br />
observing the structures <strong>of</strong> biological materials, where a full view <strong>of</strong> a<br />
specimen is obtained by using a convergent optical system [28] . It is used<br />
primarily to assist the quantitative analysis <strong>of</strong> size, shape and overall<br />
morphology <strong>of</strong> both static and alive specimens. Quantitative SLM techniques<br />
are rarely found, even with the recent extensive usage <strong>of</strong> image processing<br />
and analysis hardware and s<strong>of</strong>tware tools. Moreover, in most cases, the<br />
Perea-Flores et al. – Microstructure and rehydration properties 204
measurements performed are essentially 2D, such as the perimeter or area <strong>of</strong><br />
the biomaterials shape [28][29] .<br />
4.3 Confocal laser scanning microscopy<br />
Confocal laser scanning microscopy is a rather new technique for<br />
structural analysis <strong>of</strong> biological and food materials. In contrast to conventional<br />
light microscopy, the light source is replaced by laser beam, a scanning unit<br />
and a pinhole in the back focal plane, which improves the limited depth <strong>of</strong><br />
focus [30] . The newly developed CLSM is particularly suitable for acquiring<br />
high-quality 3D microscopic images <strong>of</strong> quasi-static specimens, as a serial<br />
scanning is done at different focal planes, prohibiting the study <strong>of</strong> rapid, live<br />
3D motion specimens [29-31]. Advanced computer imaging technologies,<br />
fluorescent probe developments, and computer designed optics have all been<br />
integrated to improve analytical light microscopes. This combination has<br />
produced a microscope with the capacity to obtain higher resolution<br />
volumetric images [23] .<br />
The primary value <strong>of</strong> the CLSM is its ability to produce a three-dimension<br />
(3-D) image <strong>of</strong> thick samples by scanning the specimen at different focal<br />
planes. Therefore, by moving the focal plane <strong>of</strong> the instrument by steps <strong>of</strong><br />
defined distance ( m-range) through the depth <strong>of</strong> the specimen, a stack <strong>of</strong><br />
optical sections can be recorded. This property <strong>of</strong> the CLSM is fundamental<br />
for solving 3-D problems where information as obtained from regions distant<br />
from the plane <strong>of</strong> focus can blur the image <strong>of</strong> such objects; in other words, in<br />
the confocal principle, a light source (typically a laser) is focused to a<br />
diffraction-limited spot (airy disk) at the specimen by the objective lens.<br />
Reflected light or emitted fluorescence is focused by the same lens to a spot<br />
at the detector. At this point a pinhole is placed, so that only the in-focus<br />
beams will pass through out the pinhole to the detector, while the other will be<br />
blocked. By scanning successive planes, a three-dimensional image <strong>of</strong> the<br />
sample can be created. CLSM also <strong>of</strong>fer a modest increase in resolution,<br />
since the detected signal is the square <strong>of</strong> the point spread function <strong>of</strong> the<br />
objective lens [23][30-35] . Since the resolution achieved by a conventional<br />
widefield light microscope (0.2 µm theoretical), is not larger than the one<br />
obtained from a transmission electron microscope (0.1 nm), the gap between<br />
these two commonly used techniques has been bridged [32] .<br />
The application <strong>of</strong> CLSM to food materials has been particularly fruitful in<br />
the area <strong>of</strong> lipid components or fat crystal networks, because optical<br />
sectioning overcomes the tendency <strong>of</strong> fats to smear and migrate and lipids<br />
are amenable to fluorescent staining [16] . The possibility to combine CLSM<br />
with rheological measurements, light scattering and other physical analytical<br />
techniques in the same experiments with specially designed stages <strong>of</strong>fers the<br />
possibility to obtain detailed structural information <strong>of</strong> complex food systems<br />
[30] . Also, it is an important tool, when applied in a epi-reflection mode, to study<br />
the dynamics <strong>of</strong> living cells, 3D reconstruction <strong>of</strong> biomaterials, evaluation <strong>of</strong><br />
topography and surfaces <strong>of</strong> samples and the study <strong>of</strong> the microstructure <strong>of</strong><br />
aqueous phase separated protein-polysaccharide mixtures, among others<br />
[30][32] .<br />
Perea-Flores et al. – Microstructure and rehydration properties 205
4.4 Conventional and environmental SEM<br />
In electron microscopy, a beam <strong>of</strong> electrons, rather than light, is used to<br />
form a magnified image <strong>of</strong> specimens and where the electrons provide as<br />
much as thousand fold increments in resolving power. As an electron beam<br />
interacts on the sample, a variety <strong>of</strong> signals that can be captured to obtain<br />
images are generated. The two basic types <strong>of</strong> electron microscopes are the<br />
transmission electron microscope (TEM), in which transmitted electrons are<br />
captured, and the scanning electron microscope (SEM), in which secondary<br />
electrons are captured. Nowadays, electron microscopy technique has been a<br />
useful tool for investigating the microstructures <strong>of</strong> cereal grains, dough, beef,<br />
ken and others [20][35][36] .<br />
One <strong>of</strong> the latest developments in electron microscopy is the<br />
environmental scanning electron microscope (ESEM), which enables to be<br />
viewed s<strong>of</strong>t, moist and/or electrically insulating materials without pretreatment,<br />
unlike conventional scanning electron microscopy (SEM), in which<br />
specimens must be solid, dry and usually electrically conductive [37] . With<br />
ESEM wet, fully hydrated or high vapor samples can be analyzed in their<br />
native state, which makes possible to obtain better information about food<br />
structure [22] .<br />
The development <strong>of</strong> the ESEM technique has have significant<br />
implications on the study <strong>of</strong> the native surfaces <strong>of</strong> specimens, including rocks<br />
and minerals, polymers, biological tissue and cells, food and pharmaceutical<br />
products, precious artifacts, forensic material, and nowadays, this technique is<br />
highly demanded for obtaining three-dimensional (3D) images <strong>of</strong> food<br />
structures [20][28][35-37] . Therefore, the study <strong>of</strong> food properties for various<br />
applications requires a better understanding <strong>of</strong> the relationships between the<br />
food microstructure and macroscopic properties, showing the importance to<br />
know the different techniques available for qualitative and quantitative studies<br />
<strong>of</strong> biomaterials structure.<br />
4.5 Image analysis<br />
Image analysis techniques have been applied increasingly for food<br />
quality evaluation and also to provide valuable qualitative and quantitative<br />
insights into the microstructural dimensional change behavior during<br />
processing <strong>of</strong> food materials. Increased demands for objectivity, consistency<br />
and efficiency have required the introduction <strong>of</strong> computer-based image<br />
processing techniques. Recently, computer vision systems employing image<br />
analysis techniques have been developed to quantitatively characterize<br />
complex size, shape, color and texture properties <strong>of</strong> foods. Image analysis<br />
techniques usually consist <strong>of</strong> five steps (Figure 3) [3][38-41] .<br />
1. Image acquisition. Several sensors and microscope systems such as<br />
charge coupled device (CCD) camera, ultrasound, magnetic resonance<br />
imaging (MRI), computed tomography (CT), electrical tomography (ET), TEM,<br />
SEM, ESEM, CLSM among others (Figure 3) are used widely to obtain<br />
Perea-Flores et al. – Microstructure and rehydration properties 206
images <strong>of</strong> food products. When acquiring images, it is also important to<br />
consider the effect <strong>of</strong> illumination intensity and the specimen’s orientation<br />
relative to the illumination source because the gray level <strong>of</strong> the pixels is<br />
determined not only by the physical features <strong>of</strong> the surface but also by these<br />
two parameters.<br />
2. Pre-processing. The digital images must be preprocessed to improve the<br />
image data, which suppresses unwilling distortions or enhances some image<br />
features that are important for further processing and creates a more suitable<br />
image than the original for a specific application. Using digital filtering, the<br />
noise <strong>of</strong> the image, which may degrade the quality <strong>of</strong> an image and<br />
subsequently image processing, can be removed and the contrast can be<br />
enhanced. In addition, in this step the color image is converted to a grayscale<br />
image, called the intensity image.<br />
3. Segmentation. The techniques <strong>of</strong> image segmentation developed for food<br />
quality evaluation can be divided into four different philosophical approaches<br />
(thresholding-based, region-based, gradient-based, and classification-based<br />
segmentation). Intensity image is used to identify disjoint regions <strong>of</strong> the image<br />
with the purpose <strong>of</strong> separating the part <strong>of</strong> interest from the background. The<br />
region <strong>of</strong> interest within the image corresponds to the area where the “studied<br />
material “is located. This segmented image (S) is a binary image consisting<br />
only <strong>of</strong> black and white pixels, where “0” (black) and “1” (white) means<br />
background and object, respectively.<br />
4. Feature extraction. During this process the segmented image is measured<br />
by evaluating geometric properties (perimeter, form factors, Fourier<br />
descriptors, invariant moments, and so forth), color characteristics (mean<br />
value, gradient, 2nd derivative and so forth) and textural parameters (fractal<br />
texture and GLCM texture analysis) (Table 2). The geometric features are<br />
computed from the segmented image, while the intensity features are<br />
extracted from the intensity image and the color features from the RGB<br />
images. Through GLCM texture analysis is possible to obtain different<br />
parameters such as angular second moment, contrasts entropy, among<br />
others. The texture <strong>of</strong> an image is characterized by the spatial distribution <strong>of</strong><br />
grey levels in a neighborhood [42] . Image texture (IT) is defined as repeating<br />
patterns <strong>of</strong> local variations in image intensity that are too fine to be<br />
distinguished as separate objects at the observed resolution, that is, the local<br />
variation <strong>of</strong> brightness from 1 pixel to the next (or within a small region). It can<br />
be used to describe such image properties as smoothness, coarseness, and<br />
regularity. The IT <strong>of</strong> some food surfaces has been described quantitatively by<br />
fractal methods. Besides fractal properties other important characteristics<br />
could be obtained from the information <strong>of</strong> an image such as statistical,<br />
geometrical, and signal-processing properties, among others. It is important<br />
to know which features will provide relevant information for the classification<br />
process. For this reason, a feature selection must be performed in a training<br />
phase.<br />
5. Classification. A classifier is designed by following a supervised training,<br />
and simple classifiers may be implemented by comparing measured features<br />
with threshold values. Nonetheless, it is also possible to use more<br />
sophisticated classification techniques such as statistical, fuzzy logic, and<br />
Perea-Flores et al. – Microstructure and rehydration properties 207
neutral networks that have as a common objective to simulate a human<br />
decision-maker´s behavior, and have the advantage <strong>of</strong> consistency and, to a<br />
variable extent, explicitness. The extracted features <strong>of</strong> each region are<br />
analyzed and assigned to one <strong>of</strong> the defined classes, which represent all<br />
possible types <strong>of</strong> regions expected in the image.<br />
Table 2<br />
Parameters obtained from digital images<br />
Feature extraction<br />
Geometric parameters Color parameter Textural parameters<br />
Size<br />
Area<br />
Perimeter<br />
Shape factor<br />
Compactness<br />
Fractal dimensions (FD)<br />
Mean particle size<br />
Circularity<br />
Feret diameter<br />
Eccentricity<br />
Among others.<br />
RGB<br />
CIE L*a*b*<br />
XYZ<br />
Luv<br />
YCbCr<br />
Intensity<br />
Among others.<br />
Fractal texture (FDt)<br />
Fractional Brownian<br />
motion<br />
GLCM (Grey Level Cooccurrence<br />
matrix)<br />
texture analysis:<br />
Entropy<br />
Angular Second<br />
moment<br />
Contrast<br />
Correlation<br />
Inverse Difference<br />
Moment<br />
Among others.<br />
Figure 3<br />
Image analysis methodology<br />
Perea-Flores et al. – Microstructure and rehydration properties 208
5.0 Case study: milk powder<br />
The relationship between the microstructure <strong>of</strong> food powders and their<br />
rehydration properties can be illustrated by the application <strong>of</strong> microscopy<br />
techniques and image analysis processing on different milk powders samples.<br />
5.1 Materials and methods<br />
Five different commercial milk powder samples were acquired from local<br />
retail markets in Mexico City. The bulk and packed bulk density <strong>of</strong> milk<br />
powders were determinate as reported by Shittu and Lawal [12] and Niro’s<br />
analytical methodology [11] , respectively, while moisture was evaluated<br />
following the 32.1.02 AOAC method [43] .<br />
Milk powder rehydration capability was quantified by evaluating the<br />
samples wettability, dispersibility and solubility. Wettability or wetting time was<br />
measured as described by Niro Company [11] . The wetting time is defined as<br />
the time (in seconds) required to a 10g sample become wetted. Solubility<br />
index was evaluated as described by Niro [11] and Shittu and Lawal [12] , where<br />
the sample (10g) was dispersed in 100 mL <strong>of</strong> distilled water (24ºC); this<br />
suspension was stirred at 400 rpm for 90 seconds and allowed to rest for 15<br />
min, afterward, 50mL <strong>of</strong> this suspension was centrifuged at 10000 rpm for 5<br />
min. Finally, the precipitate was re-suspended in 50 mL <strong>of</strong> distilled water and<br />
centrifuged at 10000 rpm for 5 min. Precipitate volume was measured directly<br />
from centrifuge tubes. Dispersibility was determined by stirring 25 g <strong>of</strong> the<br />
sample with 250 mL <strong>of</strong> distilled water (25°C) for 20 s at 100 rpm. This<br />
suspension was filtered through a membrane <strong>of</strong> 100 microns; the residue was<br />
weighted and the weight difference gives the amount <strong>of</strong> dust that is dispersed<br />
in the liquid [11] .<br />
Milk powder agglomerates images were obtained using both, a light<br />
stereo-microscope (LSM) (Nikon SMZ1500, Japan) and an Environmental<br />
Scanning Electron Microscope (ESEM, XL30 Philips, USA). The images <strong>of</strong><br />
agglomerates were obtained by LSM fitted with a CCD camera (Nikon Digital<br />
Sight DS-2Mv, TV Lens 0.55X DS, Japan) and connected to a PC by means<br />
<strong>of</strong> NIS-Elements F 2.30 S<strong>of</strong>tware. RGB images (800x600 square pixels) were<br />
captured and converted to 8-bit images. The samples were gently deposited<br />
on a glass slide and for each sample, at least 600 particles were<br />
characterized to ensure stabilization <strong>of</strong> the average value and stand error <strong>of</strong><br />
descriptors. These images were analyzed to obtained morphological<br />
parameters such as particle size, shape factor, compactness and fractal<br />
dimension <strong>of</strong> contour (FDc) as described [45] .<br />
Fractal dimension <strong>of</strong> texture (FDt) was extracted from ESEM images [44] .<br />
Image analysis was performed using the public domain program NIH ImageJ<br />
1.34s (<strong>National</strong> Institute <strong>of</strong> Health, USA, available from:<br />
http://rsb.infor.nhi.gov/ij/) combined with other commercial s<strong>of</strong>tware, such as<br />
Sigma ScanPro 5. All morphological and FDt were extracted from images by<br />
applying the ImageJ s<strong>of</strong>tware. FDt <strong>of</strong> images was evaluated by power-law<br />
scaling, using the Shifting Differential Box Counting method as proposed by<br />
Perea-Flores et al. – Microstructure and rehydration properties 209
Wen-Shiung et al. [44] . FDt was calculated by means <strong>of</strong> the Mapfractalcount<br />
plug-in (v 1.0, available on line). FDt was estimated from the slope in the log<br />
(box count) vs. log (box size) plot. All analyses were done in triplicate.<br />
5.2 Results and discussion<br />
Table 3, presents the rehydration properties and FDt results <strong>of</strong> milk<br />
powder agglomerates. These data showed that the sample A presents<br />
significant difference as compared to the other samples, with the largest<br />
values <strong>of</strong> wettability and insolubility index. It is possible that these differences<br />
among samples could be generated by their different composition (sample 2<br />
is whole milk powder added with nutritional components, while sample B, C<br />
and D are skim milk powders). Sample B showed the smallest volume <strong>of</strong><br />
sediments and the lowest value in wettability as compare to others samples.<br />
These differences might be due to size and morphology <strong>of</strong> agglomerates, and<br />
image analysis results provide more information about the relationship<br />
between rehydration capability and microstructure. When the values <strong>of</strong><br />
particle size and FDt were large a better rehydration capability (lower values<br />
<strong>of</strong> wettability and insolubility index) was observed as is shown in the Figure 4.<br />
These results presented a similar tendency as those reported [4][14] .<br />
Table 3<br />
Rehydration properties and FDt values <strong>of</strong> powder milk samples<br />
Simples <strong>of</strong><br />
milk powder<br />
Wettability<br />
(seg)<br />
Dispersibility<br />
(%)<br />
Insolubility<br />
index (mL)<br />
FDt<br />
A 8019 ± 641.4 b 97.577 ± 0.058 2.16 ± 0.19 2.6315 ± 0.0083ª<br />
B 6.68 ± 0.16ª 99.402 ± 0.009ª 0.34 ± 0.02ª 2.6479 ±<br />
0.0076 ab<br />
C 13.74 ± 0.42 ac 99.358 ± 0.036ª 0.66 ± 0.08 ab 2.6811±0.0187 ab<br />
D 140.77 ±<br />
28.00 bc 98.409 ± 0.024 0.98 ± 0.08 b 2.6987± 0.0085 b<br />
*Values followed by the simple letter in the same column are not significantly different (Tukey test,<br />
p
Figure 4<br />
Relationship between rehydration capability (wettability and<br />
insolubility index) and Particle size and FDt values.<br />
Physical properties <strong>of</strong> powder milk agglomerates are presented in the Table 4,<br />
where the largest bulk density (sample A, Table 4), corresponds to the particle<br />
<strong>of</strong> smallest size (Figure 4), in other words, sample A showed the least<br />
capability to particle agglomeration and therefore this sample could be<br />
considered to have almost a spherical shape. In contrast, the others samples<br />
(see Samples B, C and D, in Table 4) were not significantly different.<br />
Samples’ moisture content varied from 3 to 4 % and these values were similar<br />
to those reported on commercial milk powders.<br />
Table 4 Physical properties <strong>of</strong> powder milk samples.<br />
Samples <strong>of</strong><br />
milk powder<br />
Bulk density<br />
(g/mL)<br />
Packed bulk<br />
density (g/mL)<br />
Moisture (%)<br />
A 0.47 0.61 4<br />
B 0.38 0.56 3.4<br />
C 0.37 0.57 4<br />
D 0.38 0.57 3.8<br />
Perea-Flores et al. – Microstructure and rehydration properties 211
Morphological parameters <strong>of</strong> powder milk agglomerates (shape factor,<br />
compactness, FDc and particle size) are presented in the Table 5. ANOVA<br />
tests showed that these parameters did not present significant differences,<br />
with the exception <strong>of</strong> sample A. Image analysis results showed that samples<br />
presented a wide range <strong>of</strong> particles sizes, varying from 110 to 380 m, where<br />
the lowest sizes could be associated with the minor rehydration capability<br />
(see sample A in Table 3). Shape factor and compactness are a measure <strong>of</strong><br />
the circularity, while FDc is a measure <strong>of</strong> tortuosity <strong>of</strong> agglomerates, thus the<br />
highest values <strong>of</strong> shape factor and the lowest values <strong>of</strong> compactness and FDc<br />
were associated with spherical agglomerates and the least rehydration<br />
capability (see sample A in Table 3) probably as a result <strong>of</strong> a smoother<br />
surfaces <strong>of</strong> the surfaces <strong>of</strong> milk powder agglomerates (see sample A in the<br />
Figure 7). The morphological parameters values for different milk samples are<br />
shown in Figure 5; these results showed that the largest values <strong>of</strong> particle<br />
sizes can be associated with a major irregularity <strong>of</strong> agglomerates (larger<br />
values <strong>of</strong> shape factor and FDc). When comparing Figures 4 and 5, the<br />
largest sizes <strong>of</strong> the particles and the irregularity <strong>of</strong> agglomerates could be<br />
related to a better rehydration capability.<br />
Table 5<br />
Morphological parameters <strong>of</strong> powder milk samples.<br />
Samples<br />
<strong>of</strong> milk<br />
powder<br />
Shape factor Compactness FDc Particle size ( m)<br />
A 0.641 ± 0.009 24.392 ± 0.729 1.1289 ± 0.0025 116.368 ± 5.808<br />
B 0.469 ± 0.009ª 37.360 ± 1.126ª 1.1370 ± 0.0024ª 341.737 ± 12.392ª<br />
C 0.435 ± 0.009ª 43.190 ± 1.533ª 1.1465 ± 0.0025 b 355.844 ± 13.975ª<br />
D 0.441 ± 0.009ª 40.224 ± 1.273ª 1.1465 ± 0.0031 ab 371.626 ± 13.166ª<br />
*Values followed by the simple letter in the same column are not significantly different (Tukey test,<br />
p
Figure 5<br />
Relationship between morphological parameters and particle<br />
size<br />
Figure 6<br />
Sample A <strong>of</strong> powder milk. a) Agglomerated image <strong>of</strong> powder<br />
milk obtained by means light stereo-microscope at 60X, b) and<br />
c) Environmental Scanning Electron Micrographs <strong>of</strong> particles<br />
with an agglomerated structure at 400X and 1500X respectively;<br />
and d) Gray level surface plot obtained by ESEM images.<br />
Perea-Flores et al. – Microstructure and rehydration properties 213
Figure 7<br />
Sample B <strong>of</strong> powder milk. a) Agglomerated image <strong>of</strong> powder milk<br />
obtained by means light stereo-microscope at 60X, b) and c)<br />
Environmental Scanning Electron Micrographs <strong>of</strong> particles with an<br />
agglomerated structure at 400X and 1500X respectively; d) Gray level<br />
surface plot obtained by ESEM images.<br />
Figure 8.<br />
Sample C <strong>of</strong> powder milk. a) Agglomerated image <strong>of</strong> powder milk<br />
obtained by means light stereo-microscope at 60X; b) and c)<br />
Environmental Scanning Electron Micrographs <strong>of</strong> particles with an<br />
agglomerated structure at 400X and 1500X respectively; and d) Gray<br />
level surface plot obtained by ESEM images.<br />
Perea-Flores et al. – Microstructure and rehydration properties 214
Figure 9.<br />
Sample D <strong>of</strong> powder milk. a) and b) Environmental Scanning Electron<br />
Micrographs <strong>of</strong> particles with an agglomerated structure at 400X and<br />
1500X respectively. c) Agglomerated image <strong>of</strong> powder milk obtained by<br />
means light stereo-microscope at 60X and d) Gray level surface plot<br />
obtained by ESEM images.<br />
6.0 Conclusion<br />
The present contribution is a brief description <strong>of</strong> the application <strong>of</strong> microscopy<br />
techniques and images analysis for morphology and microstructure<br />
characterization <strong>of</strong> food powders and their relationship with rehydration and<br />
physical properties. The given example shows simple correlations between<br />
microstructure <strong>of</strong> milk powders, as obtained by image analysis techniques,<br />
and their physical and rehydration properties. The more relevant results were<br />
the correspondence <strong>of</strong> higher values <strong>of</strong> particle size, shape factor, FDc and<br />
FDt with a better rehydration capability <strong>of</strong> samples. The methodology used in<br />
this work could be useful to evaluate other powders <strong>of</strong> importance for food<br />
and pharmaceutical industry.<br />
7.0 Acknowledgement<br />
This work has been supported by the Instituto Politénico Nacional (IPN) <strong>of</strong><br />
México; Secretaría de Investigación y Posgrado (SIP: 20100771) del IPN<br />
research projects and Consejo Nacional de Ciencia y Tecnologia (CONACYT:<br />
59730).<br />
Perea-Flores et al. – Microstructure and rehydration properties 215
8.0 References<br />
1. Hogekamp, S.; Schubert, H. Rehydration <strong>of</strong> Food Powders. Food<br />
Science and <strong>Technology</strong> International 2003, 98(3), 223-235.<br />
2. Aguilera, J.M. Microstructure and Food Product Engineering. Food<br />
<strong>Technology</strong> 2007, 54(11), 56-65.<br />
3. Chanona-Pérez, J.; Quevedo, R.; Jimenez-Aparicio, A.R.; Gumeta-<br />
Chávez, C.; Mendoza-Pérez, J.A.; Calderón-Domínguez, G.; Alamilla-<br />
Beltrán, L.; Gutierrez-López, G.F. Chapter 16: Image processing methods<br />
and fractal analysis for quantitative evaluation <strong>of</strong> size, shape, structure<br />
and microstructure in food materials. Food Engineering Integrated<br />
Approaches. Food Engineering Series 2008. Edited by Gustavo F.<br />
Gutierrez-López, Gustavo V. Barbosa-Cánovas, Jorge Welti-Chanes,<br />
Efrén Parada-Arias. Springer. Pp. 277-285.<br />
4. Ortega-Rivas, E. Bulk properties <strong>of</strong> food particle materials: an appraisal<br />
<strong>of</strong> their characterisation and relevance in processing. Food Bioprocess<br />
<strong>Technology</strong> 2009, 2, 28-44.<br />
5. Bhandari, B. Chapter 9: <strong>Spray</strong> <strong>Drying</strong> and Powder properties in Food<br />
<strong>Drying</strong> Science and <strong>Technology</strong> 2008. Edited by Hui, Y.H., Clary, C.,<br />
Farid, M.M., Fasina, O.O., Noomhorm, A., Welti-Chanes, J. DEStech<br />
Publications, Inc. 215-248.<br />
6. Reh, C.; Bhat, S.N.; Berrut, S. Determination <strong>of</strong> water content in<br />
powdered milk. Analytical, Nutritional and Clinical Methods. Food<br />
Chemistry 2004, 86(3), 457-464.<br />
7. Barbosa-Cánovas, G. V.; Ortega-Rivas, E.; Juliano, P.; Yan, H. Food<br />
Powders: physical properties, processing, and functionality. Food<br />
Engineering Series 2005.<br />
8. Alvarado, J. de D.; Aguilera, J.M. ”Métodos para medir propiedades<br />
físicas en industrias de alimentos: tamaño y forma de partículas,<br />
Propiedades físicas de los alimentos en polvo”. Zaragoza, España. 2001,<br />
P.p. 29-47, 135-147.<br />
9. Barbosa-Cánovas, G.V.;Juliano, P. Physical and chemical properties <strong>of</strong><br />
food powders in Encapsulated and powdered foods 2005. Edited by C.<br />
Onwulata. CRC Taylor and Francis. 39-71.<br />
10. Nijdam, J.J.; Langrish, T.A.G. An investigation <strong>of</strong> milk powders produced<br />
by a Laboratory –scale spray dryer. <strong>Drying</strong> <strong>Technology</strong> 2005. 23, 1043-<br />
1056.<br />
11. Niro, 2005. Method No. A2a, A2b, A3a, A5a, A7a y A6a. Niro Analytical<br />
Methods. [En Línea] Disponible:<br />
12. Shittu, T.A.; Lawal, M.O. Factors affecting instant properties <strong>of</strong> powdered<br />
cocoa beverages. Elsevier Food Chemistry 2007, 100, 91-98.<br />
13. Turchiuli, C.; Eloualia, Z.; El Mansouri, N.; Dumoulin, E. Fluidised bed<br />
agglomeration: Agglomerates shape and end-use properties. Powder<br />
<strong>Technology</strong> 2005, 157, 168-175.<br />
14. Kyaw Hla, P.; Hogekamp, S. Wetting behaviour <strong>of</strong> instantinez cocoa<br />
beverage powders. International Journal <strong>of</strong> Food Science and <strong>Technology</strong><br />
1999, 34, 335-342.<br />
15. Pietsch, W. Readily engineer agglomerates with special properties from<br />
micro- and nanosized particles. Chemical Engineering Progress 1999, 8,<br />
67–81.<br />
Perea-Flores et al. – Microstructure and rehydration properties 216
16. Aguilera, J.M.; Stanley, D.W.; Baker, K.W. New dimensions in<br />
microstructure <strong>of</strong> food products.Trends in Food Science and <strong>Technology</strong><br />
2000, 11, 3-9.<br />
17. Holgate, J.H.; Webb, J. Microscopy: Light Microscopy and Histochemical<br />
Methods. Encyclopedia <strong>of</strong> Food Sciences and Nutrition 2003, Ten-Volume<br />
Set. ACADEMIC PRESS. ISBN 13: 978-0-12-227055-0. Pp. 3917-3922.<br />
18. Aguilera, J.M.; Chiralt, A.; Fito, P. Food dehydration and product<br />
structure.Trends in Food Science and <strong>Technology</strong> 2003.14, 432-437.<br />
19. Schoonman, A.; Mayor, G.; Dillmann, M.L.; Bisperink, C.; Ubbink, J. The<br />
microstructure <strong>of</strong> foamed maltodextrin/sodium caseinate powders: a<br />
comparative study by microscopy and physical techniques, Food<br />
Research International 2001, 34(1), 913-929.<br />
20. Witek, M.; Weglarz, W.P.; De Jong, L.; van Dalen, G.; Blonk, J.C.G.;<br />
Heussen, P.; Van Velzen, E.; Van As, H.; van Duynhoven, J. The<br />
structural and hydration properties <strong>of</strong> heat-treated rice studied at multiple<br />
length scales. Food Chemistry 2010, 120, 1031-1040.<br />
21. James, B.J.; Smith, B.G. Surface structure and composition <strong>of</strong> fresh and<br />
bllmed chocolate analysed using X-ray photoelectron spectroscopy, cryoscanning<br />
electron microscopy and environmental scanning electron<br />
microscopy. LWT-Food Science and <strong>Technology</strong> 2009, 42, 929-937.<br />
22. James, B. Advances in “wet” electron microscopy techniques and their<br />
application to the study <strong>of</strong> food structure. Trends in Food Science and<br />
<strong>Technology</strong> 2009, 20, 114-124.<br />
23. Amos, W.B.; White, J.G. How the Confocal Laser Scannig Microscope<br />
entered Biological Research. Biology <strong>of</strong> the Cell 2003, 95, 335-342.<br />
24. Wirth, R. Focused Ion Beam (FIB) combined with SEM and TEM:<br />
Advanced analytical tools for studies <strong>of</strong> chemical composition,<br />
microstructure and crystal structure in geomaterials on a nanometre scale.<br />
Chemical Geology 2009, 261(3-4), 217-229.<br />
25. Abramowitz, M.; Davidson, M. W. “Introduction to Microscopy".Molecular<br />
Expressions. Retrieved. 2007, Pp. 08-22.<br />
26. Aguilera, J.M.; Stanley, D.W. Chapter 1: Examining Food Microstructure.<br />
In Microstructural Principles <strong>of</strong> Food Processing and Engineering 1999.<br />
2a. Edition. An ASPEN Publication.pp. 1-70.<br />
27. Autio, K.; Salmenkallio-Marttila, M. Light microscopic investigations <strong>of</strong><br />
cereal grains dough’s and breads. LWT 2001, 34, 18-22.<br />
28. Schreier, H.W.; Garcia, D.; Sutton, M.A. Advances in Light Microscope<br />
Stereo Vision. Experimental Mechanics 2004, 44(3), 278-288.<br />
29. Liao, W.-H.; Aggarwal, S.J.; Aggarwal, J.K. The reconstruction <strong>of</strong><br />
dynamic 3D structure <strong>of</strong> biological objects using stereo microscope<br />
images. Machine Vision and Applications 1997, 9, 166-178.<br />
30. Dürrenberger, M.B.; Handschin, S.; Conde-Petit, B.; Escher, F.<br />
Visualization <strong>of</strong> Food Structure by Confocal Laser Scanning Microscopy<br />
(CLSM). LWT 2001, 34, 11-17.<br />
31. Cox, G. Biological confocal microscopy. Materials today 2002. 34-41.<br />
32. Paddock, S.W. Principles and practices <strong>of</strong> Laser Scanning Confocal<br />
Microscopy. Molecular Biotechnology 2000, 16, 127-149.<br />
33. Aguilera, J.M.; Stanley, D.W. Chapter 10: The microstructural approach.<br />
In Microstructural Principles <strong>of</strong> Food Processing and Engineering 1999.<br />
2a. Edition. An ASPEN Publication.pp. 413-423.<br />
34. Blonk, J.C.G.; van Aalst, H. Confocal scanning light microscopy in food<br />
research. Food Research International 1993, 26, 297-311.<br />
Perea-Flores et al. – Microstructure and rehydration properties 217
35. Peighambardoust, S.H.; Dadpour, M.R.; Dokouhaki, M. Application <strong>of</strong><br />
epifluorescence light microscopy (EFLM) to study the microstructure <strong>of</strong><br />
wheat dough: a comparison with confocal scanning laser microscopy<br />
(CSLM) technique. Journal <strong>of</strong> Cereal Science 2010, 51, 21-27.<br />
36. Aguilera, J.M.; Stanley, D.W. Chapter 9: The microstructural approach. In<br />
Microstructural Principles <strong>of</strong> Food Processing and Engineering 1999. 2a.<br />
Edition. An ASPEN Publication.pp. 373-397.<br />
37. Stokes, D.J. Recent advances in electron imaging, image interpretation<br />
and applications: environmental scanning electron microscopy.<br />
Philosophical Transactions <strong>of</strong> The Royal Society Londre A. 2003, 361,<br />
2771-2787.<br />
38. Pedreschi, F.; Mery, D.; Aguilera, J. M. Classification <strong>of</strong> Potato Chips<br />
Using Pattern Recognition.Journal <strong>of</strong> Food Science 2004, 69, E264-E270.<br />
39. Castelman K. 1996. Digital image processing. Englewood Cliffs, N. J.:<br />
Prentice Hall. p.667.<br />
40. Du, C.; Sun, D. Recent developments in the applications <strong>of</strong> image<br />
processing techniques for food quality evaluation, Trends in Food Science<br />
and <strong>Technology</strong> 2004, 15(1), 230–249.<br />
41. Pérez-Nieto Antonio.; Chanona-Pérez Jorge.; Farrera-Rebollo Reynold.;<br />
Gutiérrez-López Gustavo.; Calderón-Domínguez Georgina. Image<br />
analysis <strong>of</strong> structural changes in dough during baking. LWT - Food<br />
Science and <strong>Technology</strong> 2010, 43, 535–543.<br />
42. Haralick, R.; Shanmugam, K.; Dinstein, I. Textural Features for Image<br />
Classification. IEEE Transactions on Systems, Man, and Cybernetics<br />
1973, 3, No.6.<br />
43. AOAC. Official Methods <strong>of</strong> Analysis. 16th Edn. Arlington Virginia:<br />
Association <strong>of</strong> Official Analytical Chemists International 1995, 32.1.02.<br />
44. Chen, W.S.; Yuan, S.Y.; Hsieh, C.M. Two algorithms to estimate fractal.<br />
Optical engineering 2003, 42, 2452-2464.<br />
45. Olsen, E.R.; Ramsey, R.D.; Winn, D.S. A modified fractal dimension as a<br />
measure <strong>of</strong> landscape diversity. Photogrammetric engineering and<br />
remote sensing 1993, 59, 1517-1520.<br />
Perea-Flores et al. – Microstructure and rehydration properties 218
Index<br />
A<br />
Acai pulp, 123<br />
Activation energy, 191<br />
Adhesion, 49, 64<br />
Aerosil, 129<br />
Aerodynamics, 165<br />
Aggloemration enhancement, 41<br />
Airflow simulation, 3<br />
Plug flow, 65<br />
Steady, 4, 22<br />
Transient, 4, 7, 25<br />
Amorphous, 70<br />
Angle<br />
Slide, 51<br />
Repose, 51<br />
Arrhenius, 191<br />
Ascorbic acid, 64<br />
Atomization, 80<br />
Primary, 92<br />
Secondary, 93<br />
Axisymmetric, 7<br />
B<br />
Basset force, 86<br />
BEM, 80<br />
BET, 45<br />
Binary<br />
Collision, 96<br />
Droplet, 97<br />
Bioavailability<br />
Retention, 132, 162<br />
Body force, 86<br />
Bovine serum albumin, 162<br />
Break-up model, 96<br />
Non-linear, 94<br />
Buchi, 62<br />
Bulk density, 48<br />
C<br />
Caking, 116<br />
Carotenoids, 136<br />
Carrageenan, 128<br />
Ceramics, 164<br />
Magnesia, 164<br />
Characteristic drying curve, 70<br />
Cheese, 140<br />
Clausius-Clapeyron, 89<br />
Coalescense, 97<br />
Co-current flow, 184<br />
Cohesion, 49<br />
Colorant, 136<br />
Computational fluid dynamics, 2<br />
Convergence strategy, 5<br />
Optimization, 27<br />
Particle parcel, 12<br />
Residual pattern, 6<br />
Sub-models, 2<br />
Validation, 19<br />
Conservation equation, 85<br />
Corn syrup, 121<br />
Counter-current flow, 184<br />
Crust formation, 40<br />
Crystalline, 70<br />
Crystallization<br />
Growth, 72<br />
Impact, 71<br />
Moisture-temperature, 64<br />
Nucleation, 72<br />
Solid phase, 62<br />
Yield, 65<br />
Cyclodextrin, 134<br />
D<br />
Decomposition, 122<br />
Density<br />
Packed, 200<br />
Bulk, 47, 200<br />
Solid, 46<br />
Particle, 47<br />
Deposition<br />
Buildup, 18<br />
Experimental data, 21<br />
Modelling, 16<br />
219
Diameter change correlation, 194<br />
Diffusivity, 68, 168<br />
Dispersibility, 118<br />
Dispersion index, 44, 57<br />
DMTA, 17<br />
Drag force, 86<br />
Drag coefficient, 87<br />
Droplet<br />
Collision regime, 97<br />
Collision grazing, 100<br />
Evaporation, 89<br />
Trajectory, 9, 86<br />
<strong>Drying</strong><br />
Aids, 120<br />
Droplet, 86, 191<br />
Kinetics, 191<br />
Primary stage, 167<br />
Secondary stage, 174<br />
E<br />
Eddy, 10, 90<br />
Lengthscale, 91<br />
Lifetime, 90<br />
Egg, 139<br />
Emulsifier, 133<br />
Encapsulation<br />
Micro, 132<br />
Wall material, 133<br />
Retention efficiency, 135<br />
Enthalpy, 185<br />
Humid air, 69, 185<br />
Essential oils, 132,137<br />
Equilibrium moisture, 42<br />
Eulerian, 80<br />
F<br />
Fast fourier transform, 20<br />
Fats, 133<br />
Film properties, 89<br />
Flavors, 132, 137<br />
Flow development, 4<br />
Flowability, 49, 117<br />
Design tool, 183<br />
FLUENT, 4<br />
Fluid bed, 39<br />
Vibro, 38<br />
Food, 113<br />
Fruit juices, 122<br />
Fruit pulps, 122, 125<br />
Fractal dimension, 198<br />
Frozen<br />
Particle, 168<br />
Water, 168<br />
G<br />
GAB, 193<br />
Gaussian distribution, 84<br />
Glass transition, 71<br />
Molecular mobility, 118<br />
Rehydration, 119<br />
Glucose, 121<br />
Gordon-Taylor, 71<br />
Gum arabic, 120<br />
H<br />
Hausner ratio, 51<br />
Heat<br />
Transfer coefficient, 191<br />
Balance, 189<br />
Evaporation, 69<br />
Herbal extract, 113, 131<br />
Hibiscus extract, 71<br />
Hollow particles, 38<br />
Hotwire anemometer, 20<br />
Humidity<br />
Measurement, 21<br />
Micro separator, 21<br />
Hygroscopicity, 123<br />
I<br />
Ice saturation, 168<br />
Image analysis, 206<br />
Immersibility, 52<br />
Inhaled powder, 165<br />
220
Therapeutic, 166<br />
Inclusion complexes, 135<br />
Isotherm, 43, 193<br />
Desorption, 43<br />
Sorption, 43<br />
J<br />
Jenike flow index, 50<br />
Jet feedback mechanism, 5<br />
K<br />
Kelvin-Helmoltz, 85<br />
L<br />
Lactose, 71<br />
Lagrangian, 9, 81<br />
Loading, 81<br />
Laser doppler anemometry, 20<br />
Lime juice, 124<br />
Log-normal distribution, 44<br />
LSM, 80<br />
M<br />
Maltodextrin, 120<br />
Mass<br />
Balance, 189<br />
Transfer coefficient, 69, 191<br />
Microscopy technique, 202<br />
Light, 203<br />
Stereo, 203<br />
Confocal, 205<br />
SEM, 206<br />
Microspheres, 132<br />
Milk<br />
Skim, 52<br />
Whole, 41<br />
Powder, 209<br />
Moisture content, 42<br />
Momentum balance, 190<br />
Multiphase flow, 79<br />
Multiscale modelling, 79<br />
Small scale. 80<br />
N<br />
Nozzle<br />
Two-fluid, 160<br />
Pressure, 160<br />
Ultrasonic, 161<br />
<strong>Spray</strong> angle, 196<br />
Nukiyama-Tanasawa, 84<br />
Nusselt number, 69, 191<br />
Nutraceuticals, 127<br />
O<br />
Ohnesorge number, 106<br />
Oleoresins, 132<br />
One-dimensional model<br />
Diameter estimation, 194<br />
Implementation, 190<br />
Overall balance, 187<br />
Safety factor, 195<br />
P<br />
Parallel flow design, 65<br />
Partial pressure, 191<br />
Particle<br />
Agglomeration, 38, 116<br />
Deceleration, 194<br />
Interaction, 19, 97<br />
Morphology, 42<br />
Oscillation frequency, 95<br />
Oscillation relaxation, 95<br />
Shape, 117, 200<br />
Size distribution, 84, 198<br />
Stochastic tracking, 9, 91<br />
Steady tracking, 13<br />
Transient tracking, 13<br />
Particle-Source-In-Cell, 9<br />
Particle-wall impact, 104<br />
Bouncing, 105<br />
Collision, 96<br />
Satelite model, 102<br />
Splashing, 106<br />
Surface roughness, 107<br />
Pharmaceutics, 157<br />
221
Phenolic compounds, 114<br />
Phytochemicals, 127<br />
Porosity, 46<br />
Powder<br />
Collection, 161, 184<br />
Formation, 40<br />
Prandtl number, 69<br />
Probability density function, 82<br />
Freeze drying, 157<br />
Product shipping, 116<br />
Properties<br />
Instant, 116<br />
Physical, 41<br />
Proteins, 65<br />
Hydrolysate, 139<br />
Q<br />
Quality<br />
Changes, 118<br />
Factorial designs, 54<br />
Optimization, 52<br />
R<br />
Random walk, 10<br />
RANS, 82<br />
Ranz-Marshal, 191<br />
Rayleigh linear jet breakup, 102<br />
Rayleigh-Taylor, 85<br />
Reaction engineering approach, 191<br />
Reconstitution, 198<br />
Rehydration, 201<br />
Test method, 201<br />
Residence time, 188<br />
Response surface method, 54<br />
Factorial designs, 54<br />
Central composite designs, 56<br />
Box Behnken, 56<br />
Rosin Rammler, 84<br />
Rotating disk / atomizer, 160<br />
RSM, 8<br />
S<br />
Saccharides, 120<br />
Saffman lift, 86<br />
Scaling <strong>of</strong> dryer length, 183<br />
SEM, 44, 206<br />
Environmental, 212, 213, 214<br />
Sherwood number, 86, 191<br />
Shrinkage, 191<br />
Silicone dioxide, 123<br />
Sinkability, 118<br />
Smoke visualization, 20<br />
Sphericity, 200<br />
<strong>Spray</strong>-freeze-drying, 162<br />
Drug encapsulation, 163<br />
Excipients, 162<br />
Spaulding number, 88<br />
Spouted bed, 130<br />
<strong>Spray</strong> application, 78<br />
<strong>Spray</strong> dryer<br />
Cooling, 29<br />
Components, 39<br />
Horizontal, 29<br />
Multi stage, 39<br />
Post operation, 185<br />
Single stage, 39<br />
Starches, 120, 133<br />
Stickiness, 49<br />
Barrier, 65<br />
Criterion, 16<br />
Stochastic separated flow, 85<br />
Stoke’s law, 165<br />
Solubility, 52, 118<br />
Sublimation, 162<br />
Sucrose, 71, 136<br />
Swirl<br />
Rotating atomizer induced, 26<br />
T<br />
Taylor analogy breakup, 96<br />
TEM, 45<br />
Thermal conductivity, 171<br />
Thermosensitive materials, 163<br />
222
Thin skin model, 86<br />
Turbulence, 8, 90<br />
Correlation, 90<br />
k-ε, 90<br />
RNG, 8<br />
Timescale, 91<br />
V<br />
Van der Waals, 49<br />
Velocity<br />
Fluctuation, 91<br />
Pr<strong>of</strong>ile, 20<br />
Very-large-eddy-simulation, 7<br />
Viscoelasticity, 17<br />
Volatile compounds, 163<br />
Volume averaging theory, 167<br />
Volume-<strong>of</strong>-fluid (VOF), 80<br />
W<br />
Water activity, 42<br />
Weber number, 99<br />
Wet core, 39<br />
Wettability, 118<br />
Whey, 141<br />
William-Landel-Ferry, 62<br />
Y<br />
Yield locus curve, 50<br />
223
<strong>Spray</strong> drying is a ubiquitous industrial operation found in numerous industries. It<br />
is employed to produce engineered powders from liquid feedstocks in a single<br />
step. This book compiles the latest development in the spray drying area. In this<br />
first edition, two aspects <strong>of</strong> Computational Fluid Dynamic (CFD) modeling <strong>of</strong><br />
spray dryers were covered. The chapters include an overview in undertaking<br />
such an analysis while a latter chapter focuses on the particle behaviour<br />
modellng in CFD. Apart from modeling, several chapters are included in this first<br />
edition focusing on the manipulation <strong>of</strong> particle properties. Discussion is given<br />
on suitable approaches in controlling the physical properties <strong>of</strong> particles. In<br />
particular a chapter was devoted introducing the concept <strong>of</strong> in-situ particle<br />
crystallization control in spray dryers. In the application <strong>of</strong> the spray drying<br />
process, chapters were included discussing on the control <strong>of</strong> encapsulation in<br />
the spray drying <strong>of</strong> herbal extracts and in the extension <strong>of</strong> the process to sprayfreeze-drying<br />
which <strong>of</strong>fers a great potential for product quality manipulation.<br />
Meng Wai Woo<br />
Meng Wai Woo is currently a Research Fellow and a half-time Lecturer <strong>of</strong><br />
Chemical Engineering in Monash <strong>University</strong>, Clayton. His research interest is in<br />
spray drying and the fouling phenomenon. Within the area <strong>of</strong> spray drying, he is<br />
looking at droplet evaporation, particle formation or interaction phenomena and<br />
the functionality <strong>of</strong> particles. Apart from that, he also has experience in<br />
Computational Fluid Dynamics analysis <strong>of</strong> the spray drying process.<br />
Arun Sadashiv Mujumdar<br />
Dr. Mujumdar, the world-renowned “<strong>Drying</strong> Guru”, is Pr<strong>of</strong>essor <strong>of</strong> Mechanical<br />
Engineering at <strong>National</strong> <strong>University</strong> <strong>of</strong> <strong>Singapore</strong>. Winner <strong>of</strong> numerous prestigious<br />
awards and honors, Pr<strong>of</strong>. Mujumdar has published over 400 refereed papers and<br />
over 100 book chapters in heat-mass transfer and drying. Founder <strong>of</strong> the<br />
International <strong>Drying</strong> Symposium (IDS) series, he is Editor-in-Chief <strong>of</strong> the archival<br />
journal <strong>Drying</strong> <strong>Technology</strong> (Taylor & Francis) since 1988 and is also the Editor <strong>of</strong><br />
over 60 books including the widely acclaimed Handbook <strong>of</strong> Industrial <strong>Drying</strong><br />
(CRC Press) now in third edition.<br />
Wan Ramli Wan Daud<br />
Wan Ramli Wan Daud is a Pr<strong>of</strong>essor <strong>of</strong> Chemical Engineering at the Department<br />
<strong>of</strong> Chemical & Process Engineering, <strong>National</strong> <strong>University</strong> <strong>of</strong> Malaysia. His<br />
research interest is in the area <strong>of</strong> spray drying, food drying and particulate drying<br />
with fluidized beds. Recently, he was awarded the prestigious Outstanding<br />
Contribution to the <strong>Drying</strong> Community 2009 Award at the 6th Asia-Pacific <strong>Drying</strong><br />
Conference, 19-21 October 2009 in Bangkok. Wan Ramli is also a specialist in<br />
the area <strong>of</strong> Fuel Cell <strong>Technology</strong>. He is the Founding Director <strong>of</strong> The Fuel Cell<br />
Institute, <strong>National</strong> <strong>University</strong> <strong>of</strong> Malaysia.<br />
ISBN: 978-981-08-6270-1