The synthesis of methanol from glycerol derived syngas - ITM
The synthesis of methanol from glycerol derived syngas - ITM
The synthesis of methanol from glycerol derived syngas - ITM

Create successful ePaper yourself
Turn your PDF publications into a flip-book with our unique Google optimized e-Paper software.
Chemical Engineering Journal 207–208 (2012) 245–253<br />
Contents lists available at SciVerse ScienceDirect<br />
Chemical Engineering Journal<br />
journal homepage: www.elsevier.com/locate/cej<br />
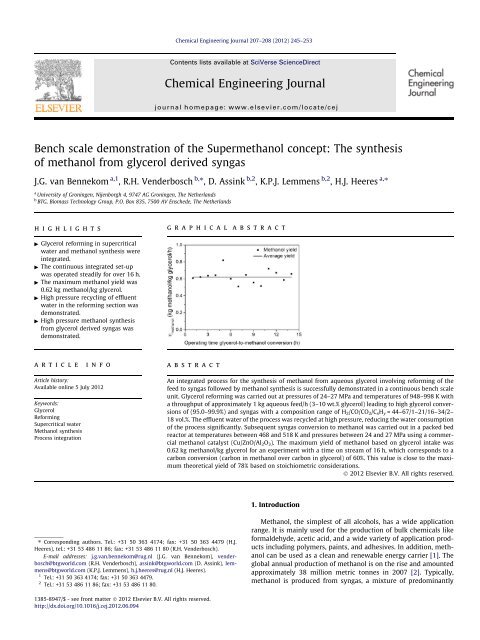
Bench scale demonstration <strong>of</strong> the Super<strong>methanol</strong> concept: <strong>The</strong> <strong>synthesis</strong><br />
<strong>of</strong> <strong>methanol</strong> <strong>from</strong> <strong>glycerol</strong> <strong>derived</strong> <strong>syngas</strong><br />
J.G. van Bennekom a,1 , R.H. Venderbosch b,⇑ , D. Assink b,2 , K.P.J. Lemmens b,2 , H.J. Heeres a,⇑<br />
a University <strong>of</strong> Groningen, Nijenborgh 4, 9747 AG Groningen, <strong>The</strong> Netherlands<br />
b BTG, Biomass Technology Group, P.O. Box 835, 7500 AV Enschede, <strong>The</strong> Netherlands<br />
highlights<br />
" Glycerol reforming in supercritical<br />
water and <strong>methanol</strong> <strong>synthesis</strong> were<br />
integrated.<br />
" <strong>The</strong> continuous integrated set-up<br />
was operated steadily for over 16 h.<br />
" <strong>The</strong> maximum <strong>methanol</strong> yield was<br />
0.62 kg <strong>methanol</strong>/kg <strong>glycerol</strong>.<br />
" High pressure recycling <strong>of</strong> effluent<br />
water in the reforming section was<br />
demonstrated.<br />
" High pressure <strong>methanol</strong> <strong>synthesis</strong><br />
<strong>from</strong> <strong>glycerol</strong> <strong>derived</strong> <strong>syngas</strong> was<br />
demonstrated.<br />
graphical<br />
abstract<br />
article<br />
info<br />
abstract<br />
Article history:<br />
Available online 5 July 2012<br />
Keywords:<br />
Glycerol<br />
Reforming<br />
Supercritical water<br />
Methanol <strong>synthesis</strong><br />
Process integration<br />
An integrated process for the <strong>synthesis</strong> <strong>of</strong> <strong>methanol</strong> <strong>from</strong> aqueous <strong>glycerol</strong> involving reforming <strong>of</strong> the<br />
feed to <strong>syngas</strong> followed by <strong>methanol</strong> <strong>synthesis</strong> is successfully demonstrated in a continuous bench scale<br />
unit. Glycerol reforming was carried out at pressures <strong>of</strong> 24–27 MPa and temperatures <strong>of</strong> 948–998 K with<br />
a throughput <strong>of</strong> approximately 1 kg aqueous feed/h (3–10 wt.% <strong>glycerol</strong>) leading to high <strong>glycerol</strong> conversions<br />
<strong>of</strong> (95.0–99.9%) and <strong>syngas</strong> with a composition range <strong>of</strong> H 2 /CO/CO 2 /C x H y = 44–67/1–21/16–34/2–<br />
18 vol.%. <strong>The</strong> effluent water <strong>of</strong> the process was recycled at high pressure, reducing the water consumption<br />
<strong>of</strong> the process significantly. Subsequent <strong>syngas</strong> conversion to <strong>methanol</strong> was carried out in a packed bed<br />
reactor at temperatures between 468 and 518 K and pressures between 24 and 27 MPa using a commercial<br />
<strong>methanol</strong> catalyst (Cu/ZnO/Al 2 O 3 ). <strong>The</strong> maximum yield <strong>of</strong> <strong>methanol</strong> based on <strong>glycerol</strong> intake was<br />
0.62 kg <strong>methanol</strong>/kg <strong>glycerol</strong> for an experiment with a time on stream <strong>of</strong> 16 h, which corresponds to a<br />
carbon conversion (carbon in <strong>methanol</strong> over carbon in <strong>glycerol</strong>) <strong>of</strong> 60%. This value is close to the maximum<br />
theoretical yield <strong>of</strong> 78% based on stoichiometric considerations.<br />
Ó 2012 Elsevier B.V. All rights reserved.<br />
1. Introduction<br />
⇑ Corresponding authors. Tel.: +31 50 363 4174; fax: +31 50 363 4479 (H.J.<br />
Heeres), tel.: +31 53 486 11 86; fax: +31 53 486 11 80 (R.H. Venderbosch).<br />
E-mail addresses: j.g.van.bennekom@rug.nl (J.G. van Bennekom), venderbosch@btgworld.com<br />
(R.H. Venderbosch), assink@btgworld.com (D. Assink), lemmens@btgworld.com<br />
(K.P.J. Lemmens), h.j.heeres@rug.nl (H.J. Heeres).<br />
1 Tel.: +31 50 363 4174; fax: +31 50 363 4479.<br />
2 Tel.: +31 53 486 11 86; fax: +31 53 486 11 80.<br />
Methanol, the simplest <strong>of</strong> all alcohols, has a wide application<br />
range. It is mainly used for the production <strong>of</strong> bulk chemicals like<br />
formaldehyde, acetic acid, and a wide variety <strong>of</strong> application products<br />
including polymers, paints, and adhesives. In addition, <strong>methanol</strong><br />
can be used as a clean and renewable energy carrier [1]. <strong>The</strong><br />
global annual production <strong>of</strong> <strong>methanol</strong> is on the rise and amounted<br />
approximately 38 million metric tonnes in 2007 [2]. Typically,<br />
<strong>methanol</strong> is produced <strong>from</strong> <strong>syngas</strong>, a mixture <strong>of</strong> predominantly<br />
1385-8947/$ - see front matter Ó 2012 Elsevier B.V. All rights reserved.<br />
http://dx.doi.org/10.1016/j.cej.2012.06.094
246 J.G. van Bennekom et al. / Chemical Engineering Journal 207–208 (2012) 245–253<br />
H 2 , CO, and minor quantities <strong>of</strong> CO 2 and CH 4 . Methanol is commercially<br />
produced mainly in gas–solid catalytic reactors and involves<br />
three equilibrium reactions, viz.: hydrogenation <strong>of</strong> CO (Eq. (1)),<br />
hydrogenation <strong>of</strong> CO 2 (Eq. (2)), and the water–gas shift (WGS)<br />
reaction (Eq. (3)) [3]:<br />
CO þ 2H 2 ¢ CH 3 OH DH 298 ¼ 90:64 kJ=mol ð1Þ<br />
CO 2 þ 3H 2 ¢ CH 3 OH þ H 2 O DH 298 ¼ 49:47 kJ=mol ð2Þ<br />
CO þ H 2 O ¢ CO 2 þ H 2 DH 298 ¼ 41:17 kJ=mol ð3Þ<br />
<strong>The</strong> stoichiometric ratio (S N ) <strong>of</strong> the <strong>syngas</strong> is defined as [4]:<br />
S N ¼ ðH 2 CO 2 Þ<br />
ðCO þ CO 2 Þ<br />
ð4Þ<br />
With S N equal to 2, all reactants can be converted to <strong>methanol</strong>. For<br />
S N >2,CO+CO 2 are the limiting components, while for S N 22.1 MPa). This is particularly advantageous for the subsequent<br />
<strong>methanol</strong> <strong>synthesis</strong>. At higher pressures the chemical equilibria, as<br />
given in Eqs. (1)–(3), favor the reaction products, <strong>methanol</strong> and<br />
water, and high conversions (up to 98%, depending on gas composition,<br />
temperature, and pressure) can be obtained in a single reactor<br />
pass. In Fig. 1 the equilibrium conversions for conventional <strong>methanol</strong><br />
<strong>synthesis</strong>, BASF’s high pressure <strong>methanol</strong> <strong>synthesis</strong> (1920–1960)<br />
and the current work at relevant process conditions are given [4].<br />
Even more advantageously, conversions can be higher than expected<br />
purely based on gas phase equilibria, as at high pressure<br />
and ‘low’ temperature (f.i. 20–25 MPa and 473 K) a liquid <strong>methanol</strong><br />
phase is formed. This was demonstrated recently experimentally in<br />
a view cell and supported by experimental and modelling studies<br />
[25,26]. At certain process conditions and <strong>syngas</strong> compositions,<br />
equilibrium conversions <strong>of</strong> CO + CO 2 can exceed 99.5%. Thus, a<br />
combination <strong>of</strong> the RSCW <strong>of</strong> a suitable biomass resource for high<br />
pressure <strong>syngas</strong> production followed by <strong>methanol</strong> <strong>synthesis</strong> may<br />
have advantages compared to gasification and low pressure <strong>methanol</strong><br />
<strong>synthesis</strong> concepts.<br />
In this paper an experimental demonstration <strong>of</strong> the integration<br />
<strong>of</strong> the RSCW <strong>of</strong> <strong>glycerol</strong> (a model biomass resource) and <strong>methanol</strong><br />
<strong>synthesis</strong> in a dedicated continuous bench scale unit is presented<br />
aiming at maximizing the <strong>methanol</strong> yield per kg <strong>of</strong> <strong>glycerol</strong>. <strong>The</strong><br />
performance <strong>of</strong> the process in terms <strong>of</strong> <strong>glycerol</strong> conversion, <strong>methanol</strong><br />
yield, and carbon balances will be evaluated and discussed<br />
and strong and weak points <strong>of</strong> the concept are addressed. <strong>The</strong><br />
use <strong>of</strong> recycling the effluent water in the reformer section at high<br />
pressure is demonstrated which has, to the authors knowledge,<br />
not been shown before and is an absolute novelty <strong>of</strong> this paper.<br />
2. <strong>The</strong>oretical considerations<br />
<strong>The</strong> ideal <strong>syngas</strong> for <strong>methanol</strong> <strong>synthesis</strong> has an S N <strong>of</strong> 2 (see Eq.<br />
(4)). However, even if <strong>glycerol</strong> decomposes solely in H 2 , CO, and
J.G. van Bennekom et al. / Chemical Engineering Journal 207–208 (2012) 245–253 247<br />
CO 2 the maximum S N is 1.33, and this value is not affected by the<br />
progress <strong>of</strong> the WGS reaction. This is illustrated in Eqs. (5) and (6).<br />
In Eq. (5), <strong>glycerol</strong> decomposition into <strong>syngas</strong> including the reversible<br />
WGS reaction is given. <strong>The</strong> <strong>syngas</strong> composition at equilibrium,<br />
expressed in terms <strong>of</strong> x, is a function <strong>of</strong> the temperature and the<br />
water concentration.<br />
þxH 2 O<br />
C 3 H 8 O 3 ƒ ƒ! ð3 xÞCO þð4 þ xÞH2 þ xCO 2 ð5Þ<br />
Application <strong>of</strong> the definition for S N and introduction <strong>of</strong> gas phase<br />
compositions in terms <strong>of</strong> x, see Eq. (6), confirms that the S N value<br />
is 1.33 at most and independent <strong>of</strong> the progress <strong>of</strong> the WGS<br />
reaction:<br />
S N ¼ ðH 2 CO 2 Þ<br />
ðCO þ CO 2 Þ ¼ ð4 þ x xÞ<br />
ð3 x þ xÞ ¼ 4 3<br />
<strong>The</strong> S N value, though, can be increased by the addition <strong>of</strong> H 2 to,<br />
or removal <strong>of</strong> CO 2 <strong>from</strong> the <strong>syngas</strong>.<br />
To obtain the highest <strong>methanol</strong> yield per kg <strong>glycerol</strong>, <strong>glycerol</strong><br />
reforming followed by <strong>syngas</strong> conversion should proceed according<br />
to the stoichiometry as shown in Eq. (7). Glycerol is selectively<br />
converted to H 2 , CO and CO 2 . Subsequently, all H 2 and CO react to<br />
<strong>methanol</strong> while the CO 2 remains.<br />
3C 3 H 8 O 3 þ 2H 2 O ! 7CO þ 14H 2 þ 2CO 2 ! 7CH 3 OH þ 2CO 2<br />
In this case, 2.33 mol carbon/mole <strong>glycerol</strong> end up in <strong>methanol</strong><br />
(77.8% on carbon basis or 0.81 kg <strong>methanol</strong>/kg <strong>glycerol</strong> on weight<br />
basis), which is the absolute theoretical maximum. Actual yields<br />
will be lower due to the fact that both <strong>glycerol</strong> reforming and <strong>methanol</strong><br />
<strong>synthesis</strong> involve equilibrium reactions and the occurrence <strong>of</strong><br />
other reactions like the formation <strong>of</strong> higher hydrocarbons and higher<br />
alcohols (HA) and methanation (see Eq. (8)).<br />
CO þ 3H 2 ¢ CH 4 þ H 2 O<br />
To gain insights in the effect <strong>of</strong> the equilibria on process performance<br />
theoretical yields including equilibria were determined.<br />
<strong>The</strong> chemical equilibria involved in <strong>glycerol</strong> reforming (Eqs. (3)<br />
and (8)) as a function <strong>of</strong> process conditions were calculated by solving<br />
a set <strong>of</strong> equations using theoretical equilibrium constants [27].<br />
<strong>The</strong> equilibria in <strong>methanol</strong> <strong>synthesis</strong> including liquid formation<br />
were calculated with a more sophisticated model [25]. In the model<br />
a set <strong>of</strong> equations was solved accounting for the chemical equilibria<br />
(theoretical equilibrium constants), phase equilibria (fugacity <strong>of</strong> the<br />
vapor phase is equal to the fugacity <strong>of</strong> the liquid phase), and conservation<br />
<strong>of</strong> mass with a non-negativity constraint.<br />
<strong>The</strong> model for <strong>glycerol</strong> reforming predicts that a <strong>syngas</strong> with an<br />
S N <strong>of</strong> 0.85 (H 2 /CO/CO 2 /CH 4 = 58.0/2.1/30.4/9.5 vol.%) is obtained<br />
when a 10 wt.% <strong>glycerol</strong> feed is reformed at 973 K, 24 MPa. In the<br />
subsequent <strong>methanol</strong> <strong>synthesis</strong> at 24 MPa and 473 K, the equilibrium<br />
model predicts the presence <strong>of</strong> a dew point and thus the formation<br />
<strong>of</strong> a liquid phase [25]. <strong>The</strong> carbon conversion (carbon in<br />
<strong>methanol</strong> over carbon in <strong>glycerol</strong>) is 44% which is equal to<br />
0.46 kg <strong>methanol</strong>/kg <strong>glycerol</strong>. This yield is substantially lower than<br />
the theoretical maximum based on Eq. (7) (0.81 kg <strong>methanol</strong>/kg<br />
<strong>glycerol</strong>) and this lower yield is caused mainly by the formation<br />
<strong>of</strong> CH 4 in the reforming step, at the expense <strong>of</strong> H 2 and CO. CH 4 is<br />
inert in <strong>methanol</strong> <strong>synthesis</strong> and its formation increases the H 2 deficiency<br />
<strong>of</strong> the gas mixture.<br />
3. Materials and methods<br />
3.1. Materials<br />
Glycerol (purity >99%) was supplied by Chemproha, <strong>The</strong> Netherlands.<br />
Deionized water was used with a conductivity below 3 lS/<br />
cm. In some reforming experiments (exp.) a Ni/CaO–6Al 2 O 3 catalyst<br />
ð6Þ<br />
ð7Þ<br />
ð8Þ<br />
was used. <strong>The</strong> preparation procedure and properties <strong>of</strong> this catalyst<br />
are described in a previous publication by the present authors [28].<br />
<strong>The</strong> catalyst is known to promote the decomposition <strong>of</strong> <strong>glycerol</strong>,<br />
reforming <strong>of</strong> higher hydrocarbons, and methanation. A commercial<br />
Cu/ZnO/Al 2 O 3 catalyst was used for <strong>methanol</strong> <strong>synthesis</strong>.<br />
3.2. Set-up description<br />
<strong>The</strong> set-up consisted <strong>of</strong> a reformer section, a high pressure gas–<br />
liquid separator and a subsequent <strong>methanol</strong> <strong>synthesis</strong> reactor system.<br />
An extensive description <strong>of</strong> the reformer section <strong>of</strong> the set-up<br />
is published elsewhere [27]. A schematic flow sheet <strong>of</strong> the set-up is<br />
given in Fig. 2. <strong>The</strong> reformer section was operated in continuous<br />
mode with a throughput <strong>of</strong> 1 L aqueous feed/h. Glycerol and water<br />
were introduced to the system <strong>from</strong> feed containers F1 or F2<br />
through a pump and subsequently reformed in five reforming reactors<br />
(R1–R5) in series. <strong>The</strong> temperature in each reactor can be adjusted<br />
individually. <strong>The</strong> set-up contained in situ separation <strong>of</strong> the<br />
water and gas phase after the reformer section in a high pressure<br />
separator (HPS). <strong>The</strong> liquid phase in the HPS, can either be depressurized<br />
and transferred to a low pressure separator (LPS) or recycled<br />
via a recycle pump. In the former operating mode (using the<br />
LPS), the gases dissolved in the aqueous liquid phase were released,<br />
quantified (Gallus G1.6 gas meter) and analyzed (gas chromatography,<br />
GC). In the latter operation mode (recycle mode) the gases remained<br />
dissolved and <strong>glycerol</strong> feed was injected in the recycle<br />
stream before the first reforming reactor (R1). If required all<br />
reforming reactors can easily be filled with catalyst. <strong>The</strong> <strong>glycerol</strong><br />
feed concentration was typically between 3 and 10 wt.%, the pressure<br />
around 24–27 MPa, the temperature <strong>of</strong> the reformer section<br />
between 948 and 998 K and the residence time ranged <strong>from</strong> 30<br />
to 35 s.<br />
<strong>The</strong> gas phase <strong>from</strong> the HPS was directly fed to the <strong>methanol</strong><br />
<strong>synthesis</strong> section without upgrading or selective removal <strong>of</strong> components.<br />
In one experiment external H 2 was added via the gas<br />
booster.<br />
<strong>The</strong> <strong>methanol</strong> section contained three tubular packed bed reactors<br />
(P1–P3, each L = 500 mm, ID = 10 mm) surrounded by heating<br />
jackets. A heating/cooling medium was flown through the heating<br />
jacket to control the temperature in the reactors. Temperatures<br />
were recorded at 4 positions inside the packed bed P2 (at locations<br />
2–30 cm <strong>from</strong> the entrance) and at the exit <strong>of</strong> packed bed reactor<br />
P2 and P3. Two or three <strong>of</strong> the tubular reactors were filled with catalyst<br />
particles (1 < d p < 3 mm). <strong>The</strong> mixture <strong>of</strong> <strong>methanol</strong>, water and<br />
unconverted gases <strong>from</strong> the last packed bed (P3) was cooled (cooler<br />
C2) using tap water, depressurized and cooled (cooler C3) to<br />
temperatures below 263 K to trap all condensables. Liquid samples<br />
were collected in a vessel and unconverted gas was quantified<br />
(Gallus G1.6 gas meter) and analyzed by GC. <strong>The</strong> <strong>methanol</strong> <strong>synthesis</strong><br />
reactors were operated at temperatures between 468 and 518 K<br />
and at similar pressure as the reformer section. Several process<br />
parameters were logged during operations. <strong>The</strong> locations are indicated<br />
with letters in bold in Fig. 2. <strong>The</strong> process pressure was the<br />
average <strong>of</strong> A 1-3 , the temperature <strong>of</strong> reactor R5 (T R5 ) was measured<br />
at B at the end <strong>of</strong> reactor R5, the <strong>glycerol</strong> feed flow at C, the gas<br />
flow <strong>of</strong> the HPS and LPS at D 1 and D 2 respectively, the temperature<br />
at the end <strong>of</strong> the <strong>methanol</strong> <strong>synthesis</strong> bed at E, the amount <strong>of</strong> liquid<br />
product at F, and the unconverted gas flow at G.<br />
3.3. Product analyses<br />
<strong>The</strong> gas composition <strong>of</strong> the <strong>of</strong>f gas <strong>from</strong> the reforming process<br />
and <strong>methanol</strong> <strong>synthesis</strong> was analyzed using an online dual-column<br />
gas chromatograph (GC 955, Syntech Spectras) equipped with<br />
thermal conductivity detectors. CO was analyzed and quantified<br />
using a molsieve 5 Å column (L = 1.6 m) with He as carrier gas.
248 J.G. van Bennekom et al. / Chemical Engineering Journal 207–208 (2012) 245–253<br />
Fig. 2. Flow sheet <strong>of</strong> the integrated <strong>glycerol</strong>-to-<strong>methanol</strong> set-up. <strong>The</strong> left part <strong>of</strong> the figure is the reformer section <strong>of</strong> the process and the right part is the <strong>methanol</strong> <strong>synthesis</strong><br />
section. HPS and LPS refer to high pressure separator and low pressure separator respectively. F = feed container, C = cooler, P = packed bed reactor. <strong>The</strong> bold capital letters<br />
correspond to the locations where relevant process parameters were measured.<br />
CH 4 ,CO 2 , and C 2+ were analyzed on a Chromosorb 102 column<br />
(L = 1.6 m) with He as carrier gas. H 2 was analyzed on the molsieve<br />
column using Ar as carrier gas. <strong>The</strong> total organic carbon (TOC) content<br />
<strong>of</strong> the effluent water <strong>from</strong> the RSCW process was analyzed<br />
using a TOC analyzer (TOC-V CSN , Shimadzu). Before the TOC measurement,<br />
the effluent sample was diluted appropriately to obtain<br />
values within the measuring range <strong>of</strong> the apparatus. <strong>The</strong> water<br />
content <strong>of</strong> the <strong>methanol</strong> was determined by Karl Fischer-titration.<br />
<strong>The</strong> composition <strong>of</strong> the organics in the liquid phase after the <strong>methanol</strong><br />
<strong>synthesis</strong> reactor was determined with a GC (HP 5890 series<br />
II) equipped with a flame ionization detector (FID) over a Restek<br />
RTX-1701 column (L =60m, ID = 0.25 mm) coupled with a mass<br />
spectrometer (MS, HP 5972 series). <strong>The</strong> FID was used for the quantification<br />
<strong>of</strong> the components and the MS for the identification <strong>of</strong><br />
the components. <strong>The</strong> FID was calibrated for the main constituents<br />
<strong>of</strong> the organic fraction: <strong>methanol</strong>, ethanol, 1-propanol, 2-propanol,<br />
1-butanol, 2-butanol, 1-pentanol, 2-methyl-1-propanol, 2-methyl-<br />
1-butanol.<br />
3.4. Experimental program for experiments in the integrated set-up<br />
A total <strong>of</strong> nine experiments were performed aiming at increasing<br />
the <strong>methanol</strong> yield. An overview <strong>of</strong> the experiments is presented<br />
in Table 1 and a short resume is given below.<br />
<strong>The</strong> first two experiments were conducted using the LPS without<br />
recycling the effluent water. Part <strong>of</strong> the gas produced is lost<br />
as it dissolves in the water that leaves the process. In the second<br />
experiment external H 2 is added between the reformer section<br />
and the <strong>methanol</strong> <strong>synthesis</strong> reactors. As H 2 is the limiting component<br />
the S N <strong>of</strong> the gas can be improved and thus the carbon conversion<br />
to <strong>methanol</strong>.<br />
In exp. 3–6 the effluent water <strong>from</strong> the reformer is recycled<br />
after the HPS. Operating with a recycle stream at high pressure<br />
in RSCW is a unique feature. As a consequence <strong>of</strong> the recycle<br />
stream no gas is lost in the reformer section through the LPS and<br />
additionally, the water consumption <strong>of</strong> the process can be reduced<br />
significantly. In these experiments the <strong>glycerol</strong> reforming is carried<br />
Table 1<br />
Overview <strong>of</strong> experiments in the integrated unit.<br />
Exp. Catalyst (g) Recycle Catalyst (g) Remarks<br />
R3 R4 R5 P1 P2 P3<br />
1 – – – – – 50 51 –<br />
2a/2b – – – – – 50 51 H 2 added after reformer section<br />
3a/3b 10 10 3 yes – 50 51 Ni/CaO–6Al 2 O 3 used in reformer section<br />
4 10 10 3 yes – 50 51 Ni/CaO–6Al 2 O 3 used in reformer section<br />
5 10 10 3 yes – 50 51 Ni/CaO–6Al 2 O 3 used in reformer section<br />
6–1 10 10 3 yes 51 50 51 Ni/CaO–6Al 2 O 3 used in reformer, P1–P3 at different T’s<br />
6–2 a 10 10 3 yes 51 50 51 Ni/CaO–6Al 2 O 3 used in reformer, P1–P3 at different T’s<br />
a<br />
<strong>The</strong> catalyst in the reforming section was replaced by fresh catalyst.
J.G. van Bennekom et al. / Chemical Engineering Journal 207–208 (2012) 245–253 249<br />
out catalytically by using a CH 4 reforming catalyst (Ni/CaO–6Al 2 O 3 )<br />
in combination with higher temperatures. All C 2+ hydrocarbons<br />
can be reformed and the CH 4 equilibrium concentration decreases<br />
(with higher temperatures) yielding a more favorable gas composition<br />
[28].<br />
Finally, in exp. 6 an extra <strong>methanol</strong> <strong>synthesis</strong> packed bed (P1) is<br />
added to achieve equilibrium gas phase conditions at the outlet<br />
and the <strong>methanol</strong> section now consists <strong>of</strong> 3 packed bed reactors<br />
(P1–P3) in series. <strong>The</strong> 3 packed beds were operated at different<br />
temperatures, viz. ±518 K (P1), ±503 K (P2), and 481–482 K (P3).<br />
<strong>The</strong> reaction rate in <strong>methanol</strong> <strong>synthesis</strong> depends strongly on temperature.<br />
Higher temperatures lead to higher reaction rates. In the<br />
first packed bed (P1) the reaction rate will be relatively high while<br />
the second (P2) and third (P3) are used to achieve equilibrium.<br />
3.5. Definitions<br />
<strong>The</strong> conversion <strong>of</strong> <strong>glycerol</strong> to gas (f gly ) in the reformer is defined<br />
as the difference between the molar carbon flow <strong>of</strong> <strong>glycerol</strong> in the<br />
feed and the molar carbon flow <strong>of</strong> the effluent (/ C,gly / C,effluent )<br />
over the molar carbon flow <strong>of</strong> <strong>glycerol</strong> in the feed (/ C,gly ):<br />
/ C;effluent<br />
f gly ¼ / C;gly<br />
100% ð9Þ<br />
/ C;gly<br />
<strong>The</strong> overall carbon conversion to <strong>methanol</strong> (f C ) in the integrated<br />
unit is the molar carbon flow in <strong>methanol</strong> (/ c,MeOH ) over the molar<br />
carbon flow <strong>of</strong> <strong>glycerol</strong> in the feed.<br />
f C ¼ / C;MeOH<br />
/ C;gly<br />
100% ð10Þ<br />
<strong>The</strong> <strong>methanol</strong> yield (g) is the mass flow <strong>of</strong> <strong>methanol</strong> (/ MeOH )<br />
produced over the mass flow <strong>of</strong> <strong>glycerol</strong> (/ gly ) fed.<br />
g ¼ / MeOH<br />
/ gly<br />
ð11Þ<br />
<strong>The</strong> conversion <strong>of</strong> gas component i (f i ) in <strong>methanol</strong> <strong>synthesis</strong> is<br />
defined as the molar conversion rate (/ i,in / i,<strong>of</strong>f ) over the molar<br />
flow <strong>of</strong> component i originally present (/ i,in ) after <strong>glycerol</strong><br />
reforming.<br />
/ i;<strong>of</strong>f<br />
f i ¼ / i;in<br />
100% ð12Þ<br />
/ i;in<br />
<strong>The</strong> energetic efficiency (higher heating value, HHV) is defined<br />
as:<br />
g HHV<br />
¼ HHV MeOH<br />
HHV gly<br />
g 100%: ð13Þ<br />
4. Results<br />
A total <strong>of</strong> nine experiments were performed in the integrated<br />
continuous bench scale unit. Process conditions were varied, the<br />
use <strong>of</strong> a catalyst in the reformer section was evaluated, recycle <strong>of</strong><br />
the liquid effluent <strong>of</strong> the HPS was assessed and the addition <strong>of</strong><br />
external H 2 was investigated with the primary objective to achieve<br />
high <strong>methanol</strong> yields. This requires proper operating conditions for<br />
each reactor section (reformer, <strong>methanol</strong> <strong>synthesis</strong>) to limit<br />
byproduct formation (e.g. CH 4 , higher hydrocarbons, and HA) and<br />
to allow operation at high equilibrium conversions in <strong>methanol</strong><br />
<strong>synthesis</strong>. An overview <strong>of</strong> the experiments is presented in Table 1.<br />
In this section, both the results for the overall integrated process<br />
will be discussed as well as the results for the reformer section<br />
in these experiments. Typical run times for the experiments were<br />
6–10 h and steady state was reached in approximately 2 h.<br />
4.1. Reformer performance<br />
Typical conditions for the reformer section (see Fig. 2) were 24–<br />
27 MPa and 948–998 K. At these conditions the residence times <strong>of</strong><br />
the reformer section (R1–R5) were in the range <strong>of</strong> 30–35 s. <strong>The</strong><br />
composition and quantity <strong>of</strong> the <strong>of</strong>f gas were analyzed to determine<br />
the carbon balance. <strong>The</strong> hydrocarbon concentration in the<br />
<strong>of</strong>f gas is the summation <strong>of</strong> the concentrations <strong>of</strong> CH 4 and C 2 H 6 .<br />
<strong>The</strong> <strong>glycerol</strong> conversion was determined based on the quantity <strong>of</strong><br />
carbon in the effluent water (see Eq. (9)). <strong>The</strong> main results <strong>of</strong> the<br />
<strong>glycerol</strong> reformer section are summarized in Table 2. <strong>The</strong> locations<br />
given in the last row <strong>of</strong> the table correspond to the position in the<br />
experimental set-up where the parameters were measured,<br />
marked with bold capital letters in Fig. 2.<br />
Carbon balance closure for the reformer is very satisfactorily<br />
and was between 95 and 104%. <strong>The</strong> <strong>glycerol</strong> conversion was almost<br />
complete for all experiments, which is in line with previous work<br />
[27,28]. <strong>The</strong> <strong>syngas</strong> produced had the following composition<br />
range: H 2 /CO/CO 2 /C x H y = 44–67/1–21/16–34/2–18 vol.%. <strong>The</strong> results<br />
for each experiment will be discussed separately in the following<br />
section. Exp. 1 is selected as base case and the results <strong>of</strong><br />
the other experiments will be compared to this experiment.<br />
4.1.1. Base case<br />
Exp. 1 was conducted with a <strong>glycerol</strong> feed concentration <strong>of</strong><br />
10 wt.%. <strong>The</strong> set-up was operated without a catalyst in the reformer<br />
section and in a once through mode. Part <strong>of</strong> the gas (ca.<br />
13%) dissolves in the effluent stream <strong>from</strong> the LPS (see Fig. 2)<br />
and is not used for the subsequent <strong>methanol</strong> <strong>synthesis</strong>. <strong>The</strong> product<br />
gas has a relatively low S N value <strong>of</strong> 0.74, which is mainly caused<br />
Table 2<br />
Reforming results (before <strong>methanol</strong> <strong>synthesis</strong>).<br />
Exp. P (MPa) T R5 (K) / gly (g/h) Glycerol con. (wt.%) / v (NL/h) H 2 (vol.%) CO (vol.%) CO 2 (vol.%) C x H y (vol.%) S N (–) f gly (%) C bal (%)<br />
1 HPS 27 ± 1 948 106 10.4 97 44.3 21.2 16.5 18.1 0.74 96.2 a 95.8<br />
1 LPS 14 21.9 8.4 62.0 7.7 –<br />
2 c HPS 27 ± 1 948 112 10.4 191 67.3 10.2 11.0 11.6 2.66 95.0 a 102.7<br />
2 c LPS 11 15.1 4.4 74.9 5.5 –<br />
3 HPS 24 ± 1 998 97 ±10 151 54.9 1.6 32.5 11.0 0.66 99.9 b 97.1<br />
4 HPS 24 ± 1 998 35 ±4 65 59.4 1.1 33.5 6.0 0.75 99.9 b 103.7<br />
5 HPS 24 ± 1 998 38 ±4 70 61.4 1.1 32.1 5.3 0.88 99.9 b 99.0<br />
6–1 HPS 26 ± 1 998 34 ±3 60 59.7 1.0 32.2 7.1 0.83 99.9 b 101.1<br />
6–2 HPS 26 ± 1 998 35 ±4 71 66.4 1.3 30.0 2.4 1.17 99.9 b 94.8<br />
Loc. e A 1-3 B C<br />
d<br />
D 1 /D 2<br />
a<br />
Based on carbon content in the effluent water.<br />
b Experiment conducted in recycle mode. Glycerol conversion is estimated based on previous work [28].<br />
c External H 2 is co-fed after the reforming process, the composition provided is after H 2 addition.<br />
d D 1 for the HPS gas and D 2 for the LPS gas.<br />
e Locations where the parameters were measured (see Fig. 7.2).
250 J.G. van Bennekom et al. / Chemical Engineering Journal 207–208 (2012) 245–253<br />
by the formation <strong>of</strong> hydrocarbons (18.1 vol.% with approximately<br />
2/3 CH 4 and 1/3 C 2 H 6 ).<br />
4.1.2. Exp. 2–6<br />
Exp. 2 was conducted at the same conditions as the base case.<br />
<strong>The</strong> only difference is that approximately 100 NL/h <strong>of</strong> external H 2<br />
was added to the <strong>syngas</strong> after the reformer section. <strong>The</strong> gas composition,<br />
given in Table 2, is the gas composition <strong>of</strong> the reformer gas<br />
including the additional H 2 . <strong>The</strong> S N <strong>of</strong> the gas increased to 2.66. <strong>The</strong><br />
ratio between CO, CO 2 , and CH 4 changed slightly in comparison<br />
with the base case, which can be due to the H 2 addition or some<br />
scattering in the experimental data. <strong>The</strong> hydrocarbon concentration<br />
is still high and the gas flow has almost doubled.<br />
In exp. 3, a different approach was followed to increase the S N<br />
compared to the base case. To avoid the addition <strong>of</strong> external (fossil<br />
<strong>derived</strong>) H 2 , the hydrocarbon content had to be reduced. A Ni/CaO–<br />
6Al 2 O 3 catalyst was used to reform the higher hydrocarbons and to<br />
promote <strong>glycerol</strong> decomposition, but besides these two reactions<br />
the WGS reaction was promoted as well [28]. <strong>The</strong> temperature<br />
was slightly increased compared to the base case to have a more<br />
advantageous equilibrium composition (less CH 4 ) and the effluent<br />
water was recycled at high pressure. Recycling the effluent water<br />
drastically reduces the water consumption <strong>of</strong> the process and the<br />
recycle flow was adjusted in such a way that the reactor inlet flow<br />
was comparable to the inlet flow in the base case. Compared to the<br />
base case no gas was lost through the effluent stream <strong>from</strong> the LPS.<br />
<strong>The</strong> gas composition obtained over this catalyst differed substantially<br />
<strong>from</strong> the base case. <strong>The</strong> CO concentration was reduced <strong>from</strong><br />
21 vol.% to 1–2 vol.% and the concentration <strong>of</strong> the hydrocarbons<br />
was significantly lower and approached equilibrium (C 2 H 6 =0<br />
vol.% and CH 4 11 vol.%). <strong>The</strong> S N value was slightly lower than<br />
the base case due to a small increase in the CO 2 concentration.<br />
In exp. 4–6-1 the <strong>glycerol</strong> feed concentration was reduced to<br />
4 wt.%. <strong>The</strong> H 2 and CO 2 concentration increased compared to the<br />
base case, whereas the CO and hydrocarbon concentration were<br />
lower, resulting in slightly more attractive S N values <strong>of</strong> 0.75–0.88.<br />
<strong>The</strong> higher hydrocarbon content increased <strong>from</strong> exp. 5 to exp. 6–<br />
1 which indicated a decrease in the higher hydrocarbon reforming<br />
performance <strong>of</strong> the catalyst. <strong>The</strong>refore, in exp 6.2, a fresh reforming<br />
catalyst was used leading to the lowest hydrocarbon concentration<br />
and the highest H 2 concentration <strong>of</strong> all experiments. For instance,<br />
C 2 H 6 , which accounted for 1/3 <strong>of</strong> the hydrocarbon content in the<br />
base case, could not be detected in the product gas. <strong>The</strong> S N increased<br />
to 1.17 which is close to the theoretical maximum <strong>of</strong><br />
1.33 (Eq. (6)).<br />
4.2. Performance <strong>of</strong> the integrated process<br />
<strong>The</strong> results for the integrated process, including <strong>methanol</strong> <strong>synthesis</strong>,<br />
are presented in Table 3. For some experiments <strong>methanol</strong><br />
<strong>synthesis</strong> was operated at two different temperatures. <strong>The</strong>se<br />
experiments are marked as, e.g. 2a and 2b. <strong>The</strong> equilibria in <strong>methanol</strong><br />
<strong>synthesis</strong> were calculated with the data <strong>from</strong> Table 2 as input<br />
and, if applicable, condensation <strong>of</strong> <strong>methanol</strong> was accounted for in<br />
the equilibrium calculations [25]. <strong>The</strong> equilibrium data should be<br />
considered with some care, because the results are based on the<br />
assumption <strong>of</strong> constant gas composition and gas flow <strong>from</strong> the reformer<br />
section. As for the reforming experiments, all <strong>methanol</strong><br />
<strong>synthesis</strong> experiments have good closures <strong>of</strong> the carbon balance<br />
(93–100%), particularly when regarding the complexity <strong>of</strong> the integrated<br />
process. A detailed summary <strong>of</strong> the experimental results <strong>of</strong><br />
the integrated process is given below. As in section 4.1, exp. 1 is<br />
considered as base case and the results <strong>of</strong> the other experiments<br />
are compared to this experiment.<br />
4.2.1. Base case<br />
In exp. 1, the <strong>methanol</strong> <strong>synthesis</strong> reactors were operated at<br />
468 K. Hydrocarbons are inert in <strong>methanol</strong> <strong>synthesis</strong> and their concentration<br />
increased strongly in the <strong>of</strong>f gas <strong>of</strong> the <strong>methanol</strong> <strong>synthesis</strong><br />
reactor to over 50 vol.%. <strong>The</strong> H 2 and CO concentration were 3<br />
and 2 vol.%, respectively. <strong>The</strong> CO 2 concentration increased compared<br />
to the gas composition <strong>from</strong> the reformer, as mainly CO<br />
was converted to <strong>methanol</strong>. <strong>The</strong> gas composition and liquid yield<br />
at the exit <strong>of</strong> the <strong>methanol</strong> reactor were close to equilibrium, with<br />
the liquid yield slightly lower and experimental conversion slightly<br />
higher than equilibrium. <strong>The</strong> overall carbon conversion was 26%<br />
which is equal to a <strong>methanol</strong> yield <strong>of</strong> 0.27 kg <strong>methanol</strong>/kg <strong>glycerol</strong>.<br />
Table 3<br />
Results <strong>of</strong> <strong>methanol</strong> <strong>synthesis</strong> <strong>from</strong> <strong>glycerol</strong>-<strong>derived</strong> <strong>syngas</strong>.<br />
Exp.<br />
T<br />
(K)<br />
/ gly<br />
(g/h)<br />
/ v,<strong>of</strong>f<br />
(NL/h)<br />
H 2<br />
(vol.%)<br />
CO<br />
(vol.%)<br />
CO 2<br />
(vol.%)<br />
C x H y<br />
(vol.%)<br />
L. yield a<br />
(g/h)<br />
g (kg MeOH/kg<br />
<strong>glycerol</strong>)<br />
1 468 106.1 37.1 3.3 2.2 43.6 50.9 28.9 0.27 98.9 1.1 57.5 97.4 25.8 94.6<br />
Equi 468 – 35.6 4.8 2.1 43.7 49.6 29.7 0.28 98.5 1.5 59.3 96.4 28.0 –<br />
2a c 468 112.2 136.6 67.3 2.9 13.3 16.4 31.9 0.25 87.2 12.8 49.7 34.4 23.8 98.4<br />
Equi 468 – 49.5 55.0 0.0 0.4 44.6 74.7 0.52 77.5 22.5 99.5 80.5 49.1 –<br />
2b c 518 111.7 88.9 65.8 0.3 6.9 26.9 56.1 0.40 80.3 19.7 81.0 58.3 38.6 98.1<br />
Equi 518 – 71.5 61.0 0.6 7.6 30.9 62.5 0.45 79.8 20.2 86.9 68.9 43.1 –<br />
3a 498 96.7 82.5 41.6 0.4 40.0 18.1 41.3 0.29 67.0 33.0 35.4 58.8 27.4 96.2<br />
Equi 498 – 60.7 25.5 0.7 46.1 27.6 50.5 0.35 66.1 33.9 44.9 81.4 33.1 –<br />
3b 518 96.5 67.3 34.4 0.4 42.6 22.5 56.8 0.39 65.8 34.2 43.8 72.2 37.1 100.0<br />
Equi 518 – 72.8 33.7 1.2 42.1 23.0 43.7 0.30 65.9 34.1 38.8 70.5 28.6 –<br />
4 483 35.3 33.9 48.9 0.6 39.9 10.7 14.4 0.27 65.4 34.6 39.0 57.0 25.5 93.2<br />
Equi 483 – 16.8 15.1 0.6 61.1 23.2 27.0 0.50 65.2 34.8 53.9 93.4 47.7 –<br />
5 493 37.7 22.5 37.9 0.4 44.9 16.8 27.1 0.47 65.3 34.7 56.0 80.0 44.9 96.8<br />
Equi 493 – 16.9 20.4 0.8 57.7 21.2 29.3 0.51 65.2 34.8 57.2 91.9 48.5 –<br />
6–1 482 33.9 12.5 15.7 0.3 53.4 30.6 28.3 0.55 66.1 33.9 66.4 94.5 52.8 95.5<br />
Equi 482 – 15.0 13.2 0.5 57.1 29.1 25.9 0.50 65.1 34.9 56.5 94.5 47.6 –<br />
6–2 481 35.0 10.9 20.0 0.3 59.5 20.2 33.4 0.62 65.1 34.9 70.5 95.4 59.6 93.8<br />
Equi 481 – 9.5 10.8 0.6 69.6 19.0 34.7 0.65 65.3 34.7 70.0 97.8 62.1 –<br />
Loc. d E C G – – – – F – – – – – – –<br />
a<br />
b<br />
Yield <strong>of</strong> liquid products.<br />
<strong>The</strong> liquid phase is assumed to consist <strong>of</strong> water and <strong>methanol</strong>. <strong>The</strong> concentration here is calculated by 100 wt.% – (water concentration). <strong>The</strong> exact composition <strong>of</strong> the<br />
organic phase is given in Table 4.<br />
c External H 2 is added to the reforming gas.<br />
d Locations where the parameters were measured (see Fig. 2).<br />
MeOH b<br />
(wt.%)<br />
H 2 O<br />
(wt.%)<br />
f CO+CO2<br />
(%)<br />
f H2<br />
(%)<br />
f C<br />
(%)<br />
C bal<br />
(%)
J.G. van Bennekom et al. / Chemical Engineering Journal 207–208 (2012) 245–253 251<br />
<strong>The</strong> conversion <strong>of</strong> 26% is the highest conversion possible with such<br />
a <strong>syngas</strong> composition.<br />
4.2.2. Exp. 2–6<br />
In exp. 2 the S N was increased by the addition <strong>of</strong> external H 2 and<br />
the feed gas flow for the <strong>methanol</strong> <strong>synthesis</strong> section doubled.<br />
Methanol <strong>synthesis</strong> was operated at 468 K (exp. 2a) and 518 K<br />
(exp 2b). In exp. 2a the residence time <strong>of</strong> the packed bed reactor<br />
was too short at these low temperatures to achieve gas phase equilibrium<br />
and the carbon conversion and <strong>methanol</strong> yield were similar<br />
as in the base case. In contrast to the base case, the gas<br />
composition remained far <strong>from</strong> equilibrium, which is mainly visible<br />
in the low conversion <strong>of</strong> CO 2 and the low water content <strong>of</strong><br />
the liquid product. For this situation the addition <strong>of</strong> H 2 is not<br />
recommendable.<br />
In exp. 2b, the reactor temperature was increased to achieve<br />
equilibrium and to obtain higher yields. <strong>The</strong> carbon conversion became<br />
closer to the equilibrium values (f C = 39% vs. 43% at equilibrium)<br />
and the <strong>of</strong>f gas composition was closer to equilibrium,<br />
though equilibrium was not yet attained. Approximately 81%<br />
(equilibrium = 87%) <strong>of</strong> the carbon oxides present in the gas phase<br />
was converted to <strong>methanol</strong> and a <strong>methanol</strong> yield <strong>of</strong> 0.40 kg <strong>methanol</strong>/kg<br />
<strong>glycerol</strong> was obtained, which is significantly higher than<br />
the base case, but at the cost <strong>of</strong> the addition <strong>of</strong> external H 2 .<br />
In exp. 3, the gas composition after reforming is significantly<br />
different as for the base case. Almost all CO is converted to CO 2 .<br />
From literature, it is known that <strong>methanol</strong> can be successfully<br />
synthesized solely <strong>from</strong> CO 2 [29–32]. Methanol <strong>synthesis</strong> was<br />
operated at 498 K (exp. 3a) en 518 (exp. 3b). <strong>The</strong> carbon conversion<br />
and <strong>methanol</strong> yield in exp. 3a were below equilibrium and similar<br />
to the base case, although the composition <strong>of</strong> the feed gas was<br />
completely different. Nonetheless, based on equilibria higher conversions<br />
are possible in exp. 3a. Increasing the temperature (exp.<br />
3b) led to higher carbon conversion and <strong>methanol</strong> yields (f C = 37,<br />
g = 0.39 kg <strong>methanol</strong>/kg <strong>glycerol</strong>) than the base case. <strong>The</strong> conversions<br />
and yields are slightly higher than the predicted equilibrium<br />
values due to technical issues leading to some extra <strong>methanol</strong> release<br />
<strong>from</strong> the system.<br />
To obtain significant higher conversions than the base case, the<br />
temperature <strong>of</strong> the <strong>methanol</strong> <strong>synthesis</strong> reactors was reduced in<br />
combination with a reduction <strong>of</strong> the flow rate and the hydrocarbon<br />
content <strong>of</strong> the feed gas. <strong>The</strong> latter two targets were realized jointly<br />
by reducing the feed concentration with a factor <strong>of</strong> almost 3. In<br />
exp. 4, <strong>methanol</strong> <strong>synthesis</strong> was operated at 483 K. <strong>The</strong> carbon conversion<br />
and <strong>methanol</strong> yield were comparable to the base case, but<br />
remained far <strong>from</strong> equilibrium. A slight increase in the packed bed<br />
temperature <strong>of</strong> 10 K (exp. 5) resulted in a significant increase in the<br />
carbon conversion to 45% (g = 0.47 kg <strong>methanol</strong>/kg <strong>glycerol</strong>),<br />
which is significantly higher than the base case but still below<br />
equilibrium. Even though the gas flow to the packed bed was reduced,<br />
the residence time remained too short to achieve<br />
equilibrium.<br />
An increase in reactor length (exp. 6–1) and variable operating<br />
temperatures <strong>of</strong> the three packed bed reactors (P1–P3 in Fig. 2)<br />
Fig. 3. Methanol yields <strong>from</strong> <strong>glycerol</strong> and volumetric flow at the exit <strong>of</strong> the <strong>methanol</strong> reactor <strong>of</strong> the long duration experiment (A). Carbon selectivity towards <strong>methanol</strong> and<br />
CH 4 (B).<br />
Table 4<br />
Composition <strong>of</strong> the liquid phase.<br />
Exp.<br />
(–)<br />
n Liquid product Higher alcohols<br />
MeOH<br />
(wt.%)<br />
H 2 O<br />
(wt.%)<br />
HA<br />
(wt.%)<br />
Total a<br />
(wt.%)<br />
Purity b<br />
(wt.%)<br />
EtOH<br />
(wt‰)<br />
1-propanol<br />
(wt‰)<br />
2-propanol<br />
(wt‰)<br />
1-butanol<br />
(wt‰)<br />
2-butanol<br />
(wt‰)<br />
1-pentanol<br />
(wt‰)<br />
2-m-1-<br />
propanol<br />
(wt‰)<br />
1 468 97.8 1.1 0.23 99.1 99.8 1.15 0.02 0.69 0.17 0.00 0.08 0.15 0.09<br />
2a 468 87.4 12.8 0.09 100.2 99.9 0.07 0.03 0.33 0.01 0.11 0.00 0.00 0.00<br />
2b 518 80.8 19.7 0.17 100.7 99.8 0.69 0.23 0.31 0.08 0.22 0.03 0.08 0.05<br />
3a 498 66.5 33.0 0.00 99.5 99.9 0.00 0.02 0.01 0.00 0.01 0.00 0.00 0.00<br />
3b 518 65.8 34.2 0.01 100.0 99.9 0.03 0.01 0.01 0.00 0.01 0.00 0.00 0.00<br />
4 483 65.9 34.6 0.00 100.5 99.9 0.00 0.00 0.00 0.00 0.00 0.00 0.00 0.00<br />
5 493 64.6 34.7 0.00 99.3 99.9 0.00 0.00 0.00 0.00 0.00 0.00 0.00 0.00<br />
6–1 482 67.1 33.9 0.01 100.9 99.9 0.05 0.01 0.00 0.00 0.01 0.00 0.00 0.00<br />
6–2 481 65.1 34.9 0.01 100.0 99.9 0.05 0.01 0.00 0.00 0.01 0.00 0.00 0.00<br />
a<br />
b<br />
Summation <strong>of</strong> the <strong>methanol</strong>, water, and higher alcohols concentrations.<br />
Methanol content <strong>of</strong> the organic fraction.<br />
2-m-1-<br />
butanol<br />
(wt‰)
252 J.G. van Bennekom et al. / Chemical Engineering Journal 207–208 (2012) 245–253<br />
caused a significant increase in the carbon conversion to 53% which<br />
is equal to a yield <strong>of</strong> 0.55 kg <strong>methanol</strong>/kg <strong>glycerol</strong>. This carbon conversion<br />
and yield are more than double the values <strong>of</strong> the base case.<br />
4.3. Long duration experiment in the integrated unit<br />
In a long duration run (exp. 6–2, 20 h) at the same conditions as<br />
exp. 6–1, but using a fresh reforming catalyst, a considerably lower<br />
hydrocarbon concentration in the gas phase after the reformer was<br />
observed. As a consequence the corresponding carbon conversion<br />
in the <strong>methanol</strong> <strong>synthesis</strong> unit increased to 60% (g = 0.62 kg <strong>methanol</strong>/kg<br />
<strong>glycerol</strong>). Nevertheless, even higher <strong>methanol</strong> yields are<br />
possible as equilibria were not yet achieved. In the first 4 h <strong>of</strong><br />
the long duration experiment, only the reformer section was operated.<br />
Methanol <strong>synthesis</strong> was carried out over a 16 h period and<br />
the hourly liquid <strong>methanol</strong> yields and volumetric flows at the exit<br />
<strong>of</strong> the <strong>methanol</strong> <strong>synthesis</strong> unit (point G in Fig. 2) are shown in<br />
Fig. 3A. Though some scattering in the <strong>methanol</strong> yield can be noted<br />
(due to some pressure fluctuation and uncontrolled release by the<br />
back pressure valve during the experiment), the integrated system<br />
was running steadily and the <strong>methanol</strong> yield was more or less constant.<br />
<strong>The</strong> selectivity (mole carbon in product/mole carbon in <strong>glycerol</strong><br />
100%) is depicted in Fig. 3B. An average value <strong>of</strong> 8.7% <strong>of</strong> the<br />
carbon present in <strong>glycerol</strong> ends up as CH 4 and the <strong>methanol</strong> selectivity<br />
is equal to the carbon conversion and amounts 60% on average.<br />
<strong>The</strong> scattering in the <strong>methanol</strong> selectivity is similar to the<br />
scattering in the <strong>methanol</strong> yield in Fig. 3A. <strong>The</strong> selectivity towards<br />
CH 4 is also more or less constant. It seems that no deactivation or<br />
reduced activity for both the reformer section and the <strong>methanol</strong><br />
<strong>synthesis</strong> section were observed during the course <strong>of</strong> the<br />
experiment.<br />
4.4. Liquid composition after <strong>methanol</strong> <strong>synthesis</strong> reactor<br />
<strong>The</strong> composition <strong>of</strong> the liquid product after the <strong>methanol</strong> <strong>synthesis</strong><br />
reactor for all experiments is given in Table 4. <strong>The</strong> liquid<br />
phase was analyzed on <strong>methanol</strong>, water, and the eight most common<br />
HA. In general, the concentration <strong>of</strong> HA was very low<br />
(
J.G. van Bennekom et al. / Chemical Engineering Journal 207–208 (2012) 245–253 253<br />
<strong>The</strong> highest <strong>methanol</strong> yield (exp. 6.2) was 76% <strong>of</strong> the theoretical<br />
maximum (g = 0.62 vs. 0.81 kg <strong>methanol</strong>/kg <strong>glycerol</strong>). This experimental<br />
value is remarkably high, particularly when considering<br />
that in the calculation <strong>of</strong> the theoretical maximum, equilibria are<br />
not considered and the formation <strong>of</strong> reforming products other than<br />
H 2 , CO, and CO 2 (e.g. hydrocarbons) is ignored.<br />
Table 5 gives an overview <strong>of</strong> the various types <strong>of</strong> processes reported<br />
in the literature and an indication <strong>of</strong> the efficiencies. Direct<br />
comparison <strong>of</strong> the efficiencies is difficult as in most cases different<br />
assumptions and process units are considered. <strong>The</strong> efficiencies <strong>of</strong><br />
study 3 and study 5 (this work) can be compared directly as they<br />
consider only the HHV <strong>of</strong> the product and the feed without energy<br />
consumption or production. <strong>The</strong> g HHV in this work is clearly higher.<br />
For study 1 and study 2, also (part <strong>of</strong>) the energy consumption <strong>of</strong><br />
the process is taken into account resulting in lower efficiencies<br />
and yields. As such, direct comparison with our process is cumbersome.<br />
Major assumptions were made to calculate the yield and efficiency<br />
for study 4 and this value should be considered purely as<br />
indicative. <strong>The</strong> g HHV in study 5 (this work) is about a factor 2 higher.<br />
<strong>The</strong> main challenges for subsequent process research and development<br />
studies on the integrated concept proposed in this article<br />
are to be found in the reformer section. Process improvements involve<br />
heat integration, reduction <strong>of</strong> operating temperatures in the<br />
reforming section and the usage <strong>of</strong> higher <strong>glycerol</strong> feed concentrations,<br />
without lowering the quality <strong>of</strong> the <strong>syngas</strong>.<br />
6. Conclusion<br />
A successful experimental demonstration <strong>of</strong> <strong>glycerol</strong> conversion<br />
to <strong>methanol</strong> was shown by the integration <strong>of</strong> two processes. Glycerol<br />
was reformed in supercritical water to <strong>syngas</strong> and the <strong>syngas</strong><br />
was subsequently converted to <strong>methanol</strong>. <strong>The</strong> continuous set-up<br />
was modified during the experimental program to increase the<br />
<strong>methanol</strong> yields. <strong>The</strong> effluent water <strong>of</strong> the reformer section was<br />
recycled at high pressure, to reduce the water consumption <strong>of</strong><br />
the process. <strong>The</strong> highest <strong>methanol</strong> yield <strong>of</strong> 0.62 kg <strong>methanol</strong>/kg<br />
<strong>glycerol</strong> was obtained using a methanation catalyst in the reformer<br />
section and recycling <strong>of</strong> the effluent water. Glycerol was converted<br />
to mainly H 2 and CO 2 and smaller amounts <strong>of</strong> CH 4 and CO. In the<br />
most successful experiment, 60% <strong>of</strong> the carbon present in the <strong>glycerol</strong><br />
ends up in <strong>methanol</strong>. <strong>The</strong>se yields are close to the equilibrium<br />
yields and higher than experimental and case studies reported in<br />
literature. <strong>The</strong> integrated set-up was operated smoothly for more<br />
than 16 h without catalyst deactivation.<br />
Acknowledgements<br />
This research study is part <strong>of</strong> the Super<strong>methanol</strong> project and<br />
part <strong>of</strong> the data was obtained in the framework <strong>of</strong> the Superhydrogen<br />
project and the project ‘Vergassing van natte biomassa in<br />
superkritisch water’. <strong>The</strong> projects were funded by the European<br />
Commission (Superhydrogen: ENK5-2001-00555, Super<strong>methanol</strong>:<br />
No. 212180) and Agentschap NL (EOSLT05020). <strong>The</strong> initial screening<br />
for Super<strong>methanol</strong> was funded by Agentschap NL (Nos. 0268-<br />
05-04-02-011 and NEOT01008).<br />
References<br />
[1] G.A. Olah, A. Goeppert, G.K.S. Prakash, Beyond Oil and Gas: <strong>The</strong> Methanol<br />
Economy, Wiley-VCH, Weinheim, 2006.<br />
[2] M. Berggren, Methanol industry in focus, milestones (www.<strong>methanol</strong>.org),<br />
2011, (accessed 01.31.12).<br />
[3] S. Lee, Methanol Synthesis Technology, CRC Press Inc., Boca Raton, Florida,<br />
1990.<br />
[4] E. Supp, How to Produce Methanol <strong>from</strong> Coal, Springer-Verlag, Berlin, 1990.<br />
[5] A.A.C.M. Beenackers, W.P.M. van Swaaij, Methanol <strong>from</strong> wood II. Current<br />
research and development programs, Int. J. Sol. Energy 2 (1984) 487–519.<br />
[6] A.A.C.M. Beenackers, W.P.M. van Swaaij, Methanol <strong>from</strong> wood I. Process<br />
principles and technologies for producing <strong>methanol</strong> <strong>from</strong> biomass, Int. J. Sol.<br />
Energy 2 (1984) 349–367.<br />
[7] Y. Xiuli, Synthesizing <strong>methanol</strong> <strong>from</strong> biomass-<strong>derived</strong> <strong>syngas</strong>, in: Department<br />
<strong>of</strong> Mechanical Engineering, <strong>The</strong> university <strong>of</strong> Hong Kong, Hong Kong, 2005.<br />
[8] J.M. Norbeck, K. Johnson, Evaluation <strong>of</strong> a process to convert biomass to<br />
<strong>methanol</strong> fuel, in: U.S.E.P. Agency (Ed.), Cincinnati, 2000.<br />
[9] T. Ekbom, M. Lindblom, N. Berglin, P. Ahlvik, Cost-competitive, efficient<br />
bio<strong>methanol</strong> production <strong>from</strong> biomass via black liquor gasification, in:<br />
Nykomb Synergetics AB, 2003.<br />
[10] Y. Xu, T.Q. Ye, S.B. Qiu, S. Ning, F.Y. Gong, Y. Liu, Q.X. Li, High efficient<br />
conversion <strong>of</strong> CO 2 -rich bio-<strong>syngas</strong> to CO-rich bio-<strong>syngas</strong> using biomass char: a<br />
useful approach for production <strong>of</strong> bio-<strong>methanol</strong> <strong>from</strong> bio-oil, Bioresour.<br />
Technol. 102 (2011) 6239–6245.<br />
[11] Chemrec, <strong>The</strong> Bio-DME project – <strong>from</strong> wood to wheel (www.chemrec.se),<br />
2010, (accessed 02.07.12).<br />
[12] P. Salomonsson, BioDME (www.biodme.eu), 2012, (accessed date 02.07.12).<br />
[13] BioMCN, BioMCN opens largest 2nd generation bi<strong>of</strong>uel plant (www.<br />
biomcn.eu), 2010, (accessed date 01.31.12).<br />
[14] R.H. Borgwardt, Methanol production <strong>from</strong> biomass and natural gas as<br />
transporation fuel, Ind. Eng. Chem. Res. 37 (1998) 3760–3767.<br />
[15] T. Chmielniak, M. Sciazko, Co-gasification <strong>of</strong> biomass and coal for <strong>methanol</strong><br />
<strong>synthesis</strong>, Appl. Energy 74 (2002) 393–403.<br />
[16] C.N. Hamelinck, A.P.C. Faaij, Future prospects for production <strong>of</strong> <strong>methanol</strong> and<br />
hydrogen <strong>from</strong> biomass, J. Power Sources 111 (2002) 1–22.<br />
[17] H. Li, H. Hong, H. Jin, R. Cai, Analysis <strong>of</strong> a feasible polygeneration system for<br />
power and <strong>methanol</strong> production taking natural gas and biomass as materials,<br />
Appl. Energy 87 (2010) 2846–2853.<br />
[18] G.L.M.A. van Rens, G.H. Huisman, H.d. Lathouder, R.L. Cornelissen, Performance<br />
and exergy analysis <strong>of</strong> biomass-to-fuel plants producing <strong>methanol</strong>,<br />
dimethylether or hydrogen, Biomass Bioenergy 35 (2011) S145–S154.<br />
[19] J.G. van Bennekom, J. Vos, R.H. Venderbosch, M.A.P. Torres, V.A. Kirilov, H.J.<br />
Heeres, Z. Knez, M. Bork, J.M.L. Penninger, Super<strong>methanol</strong>: Reforming <strong>of</strong> crude<br />
glycerine in supercritical water to produce <strong>methanol</strong> for re-use in biodiesel<br />
plants, in: 17th European Biomass Conference and Exhibition, Hamburg, 2009,<br />
pp. 899–902.<br />
[20] P. Basu, V. Mettanant, Biomass gasification in supercritical water – a review,<br />
Int. J. Chem. Reactor Eng. 7 (2009) 1–61.<br />
[21] G. Brunner, Near critical and supercritical water. Part I. Hydrolytic and<br />
hydrothermal processes, J. Supercrit. Fluids 47 (2009) 373–381.<br />
[22] D.C. Elliot, Catalytic hydrothermal gasification <strong>of</strong> biomass, Bi<strong>of</strong>uels, Bioprod.<br />
Biorefin. 2 (2008) 254–265.<br />
[23] A. Kruse, Hydrothermal biomass gasification, J. Supercrit. Fluids 47 (2009)<br />
391–399.<br />
[24] A.A. Peterson, F. Vogel, R.P. Lachance, M. Fröling, M.J. Antal Jr., J.W. Tester,<br />
<strong>The</strong>rmochemical bi<strong>of</strong>uel production in hydrothermal media: a review <strong>of</strong> suband<br />
supercritical water technologies, Energy Environ. Sci. 1 (2008) 32–65.<br />
[25] J.G. van Bennekom, J.G.M. Winkelman, R.H. Venderbosch, S. Nieland, H.J.<br />
Heeres, Modelling and experimental studies on phase and chemical equilibria<br />
in high pressure <strong>methanol</strong> <strong>synthesis</strong>, Ind. Eng. Chem. Res. (2012), Submitted<br />
for publication.<br />
[26] J.G. van Bennekom, R.H. Venderbosch, D. Assink, K.P.J. Lemmens, J.G.M.<br />
Winkelman, E. Wilbers, H.J. Heeres, Methanol <strong>synthesis</strong> beyond chemical<br />
equilibrium, Chem. Eng. Sci. (2012), Submitted for publication.<br />
[27] J.G. van Bennekom, R.H. Venderbosch, D. Assink, H.J. Heeres, Reforming <strong>of</strong><br />
<strong>methanol</strong> and <strong>glycerol</strong> in supercritical water, J. Supercrit. Fluids 58 (2011) 99–<br />
113.<br />
[28] J.G. van Bennekom, V.A. Kirillov, Y.I. Amosov, T. Krieger, R.H. Venderbosch, D.<br />
Assink, K.P.J. Lemmens, H.J. Heeres, Explorative catalyst screening studies on<br />
reforming <strong>of</strong> <strong>glycerol</strong> in supercritical water, J. Supercrit. Fluids (2012), http://<br />
dx.doi.org/10.1016/j.supflu.2012.05.014.<br />
[29] K.G. Chanchlani, R.R. Hudgins, P.L. Silveston, Methanol <strong>synthesis</strong> form H2, CO.,<br />
and CO 2 over Cu ZnO catalysts, J. Catal. 136 (1992) 59–75.<br />
[30] H.H. Kung, G. Liu, D. Wilcox, <strong>The</strong> effect <strong>of</strong> CO 2 and H 2 O in the <strong>methanol</strong><br />
<strong>synthesis</strong> reaction on Cu–Zn–O, in: ACS fuels fall meeting, Philadelphia, 1984,<br />
pp. 194–195.<br />
[31] J. Skrzypek, M. Lachowska, D. Serafin, Methanol <strong>synthesis</strong> <strong>from</strong> CO 2 and H 2 :<br />
dependence <strong>of</strong> equilibrium conversions and exit equilibrium concentrations <strong>of</strong><br />
components on the main process variables, Chem. Eng. Sci. 45 (1990) 89–96.<br />
[32] K. Klier, V. Chatikavanij, R.G. Herman, G.W. Simmons, Catalytic <strong>synthesis</strong> <strong>of</strong><br />
<strong>methanol</strong> <strong>from</strong> CO/H 2 . IV. <strong>The</strong> effects <strong>of</strong> carbon dioxide, J. Catal. 74 (1982)<br />
343–360.<br />
[33] B. Denise, R.P.A. Sneeden, Hydrocondensation <strong>of</strong> carbon dioxide: IV, J. Mol.<br />
Catal. 17 (1982) 359–366.<br />
[34] K.J. Smith, R.B. Anderson, A chain growth scheme for the higher alcohols<br />
<strong>synthesis</strong>, J. Catal. 85 (1984) 428–436.<br />
[35] R.R. Davda, A review <strong>of</strong> catalytic issues and process conditions for renewable<br />
hydrogen and alkanes by aqueous-phase reforming <strong>of</strong> oxygenated<br />
hydrocarbons over supported metal catalysts, Appl. Catal., B 56 (2005) 171–186.<br />
[36] P. Forzatti, E. Tronconi, I. Pasquin, Higher alcohol <strong>synthesis</strong>, Catal. Rev. Sci. Eng.<br />
33 (1991) 109–168.<br />
[37] K. Raveendran, A. Ganesh, Heating value <strong>of</strong> biomass and biomass pyrolysis<br />
products, Fuel 75 (1996) 1715–1720.<br />
[38] H.S. Heo, H.J. Park, J.I. Dong, S.H. Park, S. Kim, D.J. Suh, Y.W. Suh, S.S. Kim, Y.K.<br />
Park, Fast pyrolysis <strong>of</strong> rice husk under different reaction conditions, J. Ind. Eng.<br />
Chem. 16 (2010) 27–31.