Annual Report 2010-2011 - Tourism Australia
Annual Report 2010-2011 - Tourism Australia
Annual Report 2010-2011 - Tourism Australia

You also want an ePaper? Increase the reach of your titles
YUMPU automatically turns print PDFs into web optimized ePapers that Google loves.
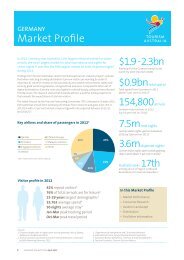
<strong>Australia</strong>’s Place in Global <strong>Tourism</strong><br />
In <strong>2010</strong>, <strong>Australia</strong> ranked 48th in the world for<br />
international visitor arrivals. However, the country<br />
ranks eighth globally for international tourism receipts<br />
and worldwide has the highest spend per trip from<br />
international visitors. This is a strong outcome and reflects<br />
the local industry’s alignment to the key performance<br />
indicators of the 2020 <strong>Tourism</strong> Industry Potential. These<br />
expenditure figures reflect visitors’ long-haul travel profile,<br />
as well as their propensity to stay longer and engage more<br />
with the destination.<br />
Although <strong>Australia</strong> is competing for international tourism<br />
with regional Asia Pacific nations, it has been a strong<br />
recipient of outbound travel from neighbouring countries,<br />
in particular China. Within the Asia Pacific region,<br />
<strong>Australia</strong>’s share of international tourist arrivals was<br />
2.9 per cent in <strong>2010</strong> and 12.1 per cent for international<br />
tourism receipts, second only after China. The importance<br />
of, and close links between, countries in the Asia Pacific<br />
region will play a critical role in achieving <strong>Australia</strong>’s 2020<br />
<strong>Tourism</strong> Industry Potential goals.<br />
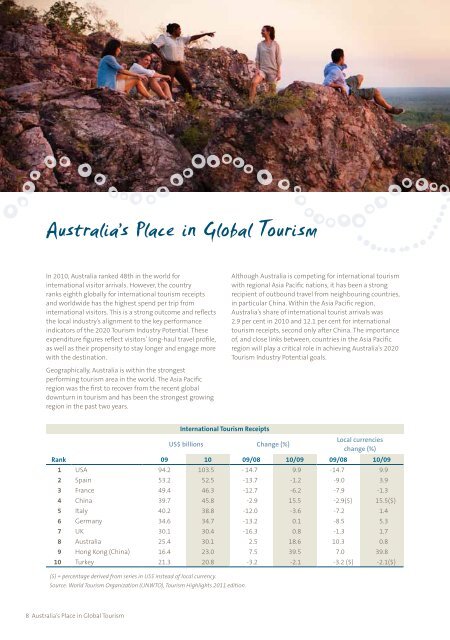
Geographically, <strong>Australia</strong> is within the strongest<br />
performing tourism area in the world. The Asia Pacific<br />
region was the first to recover from the recent global<br />
downturn in tourism and has been the strongest growing<br />
region in the past two years.<br />
International <strong>Tourism</strong> Receipts<br />
US$ billions Change (%)<br />
Local currencies<br />
change (%)<br />
Rank<br />
09 10 09/08 10/09 09/08 10/09<br />
1 USA 94.2 103.5 - 14.7 9.9 -14.7 9.9<br />
2 Spain 53.2 52.5 -13.7 -1.2 -9.0 3.9<br />
3 France 49.4 46.3 -12.7 -6.2 -7.9 -1.3<br />
4 China 39.7 45.8 -2.9 15.5 -2.9($) 15.5($)<br />
5 Italy 40.2 38.8 -12.0 -3.6 -7.2 1.4<br />
6 Germany 34.6 34.7 -13.2 0.1 -8.5 5.3<br />
7 UK 30.1 30.4 -16.3 0.8 -1.3 1.7<br />
8 <strong>Australia</strong> 25.4 30.1 2.5 18.6 10.3 0.8<br />
9 Hong Kong (China) 16.4 23.0 7.5 39.5 7.0 39.8<br />
10 Turkey 21.3 20.8 -3.2 -2.1 -3.2 ($) -2.1($)<br />
($) = percentage derived from series in US$ instead of local currency.<br />
Source: World <strong>Tourism</strong> Organization (UNWTO), <strong>Tourism</strong> Highlights <strong>2011</strong> edition.<br />
8 <strong>Australia</strong>’s Place in Global <strong>Tourism</strong>