Annual Report 2010-2011 - Tourism Australia
Annual Report 2010-2011 - Tourism Australia
Annual Report 2010-2011 - Tourism Australia

You also want an ePaper? Increase the reach of your titles
YUMPU automatically turns print PDFs into web optimized ePapers that Google loves.
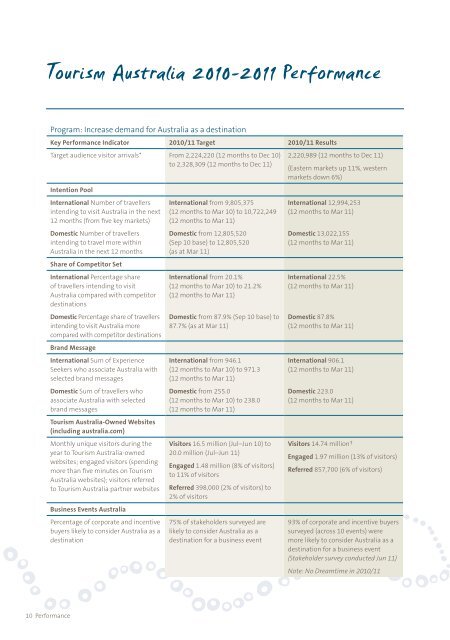
<strong>Tourism</strong> <strong>Australia</strong> <strong>2010</strong>-<strong>2011</strong> Performance<br />
Program: Increase demand for <strong>Australia</strong> as a destination<br />
Key Performance Indicator <strong>2010</strong>/11 Target <strong>2010</strong>/11 Results<br />
Target audience visitor arrivals* From 2,224,220 (12 months to Dec 10)<br />
to 2,328,309 (12 months to Dec 11)<br />
Intention Pool<br />
International Number of travellers<br />
intending to visit <strong>Australia</strong> in the next<br />
12 months (from five key markets)<br />
Domestic Number of travellers<br />
intending to travel more within<br />
<strong>Australia</strong> in the next 12 months<br />
Share of Competitor Set<br />
International Percentage share<br />
of travellers intending to visit<br />
<strong>Australia</strong> compared with competitor<br />
destinations<br />
Domestic Percentage share of travellers<br />
intending to visit <strong>Australia</strong> more<br />
compared with competitor destinations<br />
Brand Message<br />
International Sum of Experience<br />
Seekers who associate <strong>Australia</strong> with<br />
selected brand messages<br />
Domestic Sum of travellers who<br />
associate <strong>Australia</strong> with selected<br />
brand messages<br />
<strong>Tourism</strong> <strong>Australia</strong>-Owned Websites<br />
(including australia.com)<br />
Monthly unique visitors during the<br />
year to <strong>Tourism</strong> <strong>Australia</strong>-owned<br />
websites; engaged visitors (spending<br />
more than five minutes on <strong>Tourism</strong><br />
<strong>Australia</strong> websites); visitors referred<br />
to <strong>Tourism</strong> <strong>Australia</strong> partner websites<br />
Business Events <strong>Australia</strong><br />
Percentage of corporate and incentive<br />
buyers likely to consider <strong>Australia</strong> as a<br />
destination<br />
International from 9,805,375<br />
(12 months to Mar 10) to 10,722,249<br />
(12 months to Mar 11)<br />
Domestic from 12,805,520<br />
(Sep 10 base) to 12,805,520<br />
(as at Mar 11)<br />
International from 20.1%<br />
(12 months to Mar 10) to 21.2%<br />
(12 months to Mar 11)<br />
Domestic from 87.9% (Sep 10 base) to<br />
87.7% (as at Mar 11)<br />
International from 946.1<br />
(12 months to Mar 10) to 971.3<br />
(12 months to Mar 11)<br />
Domestic from 255.0<br />
(12 months to Mar 10) to 238.0<br />
(12 months to Mar 11)<br />
Visitors 16.5 million (Jul–Jun 10) to<br />
20.0 million (Jul–Jun 11)<br />
Engaged 1.48 million (8% of visitors)<br />
to 11% of visitors<br />
Referred 398,000 (2% of visitors) to<br />
2% of visitors<br />
75% of stakeholders surveyed are<br />
likely to consider <strong>Australia</strong> as a<br />
destination for a business event<br />
2,220,989 (12 months to Dec 11)<br />
(Eastern markets up 11%, western<br />
markets down 6%)<br />
International 12,994,253<br />
(12 months to Mar 11)<br />
Domestic 13,022,155<br />
(12 months to Mar 11)<br />
International 22.5%<br />
(12 months to Mar 11)<br />
Domestic 87.8%<br />
(12 months to Mar 11)<br />
International 906.1<br />
(12 months to Mar 11)<br />
Domestic 223.0<br />
(12 months to Mar 11)<br />
Visitors 14.74 million†<br />
Engaged 1.97 million (13% of visitors)<br />
Referred 857,700 (6% of visitors)<br />
93% of corporate and incentive buyers<br />
surveyed (across 10 events) were<br />
more likely to consider <strong>Australia</strong> as a<br />
destination for a business event<br />
(Stakeholder survey conducted Jun 11)<br />
Note: No Dreamtime in <strong>2010</strong>/11<br />
10 Performance