effect of accelerometer mass on thin plate vibration - Jurnal Mekanikal
effect of accelerometer mass on thin plate vibration - Jurnal Mekanikal
effect of accelerometer mass on thin plate vibration - Jurnal Mekanikal

Create successful ePaper yourself
Turn your PDF publications into a flip-book with our unique Google optimized e-Paper software.
<strong>Jurnal</strong> <strong>Mekanikal</strong><br />
December 2009, No.29, 100-111<br />
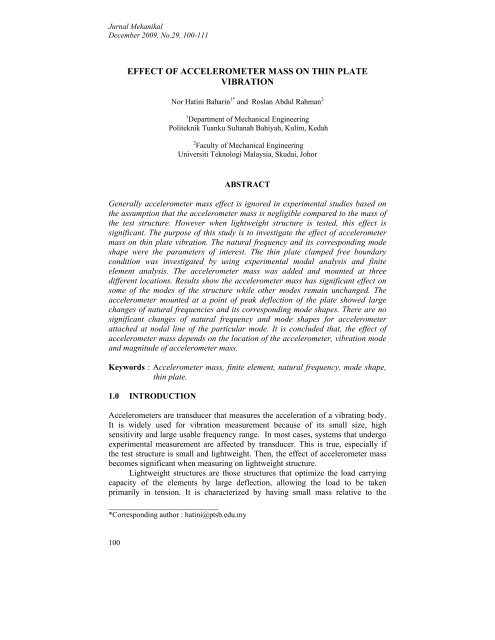
EFFECT OF ACCELEROMETER MASS ON THIN PLATE<br />
VIBRATION<br />
Nor Hatini Baharin 1* and Roslan Abdul Rahman 2<br />
1 Department <str<strong>on</strong>g>of</str<strong>on</strong>g> Mechanical Engineering<br />
Politeknik Tuanku Sultanah Bahiyah, Kulim, Kedah<br />
2 Faculty <str<strong>on</strong>g>of</str<strong>on</strong>g> Mechanical Engineering<br />
Universiti Teknologi Malaysia, Skudai, Johor<br />
ABSTRACT<br />
Generally <str<strong>on</strong>g>accelerometer</str<strong>on</strong>g> <str<strong>on</strong>g>mass</str<strong>on</strong>g> <str<strong>on</strong>g>effect</str<strong>on</strong>g> is ignored in experimental studies based <strong>on</strong><br />
the assumpti<strong>on</strong> that the <str<strong>on</strong>g>accelerometer</str<strong>on</strong>g> <str<strong>on</strong>g>mass</str<strong>on</strong>g> is negligible compared to the <str<strong>on</strong>g>mass</str<strong>on</strong>g> <str<strong>on</strong>g>of</str<strong>on</strong>g><br />
the test structure. However when lightweight structure is tested, this <str<strong>on</strong>g>effect</str<strong>on</strong>g> is<br />
significant. The purpose <str<strong>on</strong>g>of</str<strong>on</strong>g> this study is to investigate the <str<strong>on</strong>g>effect</str<strong>on</strong>g> <str<strong>on</strong>g>of</str<strong>on</strong>g> <str<strong>on</strong>g>accelerometer</str<strong>on</strong>g><br />
<str<strong>on</strong>g>mass</str<strong>on</strong>g> <strong>on</strong> <strong>thin</strong> <strong>plate</strong> vibrati<strong>on</strong>. The natural frequency and its corresp<strong>on</strong>ding mode<br />
shape were the parameters <str<strong>on</strong>g>of</str<strong>on</strong>g> interest. The <strong>thin</strong> <strong>plate</strong> clamped free boundary<br />
c<strong>on</strong>diti<strong>on</strong> was investigated by using experimental modal analysis and finite<br />
element analysis. The <str<strong>on</strong>g>accelerometer</str<strong>on</strong>g> <str<strong>on</strong>g>mass</str<strong>on</strong>g> was added and mounted at three<br />
different locati<strong>on</strong>s. Results show the <str<strong>on</strong>g>accelerometer</str<strong>on</strong>g> <str<strong>on</strong>g>mass</str<strong>on</strong>g> has significant <str<strong>on</strong>g>effect</str<strong>on</strong>g> <strong>on</strong><br />
some <str<strong>on</strong>g>of</str<strong>on</strong>g> the modes <str<strong>on</strong>g>of</str<strong>on</strong>g> the structure while other modes remain unchanged. The<br />
<str<strong>on</strong>g>accelerometer</str<strong>on</strong>g> mounted at a point <str<strong>on</strong>g>of</str<strong>on</strong>g> peak deflecti<strong>on</strong> <str<strong>on</strong>g>of</str<strong>on</strong>g> the <strong>plate</strong> showed large<br />
changes <str<strong>on</strong>g>of</str<strong>on</strong>g> natural frequencies and its corresp<strong>on</strong>ding mode shapes. There are no<br />
significant changes <str<strong>on</strong>g>of</str<strong>on</strong>g> natural frequency and mode shapes for <str<strong>on</strong>g>accelerometer</str<strong>on</strong>g><br />
attached at nodal line <str<strong>on</strong>g>of</str<strong>on</strong>g> the particular mode. It is c<strong>on</strong>cluded that, the <str<strong>on</strong>g>effect</str<strong>on</strong>g> <str<strong>on</strong>g>of</str<strong>on</strong>g><br />
<str<strong>on</strong>g>accelerometer</str<strong>on</strong>g> <str<strong>on</strong>g>mass</str<strong>on</strong>g> depends <strong>on</strong> the locati<strong>on</strong> <str<strong>on</strong>g>of</str<strong>on</strong>g> the <str<strong>on</strong>g>accelerometer</str<strong>on</strong>g>, vibrati<strong>on</strong> mode<br />
and magnitude <str<strong>on</strong>g>of</str<strong>on</strong>g> <str<strong>on</strong>g>accelerometer</str<strong>on</strong>g> <str<strong>on</strong>g>mass</str<strong>on</strong>g>.<br />
Keywords : Accelerometer <str<strong>on</strong>g>mass</str<strong>on</strong>g>, finite element, natural frequency, mode shape,<br />
<strong>thin</strong> <strong>plate</strong>.<br />
1.0 INTRODUCTION<br />
Accelerometers are transducer that measures the accelerati<strong>on</strong> <str<strong>on</strong>g>of</str<strong>on</strong>g> a vibrating body.<br />
It is widely used for vibrati<strong>on</strong> measurement because <str<strong>on</strong>g>of</str<strong>on</strong>g> its small size, high<br />
sensitivity and large usable frequency range. In most cases, systems that undergo<br />
experimental measurement are affected by transducer. This is true, especially if<br />
the test structure is small and lightweight. Then, the <str<strong>on</strong>g>effect</str<strong>on</strong>g> <str<strong>on</strong>g>of</str<strong>on</strong>g> <str<strong>on</strong>g>accelerometer</str<strong>on</strong>g> <str<strong>on</strong>g>mass</str<strong>on</strong>g><br />
becomes significant when measuring <strong>on</strong> lightweight structure.<br />
Lightweight structures are those structures that optimize the load carrying<br />
capacity <str<strong>on</strong>g>of</str<strong>on</strong>g> the elements by large deflecti<strong>on</strong>, allowing the load to be taken<br />
primarily in tensi<strong>on</strong>. It is characterized by having small <str<strong>on</strong>g>mass</str<strong>on</strong>g> relative to the<br />
________________________<br />
*Corresp<strong>on</strong>ding author : hatini@ptsb.edu.my<br />
100
<strong>Jurnal</strong> <strong>Mekanikal</strong>, December 2009<br />
applied load which the shape <str<strong>on</strong>g>of</str<strong>on</strong>g> the structure is determined through an<br />
optimizati<strong>on</strong> process. Lightweight structures include cable, membrane, shell, <strong>thin</strong><br />
<strong>plate</strong> and folded structures.<br />
Transducer <str<strong>on</strong>g>effect</str<strong>on</strong>g>s <strong>on</strong> a structure are also known as ‘<str<strong>on</strong>g>mass</str<strong>on</strong>g> loading’ since the<br />
added <str<strong>on</strong>g>mass</str<strong>on</strong>g> applies an additi<strong>on</strong>al load to the structure. Døssing [1], in 1990s was<br />
the first to investigate this problem. It was found that the transducer apparent<br />
<str<strong>on</strong>g>mass</str<strong>on</strong>g> and its <str<strong>on</strong>g>effect</str<strong>on</strong>g>s <strong>on</strong> the measurement values depends <strong>on</strong> the structure, the<br />
measuring locati<strong>on</strong> and frequency. His c<strong>on</strong>cerns were in determining the natural<br />
frequencies and dealing with the inc<strong>on</strong>sistencies <str<strong>on</strong>g>of</str<strong>on</strong>g> the experimental data used for<br />
extracting mode shapes which was derived from the differences in the measuring<br />
locati<strong>on</strong>. Døssing introduced the driving point residue method to predict shifts <str<strong>on</strong>g>of</str<strong>on</strong>g><br />
natural frequency due to <str<strong>on</strong>g>mass</str<strong>on</strong>g> loading <str<strong>on</strong>g>effect</str<strong>on</strong>g>s.<br />
Baldanzinni and Pierrini [2] have studied the <str<strong>on</strong>g>effect</str<strong>on</strong>g>s <str<strong>on</strong>g>of</str<strong>on</strong>g> transducer <str<strong>on</strong>g>mass</str<strong>on</strong>g> and<br />
moments <str<strong>on</strong>g>of</str<strong>on</strong>g> inertia <strong>on</strong> frequency resp<strong>on</strong>se functi<strong>on</strong>. They c<strong>on</strong>cluded that the<br />
transducer loading <str<strong>on</strong>g>effect</str<strong>on</strong>g>s were mostly caused by transducer <str<strong>on</strong>g>mass</str<strong>on</strong>g> and not by<br />
moment <str<strong>on</strong>g>of</str<strong>on</strong>g> inertia. However, this c<strong>on</strong>clusi<strong>on</strong> <strong>on</strong>ly valid if low moment <str<strong>on</strong>g>of</str<strong>on</strong>g> inertia<br />
was applied to the structure. Mass loading is also very sensitive to ratio between<br />
local dynamic stiffness and transducer <str<strong>on</strong>g>mass</str<strong>on</strong>g>. A transducer placed <strong>on</strong> a nodal line<br />
did not caused <str<strong>on</strong>g>mass</str<strong>on</strong>g> loading <str<strong>on</strong>g>effect</str<strong>on</strong>g>, while it str<strong>on</strong>gly influenced the measured data<br />
if place <strong>on</strong> anti nodal locati<strong>on</strong>.<br />
2.0 THEORY OF MASS LOADING<br />
The <str<strong>on</strong>g>mass</str<strong>on</strong>g> <str<strong>on</strong>g>of</str<strong>on</strong>g> an <str<strong>on</strong>g>accelerometer</str<strong>on</strong>g> can significantly affect the dynamic characteristics<br />
<str<strong>on</strong>g>of</str<strong>on</strong>g> the structure to which it is mounted. This is comm<strong>on</strong>ly called <str<strong>on</strong>g>mass</str<strong>on</strong>g> loading<br />
<str<strong>on</strong>g>effect</str<strong>on</strong>g> which tends to lower the measured natural frequencies. The general rules is<br />
the <str<strong>on</strong>g>accelerometer</str<strong>on</strong>g> <str<strong>on</strong>g>mass</str<strong>on</strong>g> should be less than <strong>on</strong>e-tenth from the <str<strong>on</strong>g>effect</str<strong>on</strong>g>ive <str<strong>on</strong>g>mass</str<strong>on</strong>g> <str<strong>on</strong>g>of</str<strong>on</strong>g><br />
the structure to which it is attached. Theoretically, the natural frequency is ;<br />
k<br />
ω =<br />
(1)<br />
M<br />
The additi<strong>on</strong> <str<strong>on</strong>g>of</str<strong>on</strong>g> the <str<strong>on</strong>g>accelerometer</str<strong>on</strong>g> <str<strong>on</strong>g>mass</str<strong>on</strong>g> to the <str<strong>on</strong>g>mass</str<strong>on</strong>g> <str<strong>on</strong>g>of</str<strong>on</strong>g> the vibrating structure<br />
changes the res<strong>on</strong>ant frequency <str<strong>on</strong>g>of</str<strong>on</strong>g> the vibrating systems as follows ;<br />
f<br />
m<br />
M<br />
= f s<br />
(2)<br />
M + m<br />
a<br />
where ω= natural frequency<br />
k = stiffness <str<strong>on</strong>g>of</str<strong>on</strong>g> the structure<br />
M = <str<strong>on</strong>g>mass</str<strong>on</strong>g> <str<strong>on</strong>g>of</str<strong>on</strong>g> the structure<br />
m a = <str<strong>on</strong>g>accelerometer</str<strong>on</strong>g> <str<strong>on</strong>g>mass</str<strong>on</strong>g><br />
f<br />
m<br />
= frequency <str<strong>on</strong>g>of</str<strong>on</strong>g> the structure with the influence <str<strong>on</strong>g>of</str<strong>on</strong>g> the <str<strong>on</strong>g>accelerometer</str<strong>on</strong>g> <str<strong>on</strong>g>mass</str<strong>on</strong>g><br />
fs = frequency <str<strong>on</strong>g>of</str<strong>on</strong>g> the structure without the influence <str<strong>on</strong>g>of</str<strong>on</strong>g> the <str<strong>on</strong>g>accelerometer</str<strong>on</strong>g> <str<strong>on</strong>g>mass</str<strong>on</strong>g><br />
101
<strong>Jurnal</strong> <strong>Mekanikal</strong>, December 2009<br />
This relati<strong>on</strong>ship shows that if the <str<strong>on</strong>g>accelerometer</str<strong>on</strong>g> <str<strong>on</strong>g>mass</str<strong>on</strong>g> is kept small<br />
compared to the <str<strong>on</strong>g>mass</str<strong>on</strong>g> <str<strong>on</strong>g>of</str<strong>on</strong>g> the structure then any changes in the vibrati<strong>on</strong> will be<br />
<strong>on</strong>ly small.<br />
The <str<strong>on</strong>g>mass</str<strong>on</strong>g> loading produced by <str<strong>on</strong>g>accelerometer</str<strong>on</strong>g> depends <strong>on</strong> the local dynamic<br />
properties <str<strong>on</strong>g>of</str<strong>on</strong>g> the structure [3]. The <str<strong>on</strong>g>mass</str<strong>on</strong>g> and resulting frequencies shift is<br />
proporti<strong>on</strong>al to the square <str<strong>on</strong>g>of</str<strong>on</strong>g> deflecti<strong>on</strong> <str<strong>on</strong>g>of</str<strong>on</strong>g> the associated mode. This study will<br />
determine how much the natural frequency will change due to the <str<strong>on</strong>g>mass</str<strong>on</strong>g> loading<br />
<str<strong>on</strong>g>effect</str<strong>on</strong>g>.<br />
3.0 METHODOLOGY<br />
The natural frequencies and mode shapes <str<strong>on</strong>g>of</str<strong>on</strong>g> the <strong>thin</strong> <strong>plate</strong> were obtained by using<br />
modal testing and finite element analysis.<br />
3.1 Test structure<br />
In this study, the aluminum alloy <strong>plate</strong> with 3mm thickness was used. The<br />
dimensi<strong>on</strong> <str<strong>on</strong>g>of</str<strong>on</strong>g> the test structures used in this study is 240mm x 230mm x 3mm and<br />
the <str<strong>on</strong>g>mass</str<strong>on</strong>g> <str<strong>on</strong>g>of</str<strong>on</strong>g> the <strong>plate</strong> is 447g. One edge clamped boundary c<strong>on</strong>diti<strong>on</strong> was used to<br />
the test structure.<br />
To investigate the <str<strong>on</strong>g>mass</str<strong>on</strong>g> loading <str<strong>on</strong>g>effect</str<strong>on</strong>g> <str<strong>on</strong>g>of</str<strong>on</strong>g> an <str<strong>on</strong>g>accelerometer</str<strong>on</strong>g>, the <str<strong>on</strong>g>mass</str<strong>on</strong>g> <str<strong>on</strong>g>of</str<strong>on</strong>g> the<br />
<str<strong>on</strong>g>accelerometer</str<strong>on</strong>g> was increased from 5.84 g to 45.84 g. The standard <str<strong>on</strong>g>mass</str<strong>on</strong>g> <str<strong>on</strong>g>of</str<strong>on</strong>g><br />
multiple 10 gram were used in the experiment as added <str<strong>on</strong>g>mass</str<strong>on</strong>g> to the <str<strong>on</strong>g>accelerometer</str<strong>on</strong>g><br />
<str<strong>on</strong>g>mass</str<strong>on</strong>g>. Here, we c<strong>on</strong>sidered that the added <str<strong>on</strong>g>mass</str<strong>on</strong>g> is to be called the <str<strong>on</strong>g>accelerometer</str<strong>on</strong>g><br />
<str<strong>on</strong>g>mass</str<strong>on</strong>g> to indicate the <str<strong>on</strong>g>accelerometer</str<strong>on</strong>g> <str<strong>on</strong>g>mass</str<strong>on</strong>g> <str<strong>on</strong>g>effect</str<strong>on</strong>g>s. The <str<strong>on</strong>g>accelerometer</str<strong>on</strong>g> was attached<br />
at three different locati<strong>on</strong>s as shown in Figure 1. The <str<strong>on</strong>g>accelerometer</str<strong>on</strong>g> <str<strong>on</strong>g>mass</str<strong>on</strong>g> will be<br />
added until it was increased over than <strong>on</strong>e-tenth <str<strong>on</strong>g>of</str<strong>on</strong>g> the <str<strong>on</strong>g>mass</str<strong>on</strong>g> <str<strong>on</strong>g>of</str<strong>on</strong>g> the <strong>plate</strong>. The<br />
<str<strong>on</strong>g>accelerometer</str<strong>on</strong>g> <str<strong>on</strong>g>mass</str<strong>on</strong>g> is identified as in Table 1.<br />
No<br />
Table 1 : Mass <str<strong>on</strong>g>of</str<strong>on</strong>g> the <str<strong>on</strong>g>accelerometer</str<strong>on</strong>g> mounted <strong>on</strong> the test <strong>plate</strong><br />
Mass <str<strong>on</strong>g>of</str<strong>on</strong>g> the <str<strong>on</strong>g>accelerometer</str<strong>on</strong>g> Percentage increase <str<strong>on</strong>g>of</str<strong>on</strong>g> the <str<strong>on</strong>g>accelerometer</str<strong>on</strong>g><br />
(g)<br />
<str<strong>on</strong>g>mass</str<strong>on</strong>g> compared to the <strong>plate</strong> <str<strong>on</strong>g>mass</str<strong>on</strong>g> (%)<br />
1 5.84 1.3<br />
2 15.84 3.5<br />
3 25.84 5.8<br />
4 35.84 8.0<br />
5 45.84 10.2<br />
102
<strong>Jurnal</strong> <strong>Mekanikal</strong>, December 2009<br />
3.2 Finite Element Analysis<br />
ABAQUS Versi<strong>on</strong> 6.6.3 was used to obtain the natural frequency and its<br />
corresp<strong>on</strong>ding mode shape <str<strong>on</strong>g>of</str<strong>on</strong>g> the test structure. The test structure was modeled<br />
using shell element and while the <str<strong>on</strong>g>accelerometer</str<strong>on</strong>g> was modeled as hexag<strong>on</strong> solid<br />
element.. The model <str<strong>on</strong>g>of</str<strong>on</strong>g> <str<strong>on</strong>g>accelerometer</str<strong>on</strong>g> was attached <strong>on</strong> the test structure model at<br />
the locati<strong>on</strong>s as shown in Figure 1. The properties <str<strong>on</strong>g>of</str<strong>on</strong>g> the test structure are defined<br />
as follow;<br />
Young’s Modulus, E = 72 x 10 9 Pa<br />
Poiss<strong>on</strong> Ratio, v = 0.3<br />
Density, ρ = 2700 kg/m 3<br />
P2<br />
P1<br />
P3<br />
Figure 1 : Layout <str<strong>on</strong>g>of</str<strong>on</strong>g> <str<strong>on</strong>g>accelerometer</str<strong>on</strong>g> locati<strong>on</strong> <strong>on</strong> the <strong>plate</strong><br />
3.3 Experimental Modal Analysis<br />
The <str<strong>on</strong>g>accelerometer</str<strong>on</strong>g> used for the experimental modal analysis is PiezoBeam<br />
<str<strong>on</strong>g>accelerometer</str<strong>on</strong>g> from KISTLER type 8636C50. It was chosen because <str<strong>on</strong>g>of</str<strong>on</strong>g> its small<br />
size and lightweight with a <str<strong>on</strong>g>mass</str<strong>on</strong>g> <str<strong>on</strong>g>of</str<strong>on</strong>g> 5.84 gram, thus the <str<strong>on</strong>g>effect</str<strong>on</strong>g> <str<strong>on</strong>g>of</str<strong>on</strong>g> <str<strong>on</strong>g>mass</str<strong>on</strong>g> loading is<br />
small and representing 1.3% <str<strong>on</strong>g>of</str<strong>on</strong>g> <strong>plate</strong> <str<strong>on</strong>g>mass</str<strong>on</strong>g>. An impact hammer method <str<strong>on</strong>g>of</str<strong>on</strong>g><br />
excitati<strong>on</strong> was used with KISTLER model 9722A500 impact hammer. It is<br />
equipped with low impedance force sensor to measure the force excited <strong>on</strong> the test<br />
structures. Plastic hammer tip was used to produce signal <str<strong>on</strong>g>of</str<strong>on</strong>g> the force pulse and to<br />
provide a broadband excitati<strong>on</strong> to the interest frequency range <str<strong>on</strong>g>of</str<strong>on</strong>g> 0 – 2000 Hz.<br />
PAK MULLER-MK11 was used as the FFT analyzer to simultaneously measures<br />
the force and resp<strong>on</strong>se, c<strong>on</strong>verted them into digital signals and computed their<br />
Discrete Fourier Transform. ME’scopeVES versi<strong>on</strong> 4.0 was used as modal<br />
analysis s<str<strong>on</strong>g>of</str<strong>on</strong>g>tware to extract the natural frequencies and corresp<strong>on</strong>ding mode<br />
shapes from the measured data.<br />
4.0 RESULTS OF THE NATURAL FREQUENCY<br />
Tables 2 to 7 present the results obtained from numerical and experimental<br />
analysis for the first sixth natural frequency for tested <strong>plate</strong>.<br />
103
<strong>Jurnal</strong> <strong>Mekanikal</strong>, December 2009<br />
4.1 Case 1 : Locati<strong>on</strong> <str<strong>on</strong>g>of</str<strong>on</strong>g> Accelerometer is at point 1 (P1)<br />
Table 2 : Natural frequencies <str<strong>on</strong>g>of</str<strong>on</strong>g> <strong>plate</strong> from the numerical analysis<br />
m a<br />
(g)<br />
%<br />
<str<strong>on</strong>g>of</str<strong>on</strong>g><br />
m a 1<br />
%<br />
diff<br />
2<br />
%<br />
diff<br />
Natural Frequencies (Hz) and Mode<br />
3<br />
0.0 0.0 45 0.0 113 0.0 275 0.0 372 0.0 407 0.0 723 0.0<br />
5.84 1.3 44 2.2 108 4.4 272 1.1 348 6.5 398 2.2 698 3.5<br />
15.84 3.5 42 6.7 102 9.7 266 3.3 321 13.7 394 3.2 665 8.0<br />
25.84 5.8 41 8.9 97 14.2 260 5.5 308 17.2 392 3.7 647 10.5<br />
35.84 8.0 39 13.3 93 17.7 254 7.6 301 19.1 391 3.9 637 11.9<br />
45.84 10.2 38 15.6 91 19.5 250 9.1 297 20.2 391 3.9 629 13.0<br />
%<br />
diff<br />
4<br />
%<br />
diff<br />
5<br />
%<br />
diff<br />
6<br />
%<br />
diff<br />
Table 3 : Natural frequencies <str<strong>on</strong>g>of</str<strong>on</strong>g> <strong>plate</strong> from impact test<br />
m a<br />
(g)<br />
%<br />
<str<strong>on</strong>g>of</str<strong>on</strong>g><br />
m a 1<br />
%<br />
diff<br />
2<br />
Natural Frequencies (Hz) and Mode<br />
%<br />
diff<br />
3<br />
5.84 1.3 43 0.0 102 0.0 254 0.0 340 0.0 401 0.0 664 0.0<br />
15.84 3.5 42 1.6 96.8 5.1 253 0.4 316 7.1 397 1.0 641 3.5<br />
25.84 5.8 41 4.5 92.6 9.2 251 1.2 303 10.9 387 3.5 631 5.0<br />
35.84 8.0 40 6.6 89 12.7 248 2.4 293 13.8 376 6.2 630 5.1<br />
45.84 10.2 39 8.5 86.3 15.4 244 3.9 287 15.6 376 6.2 - -<br />
%<br />
diff<br />
4<br />
%<br />
diff<br />
5<br />
%<br />
diff<br />
6<br />
%<br />
diff<br />
4.2 Case 2 : Locati<strong>on</strong> <str<strong>on</strong>g>of</str<strong>on</strong>g> the <str<strong>on</strong>g>accelerometer</str<strong>on</strong>g> is at point 2 (P2)<br />
Table 4 :Natural frequencies <str<strong>on</strong>g>of</str<strong>on</strong>g> <strong>plate</strong> from numerical analysis<br />
m a % <str<strong>on</strong>g>of</str<strong>on</strong>g> Natural Frequencies (Hz) and Mode<br />
(g) m a 1<br />
%<br />
diff<br />
2<br />
%<br />
diff<br />
3<br />
0.0 0.0 45 0.0 113 0.0 275 0.0 375 0.0 407 0.0 723 0.0<br />
5.84 1.3 45 0.0 113 0.0 275 0.0 375 0.0 407 0.0 732 1.2<br />
15.84 3.5 44 2.2 111 1.8 275 0.0 374 0.5 407 0.0 729 0.8<br />
25.84 5.8 44 2.2 110 2.7 274 0.4 374 0.5 407 0.0 726 0.4<br />
35.84 8.0 44 2.2 109 3.5 274 0.4 373 0.3 407 0.0 721 0.3<br />
45.84 10.2 44 2.2 108 4.4 274 0.4 372 0.0 407 0.0 715 1.1<br />
%<br />
diff<br />
4<br />
%<br />
diff<br />
5<br />
%<br />
diff<br />
6<br />
%<br />
diff<br />
104
<strong>Jurnal</strong> <strong>Mekanikal</strong>, December 2009<br />
Table 5 : Natural frequencies <str<strong>on</strong>g>of</str<strong>on</strong>g> <strong>plate</strong> from impact test<br />
m a<br />
(g)<br />
%<br />
<str<strong>on</strong>g>of</str<strong>on</strong>g><br />
m a 1<br />
%<br />
diff<br />
2<br />
%<br />
diff<br />
Natural Frequencies (Hz) and Mode<br />
3<br />
%<br />
diff<br />
5.84 1.3 43 0.0 113 0.0 286 0.0 371 0.0 421 0.0 729 0.0<br />
15.84 3.5 43 0.0 112 0.9 286 0.0 371 0.0 421 0.0 727 0.3<br />
25.84 5.8 43 0.5 110 2.7 286 0.0 369 0.5 421 0.0 723 0.8<br />
35.84 8.0 42 2.1 109 3.5 285 0.3 367 1.1 421 0.0 715 1.9<br />
45.84 10.2 42 3.0 108 4.4 284 0.7 359 3.2 421 0.0 717 1.6<br />
4<br />
%<br />
diff<br />
5<br />
%<br />
diff<br />
6<br />
%<br />
diff<br />
4.3 Case 3 : Locati<strong>on</strong> <str<strong>on</strong>g>of</str<strong>on</strong>g> the <str<strong>on</strong>g>accelerometer</str<strong>on</strong>g> is at point 3 (P3)<br />
Table 6 : Natural frequencies <str<strong>on</strong>g>of</str<strong>on</strong>g> <strong>plate</strong> from numerical analysis<br />
m a<br />
(g)<br />
%<br />
<str<strong>on</strong>g>of</str<strong>on</strong>g><br />
m a 1<br />
%<br />
diff<br />
2<br />
%<br />
diff<br />
Natural Frequencies (Hz) and Mode<br />
3<br />
0.0 0.0 45 0.0 113 0.0 275 0.0 372 0.0 407 0.0 723 0.0<br />
5.84 1.3 45 0.0 113 0.0 275 0.0 370 0.5 407 0.0 716 1.0<br />
15.84 3.5 45 0.0 113 0.0 271 1.5 363 2.4 407 0.0 701 3.0<br />
25.84 5.8 44 2.2 113 0.0 267 2.9 357 4.0 407 0.0 689 4.7<br />
35.84 8 44 2.2 113 0.0 263 4.4 353 5.1 407 0.0 678 6.2<br />
45.84 10.2 44 2.2 113 0.0 259 5.8 349 6.2 407 0.0 670 7.3<br />
%<br />
diff<br />
4<br />
%<br />
diff<br />
5<br />
%<br />
diff<br />
6<br />
%<br />
diff<br />
Table 7 : Natural frequencies <str<strong>on</strong>g>of</str<strong>on</strong>g> <strong>plate</strong> from impact test<br />
m a<br />
(g)<br />
% <str<strong>on</strong>g>of</str<strong>on</strong>g> Natural Frequencies (Hz) and Mode<br />
m a 1<br />
%<br />
diff<br />
2<br />
%<br />
diff<br />
3<br />
5.84 1.3 43.3 0.0 114 0.0 285 0.0 370 0.0 - - 715 0.0<br />
15.84 3.5 43.3 0.0 114 0.0 279 2.1 361 2.4 - - 697 2.5<br />
25.84 5.8 43.2 0.2 114 0.0 276 3.2 355 4.1 - - 682 4.6<br />
35.84 8.0 43.2 0.2 114 0.0 271 4.9 350 5.4 - - 669 6.4<br />
45.84 10.2 43.1 0.5 114 0.0 267 6.3 346 6.5 - - 660 7.7<br />
%<br />
diff<br />
4<br />
%<br />
diff<br />
5<br />
%<br />
diff<br />
6<br />
%<br />
diff<br />
105
<strong>Jurnal</strong> <strong>Mekanikal</strong>, December 2009<br />
5.0 ANALYSIS OF DATA AND DISCUSSION<br />
5.1 General Rule for Accelerometer Mass<br />
It was stated that, the general rules for the <str<strong>on</strong>g>mass</str<strong>on</strong>g> <str<strong>on</strong>g>of</str<strong>on</strong>g> the <str<strong>on</strong>g>accelerometer</str<strong>on</strong>g> is, it should<br />
be less than <strong>on</strong>e-tenth <str<strong>on</strong>g>of</str<strong>on</strong>g> the <str<strong>on</strong>g>mass</str<strong>on</strong>g> <str<strong>on</strong>g>of</str<strong>on</strong>g> the structure to which it is attached. From<br />
Ashory [4], if the natural frequency shifted by 5% from the exact value, it was<br />
c<strong>on</strong>sidered not acceptable and must be corrected to cancel the <str<strong>on</strong>g>mass</str<strong>on</strong>g> loading <str<strong>on</strong>g>effect</str<strong>on</strong>g><br />
<str<strong>on</strong>g>of</str<strong>on</strong>g> <str<strong>on</strong>g>accelerometer</str<strong>on</strong>g>. For case 3, when the <str<strong>on</strong>g>accelerometer</str<strong>on</strong>g> <str<strong>on</strong>g>mass</str<strong>on</strong>g> was located at P3,<br />
increasing the <str<strong>on</strong>g>accelerometer</str<strong>on</strong>g> <str<strong>on</strong>g>mass</str<strong>on</strong>g> by 8% <str<strong>on</strong>g>of</str<strong>on</strong>g> the <str<strong>on</strong>g>mass</str<strong>on</strong>g> <str<strong>on</strong>g>of</str<strong>on</strong>g> the <strong>plate</strong>, the natural<br />
frequency <str<strong>on</strong>g>of</str<strong>on</strong>g> mode 4 was shifted by 5%. On the c<strong>on</strong>trary, the natural frequency for<br />
some modes remains unchanged although the <str<strong>on</strong>g>accelerometer</str<strong>on</strong>g> <str<strong>on</strong>g>mass</str<strong>on</strong>g> was increased<br />
over 10% <str<strong>on</strong>g>of</str<strong>on</strong>g> the <str<strong>on</strong>g>mass</str<strong>on</strong>g> <str<strong>on</strong>g>of</str<strong>on</strong>g> <strong>plate</strong>. Therefore, the general rule for the <str<strong>on</strong>g>mass</str<strong>on</strong>g> <str<strong>on</strong>g>of</str<strong>on</strong>g> the<br />
<str<strong>on</strong>g>accelerometer</str<strong>on</strong>g> is not completely reliable in every case.<br />
5.2 Varying Accelerometer Mass with Accelerometer Fixed at Locati<strong>on</strong><br />
The <str<strong>on</strong>g>effect</str<strong>on</strong>g> <str<strong>on</strong>g>of</str<strong>on</strong>g> the <str<strong>on</strong>g>accelerometer</str<strong>on</strong>g> <str<strong>on</strong>g>mass</str<strong>on</strong>g> <strong>on</strong> the natural frequency and mode shapes <str<strong>on</strong>g>of</str<strong>on</strong>g><br />
the <strong>thin</strong> <strong>plate</strong> were investigated by comparing the results from finite element and<br />
experimental analysis. Figure 2 shows the graph <str<strong>on</strong>g>of</str<strong>on</strong>g> natural frequency against<br />
<str<strong>on</strong>g>accelerometer</str<strong>on</strong>g> <str<strong>on</strong>g>mass</str<strong>on</strong>g> located at P1 for mode 2. The graph shows that the natural<br />
frequency is inversely proporti<strong>on</strong>al to the <str<strong>on</strong>g>accelerometer</str<strong>on</strong>g> <str<strong>on</strong>g>mass</str<strong>on</strong>g>. The results <str<strong>on</strong>g>of</str<strong>on</strong>g> the<br />
finite element analysis and experimental modal analysis produce a similar trend<br />
P1<br />
Figure 2 : Graph <str<strong>on</strong>g>of</str<strong>on</strong>g> natural frequency versus <str<strong>on</strong>g>accelerometer</str<strong>on</strong>g> <str<strong>on</strong>g>mass</str<strong>on</strong>g> located at P1<br />
for mode 2<br />
106
<strong>Jurnal</strong> <strong>Mekanikal</strong>, December 2009<br />
Figure 3 shows the sec<strong>on</strong>d mode shapes obtained through numerical and<br />
experimental modal analysis. This figure clearly portrays the <str<strong>on</strong>g>effect</str<strong>on</strong>g> <str<strong>on</strong>g>of</str<strong>on</strong>g><br />
<str<strong>on</strong>g>accelerometer</str<strong>on</strong>g> <str<strong>on</strong>g>mass</str<strong>on</strong>g> <strong>on</strong> <strong>thin</strong> <strong>plate</strong>. It shows that the changes to the mode shapes are<br />
more apparent for a larger <str<strong>on</strong>g>accelerometer</str<strong>on</strong>g> <str<strong>on</strong>g>mass</str<strong>on</strong>g>.<br />
Thus, the <str<strong>on</strong>g>effect</str<strong>on</strong>g> <str<strong>on</strong>g>of</str<strong>on</strong>g> <str<strong>on</strong>g>accelerometer</str<strong>on</strong>g> <str<strong>on</strong>g>mass</str<strong>on</strong>g> <strong>on</strong> the natural frequency and its<br />
corresp<strong>on</strong>ding mode shapes shows clearly for the <strong>plate</strong>s. The natural frequencies<br />
are proporti<strong>on</strong>al to the inverse <str<strong>on</strong>g>of</str<strong>on</strong>g> the <str<strong>on</strong>g>accelerometer</str<strong>on</strong>g> <str<strong>on</strong>g>mass</str<strong>on</strong>g>. The changed <str<strong>on</strong>g>of</str<strong>on</strong>g> the<br />
mode shapes are more obvious for a larger <str<strong>on</strong>g>accelerometer</str<strong>on</strong>g> <str<strong>on</strong>g>mass</str<strong>on</strong>g>.<br />
Numerical<br />
Analysis<br />
Experimental<br />
Modal Analysis<br />
Numerical<br />
Analysis<br />
Experimental<br />
Modal Analysis<br />
NA<br />
(a) m a : 0g<br />
(113 Hz)<br />
(b) m a : 5.84 g<br />
(108 Hz)<br />
(c) m a : 5.84 g<br />
(102 Hz)<br />
(d) m a : 15.85<br />
g<br />
(102 Hz)<br />
(e) m a : 15.84 g<br />
(96.8 Hz)<br />
(f) m a : 25.84 g<br />
(97 Hz)<br />
(g) m a : 25.84 g<br />
(92.6 Hz)<br />
(h) m a : 35.84 g<br />
(93 Hz)<br />
(i) m a : 35.84 g<br />
(89 Hz)<br />
(j) m a : 45.84 g<br />
(91 Hz)<br />
(k) m a : 45.84 g<br />
(86.3 Hz)<br />
Figure 3 : Comparis<strong>on</strong> <str<strong>on</strong>g>of</str<strong>on</strong>g> the mode shapes for mode 2, the <str<strong>on</strong>g>accelerometer</str<strong>on</strong>g><br />
locate at P1.(NA-Not Aplicable; m a - <str<strong>on</strong>g>accelerometer</str<strong>on</strong>g> <str<strong>on</strong>g>mass</str<strong>on</strong>g>)<br />
5.3 Varying Accelerometer Locati<strong>on</strong> and Accelerometer Mass C<strong>on</strong>stant<br />
The <str<strong>on</strong>g>effect</str<strong>on</strong>g> <str<strong>on</strong>g>of</str<strong>on</strong>g> <str<strong>on</strong>g>accelerometer</str<strong>on</strong>g> locati<strong>on</strong> and <str<strong>on</strong>g>accelerometer</str<strong>on</strong>g> <str<strong>on</strong>g>mass</str<strong>on</strong>g> <strong>on</strong> <strong>thin</strong> <strong>plate</strong> was<br />
studied by comparing the natural frequency and its corresp<strong>on</strong>ding mode shapes <str<strong>on</strong>g>of</str<strong>on</strong>g><br />
<str<strong>on</strong>g>accelerometer</str<strong>on</strong>g> <str<strong>on</strong>g>mass</str<strong>on</strong>g>; 5.84 gm and 45.84 gm. These <str<strong>on</strong>g>mass</str<strong>on</strong>g> was selected because<br />
5.84 gm is the smallest <str<strong>on</strong>g>mass</str<strong>on</strong>g>, while 45.84 gm is the largest <str<strong>on</strong>g>mass</str<strong>on</strong>g> tested.<br />
107
<strong>Jurnal</strong> <strong>Mekanikal</strong>, December 2009<br />
Table 8 shows the natural frequency <str<strong>on</strong>g>of</str<strong>on</strong>g> mode 2 from numerical and<br />
experimental analysis for the additi<strong>on</strong>al <str<strong>on</strong>g>mass</str<strong>on</strong>g> located at P1, P2 and P3.<br />
Table 8: Comparis<strong>on</strong> <str<strong>on</strong>g>of</str<strong>on</strong>g> natural frequencies <str<strong>on</strong>g>of</str<strong>on</strong>g> mode 2 for <strong>thin</strong> <strong>plate</strong> tested at<br />
different locati<strong>on</strong> <str<strong>on</strong>g>of</str<strong>on</strong>g> <str<strong>on</strong>g>accelerometer</str<strong>on</strong>g>.<br />
Natural Frequency (Hz)<br />
Accelerometer<br />
Mass (m a )<br />
% <str<strong>on</strong>g>of</str<strong>on</strong>g><br />
m a<br />
Experiment<br />
Finite Element<br />
P5 P5 P13 P5 P9 P13<br />
5.84 gm 1.3 102 113 114 108 113 113<br />
45.84 gm 10.2 86.3 108 114 91 108 113<br />
It is apparent that for different locati<strong>on</strong> <str<strong>on</strong>g>of</str<strong>on</strong>g> <str<strong>on</strong>g>accelerometer</str<strong>on</strong>g> mounted <strong>on</strong> the<br />
<strong>thin</strong> <strong>plate</strong>, different results were obtained. For 5.84 gm <str<strong>on</strong>g>of</str<strong>on</strong>g> <str<strong>on</strong>g>accelerometer</str<strong>on</strong>g> <str<strong>on</strong>g>mass</str<strong>on</strong>g>, the<br />
lowest natural frequency value is when <str<strong>on</strong>g>accelerometer</str<strong>on</strong>g> mounted at P1, while at P3<br />
it gave highest value for the experimental results.<br />
The table shows that for 45.84 gm <str<strong>on</strong>g>of</str<strong>on</strong>g> <str<strong>on</strong>g>accelerometer</str<strong>on</strong>g> <str<strong>on</strong>g>mass</str<strong>on</strong>g> at P2 and P3, the<br />
natural frequency shifted lower compared to 5.84 gm <str<strong>on</strong>g>of</str<strong>on</strong>g> <str<strong>on</strong>g>accelerometer</str<strong>on</strong>g> <str<strong>on</strong>g>mass</str<strong>on</strong>g>.<br />
While, for the <str<strong>on</strong>g>accelerometer</str<strong>on</strong>g> mounted at point P3 <strong>on</strong> <strong>thin</strong> <strong>plate</strong>, the natural<br />
frequency did not changed although the <str<strong>on</strong>g>accelerometer</str<strong>on</strong>g> <str<strong>on</strong>g>mass</str<strong>on</strong>g> was increased. This is<br />
due to the <str<strong>on</strong>g>accelerometer</str<strong>on</strong>g> being placed <strong>on</strong> a nodal line (zero deflecti<strong>on</strong>) for this<br />
corresp<strong>on</strong>ding mode as can be seen in Figure 3. The <str<strong>on</strong>g>accelerometer</str<strong>on</strong>g> located at P1,<br />
changed the natural frequency most compared to the other points because it is the<br />
maximum deformati<strong>on</strong> for this mode. As discussed before, a transducer placed <strong>on</strong><br />
a nodal line did not cause <str<strong>on</strong>g>mass</str<strong>on</strong>g> loading <str<strong>on</strong>g>effect</str<strong>on</strong>g>, while it str<strong>on</strong>gly influenced the<br />
measured data if place at anti nodal locati<strong>on</strong>.<br />
108
<strong>Jurnal</strong> <strong>Mekanikal</strong>, December 2009<br />
Experiment<br />
Finite Element<br />
(a) Accelerometer at P1<br />
(b) Accelerometer at P1<br />
(c) Accelerometer at P2<br />
(d) Accelerometer at P2<br />
(e) Accelerometer at P3<br />
(f) Accelerometer at P3<br />
Figure 4 : Comparis<strong>on</strong> <str<strong>on</strong>g>of</str<strong>on</strong>g> the mode shape for mode 2 with 5.84 gm <str<strong>on</strong>g>of</str<strong>on</strong>g><br />
<str<strong>on</strong>g>accelerometer</str<strong>on</strong>g> <str<strong>on</strong>g>mass</str<strong>on</strong>g> located at P1, P2 and P3.<br />
Figure 4 shows the mode shape <str<strong>on</strong>g>of</str<strong>on</strong>g> mode 2 for 5.84 gm <str<strong>on</strong>g>of</str<strong>on</strong>g> <str<strong>on</strong>g>accelerometer</str<strong>on</strong>g><br />
<str<strong>on</strong>g>mass</str<strong>on</strong>g> obtained through experiment and finite element analysis. The <str<strong>on</strong>g>effect</str<strong>on</strong>g>s <strong>on</strong> the<br />
mode shapes as the locati<strong>on</strong> <str<strong>on</strong>g>of</str<strong>on</strong>g> the <str<strong>on</strong>g>accelerometer</str<strong>on</strong>g> varied were portrayed clearly.<br />
The mode shapes for <str<strong>on</strong>g>accelerometer</str<strong>on</strong>g> located at P2 and P3 were looked similar.<br />
While, the mode shapes <str<strong>on</strong>g>of</str<strong>on</strong>g> the mode for <str<strong>on</strong>g>accelerometer</str<strong>on</strong>g> located at P1 was slightly<br />
different compared to the other locati<strong>on</strong>.<br />
Figure 5 illustrates the mode shape <str<strong>on</strong>g>of</str<strong>on</strong>g> the mode 2 for <strong>thin</strong> <strong>plate</strong> with 45.84<br />
gm <str<strong>on</strong>g>of</str<strong>on</strong>g> the <str<strong>on</strong>g>accelerometer</str<strong>on</strong>g> obtained through experiment and finite element analysis.<br />
The mode shapes <str<strong>on</strong>g>of</str<strong>on</strong>g> the mode were significantly different for different locati<strong>on</strong> <str<strong>on</strong>g>of</str<strong>on</strong>g><br />
the <str<strong>on</strong>g>accelerometer</str<strong>on</strong>g> mounted <strong>on</strong> the <strong>thin</strong> <strong>plate</strong> although all the mode shapes were <str<strong>on</strong>g>of</str<strong>on</strong>g><br />
the same mode.<br />
It can be c<strong>on</strong>cluded that varying the locati<strong>on</strong> <str<strong>on</strong>g>of</str<strong>on</strong>g> <str<strong>on</strong>g>accelerometer</str<strong>on</strong>g> mounted <strong>on</strong><br />
the <strong>thin</strong> <strong>plate</strong>, will give different results. An <str<strong>on</strong>g>accelerometer</str<strong>on</strong>g> placed <strong>on</strong> a nodal line<br />
did not cause <str<strong>on</strong>g>mass</str<strong>on</strong>g> loading <str<strong>on</strong>g>effect</str<strong>on</strong>g>, while it str<strong>on</strong>gly influence the measured data if<br />
place at anti nodal locati<strong>on</strong>.<br />
109
<strong>Jurnal</strong> <strong>Mekanikal</strong>, December 2009<br />
Experiment<br />
Finite Element<br />
(a) Accelerometer at P1<br />
(b) Accelerometer at P1<br />
(c) Accelerometer at P2<br />
(d) Accelerometer at P2<br />
(e) Accelerometer at P3<br />
(f) Accelerometer at P3<br />
Figure 5 : Comparis<strong>on</strong> <str<strong>on</strong>g>of</str<strong>on</strong>g> the mode shapes for mode 2 with 45.84g <str<strong>on</strong>g>of</str<strong>on</strong>g> the<br />
<str<strong>on</strong>g>accelerometer</str<strong>on</strong>g> <str<strong>on</strong>g>mass</str<strong>on</strong>g> located at P1, P2 and P3.<br />
6.0 CONCLUSION<br />
The objective <str<strong>on</strong>g>of</str<strong>on</strong>g> this study was to investigate the <str<strong>on</strong>g>effect</str<strong>on</strong>g> <str<strong>on</strong>g>of</str<strong>on</strong>g> <str<strong>on</strong>g>accelerometer</str<strong>on</strong>g> <str<strong>on</strong>g>mass</str<strong>on</strong>g> <strong>on</strong><br />
<strong>thin</strong> <strong>plate</strong> vibrati<strong>on</strong>, where the natural frequencies and its corresp<strong>on</strong>ding mode<br />
shapes become the parameters <str<strong>on</strong>g>of</str<strong>on</strong>g> interest.<br />
The results dem<strong>on</strong>strated that an <str<strong>on</strong>g>accelerometer</str<strong>on</strong>g> <str<strong>on</strong>g>mass</str<strong>on</strong>g> affect some <str<strong>on</strong>g>of</str<strong>on</strong>g> the<br />
modes <str<strong>on</strong>g>of</str<strong>on</strong>g> a structure while other modes remain unchanged. Accelerometer<br />
attached near the anti node has larger changes in natural frequency. Thus, the<br />
mode shapes for that particular mode also show significant changes. However for<br />
<str<strong>on</strong>g>accelerometer</str<strong>on</strong>g> attached near a nodal line <str<strong>on</strong>g>of</str<strong>on</strong>g> a particular mode <str<strong>on</strong>g>of</str<strong>on</strong>g> the structure,<br />
110
<strong>Jurnal</strong> <strong>Mekanikal</strong>, December 2009<br />
numerical results showed that the natural frequencies <str<strong>on</strong>g>of</str<strong>on</strong>g> the mode remain<br />
unchanged. As a result, no significant changes <str<strong>on</strong>g>of</str<strong>on</strong>g> mode shape at this particular<br />
mode.<br />
It was noted that <str<strong>on</strong>g>accelerometer</str<strong>on</strong>g> <str<strong>on</strong>g>mass</str<strong>on</strong>g> should not be more than <strong>on</strong>e-tenth <str<strong>on</strong>g>of</str<strong>on</strong>g><br />
the <str<strong>on</strong>g>mass</str<strong>on</strong>g> <str<strong>on</strong>g>of</str<strong>on</strong>g> the structure [6]. This study showed that this rule may not be reliable<br />
for certain vibrati<strong>on</strong> mode. The vibrati<strong>on</strong> mode that was <str<strong>on</strong>g>effect</str<strong>on</strong>g> by <str<strong>on</strong>g>mass</str<strong>on</strong>g> loading<br />
must be corrected by using correcti<strong>on</strong> method presented in reference [7]. Thus, the<br />
lightest <str<strong>on</strong>g>accelerometer</str<strong>on</strong>g> <str<strong>on</strong>g>mass</str<strong>on</strong>g> as possible has to be used to decrease the <str<strong>on</strong>g>mass</str<strong>on</strong>g><br />
loading <str<strong>on</strong>g>effect</str<strong>on</strong>g>.<br />
It can be c<strong>on</strong>cluded that the <str<strong>on</strong>g>effect</str<strong>on</strong>g> <str<strong>on</strong>g>of</str<strong>on</strong>g> <str<strong>on</strong>g>accelerometer</str<strong>on</strong>g> <str<strong>on</strong>g>mass</str<strong>on</strong>g> depends <strong>on</strong> the<br />
locati<strong>on</strong> <str<strong>on</strong>g>of</str<strong>on</strong>g> the <str<strong>on</strong>g>accelerometer</str<strong>on</strong>g>, vibrati<strong>on</strong> mode and magnitude <str<strong>on</strong>g>of</str<strong>on</strong>g> the <str<strong>on</strong>g>accelerometer</str<strong>on</strong>g><br />
<str<strong>on</strong>g>mass</str<strong>on</strong>g>. The studies <strong>on</strong> the <str<strong>on</strong>g>effect</str<strong>on</strong>g> <str<strong>on</strong>g>of</str<strong>on</strong>g> the <str<strong>on</strong>g>accelerometer</str<strong>on</strong>g> <str<strong>on</strong>g>mass</str<strong>on</strong>g> <strong>on</strong> the dynamic<br />
properties <str<strong>on</strong>g>of</str<strong>on</strong>g> the structures indicate that both natural frequency and mode shapes<br />
should be c<strong>on</strong>sidered.<br />
REFERENCES<br />
1. Døssing, O. 1991, Predicti<strong>on</strong> <str<strong>on</strong>g>of</str<strong>on</strong>g> Transcducer Mass Loading Effects and<br />
Identificati<strong>on</strong> <str<strong>on</strong>g>of</str<strong>on</strong>g> Dynamic Mass. Proceeding <str<strong>on</strong>g>of</str<strong>on</strong>g> the 9 th IMAC, Schenectady<br />
NY, Uni<strong>on</strong> College. 306-311<br />
2. Baldanzinni N and Pierini. M. 2002; An Assesment <str<strong>on</strong>g>of</str<strong>on</strong>g> Transducer Mass<br />
Loading Effects <strong>on</strong> the Parameters <str<strong>on</strong>g>of</str<strong>on</strong>g> an Experimental Statistical Energy<br />
Analysis (SEA) Model. Mechanical System and Signal Processing, Firenze,<br />
16(5): 885-903<br />
3. Døssing, O. Structural Testing Part 1 : Mechanical Mobility Measurement.<br />
Bruel and Kjaer.<br />
4. Ashory. M. R, 2002, Assessment <str<strong>on</strong>g>of</str<strong>on</strong>g> the <str<strong>on</strong>g>mass</str<strong>on</strong>g> loading <str<strong>on</strong>g>effect</str<strong>on</strong>g>s <str<strong>on</strong>g>of</str<strong>on</strong>g><br />
<str<strong>on</strong>g>accelerometer</str<strong>on</strong>g>s in modal testing, Proceeding <str<strong>on</strong>g>of</str<strong>on</strong>g> the 20 th Internati<strong>on</strong>al Modal<br />
Analysis C<strong>on</strong>ference: 1027-1031.<br />
5. Blevins. D. R., 1979 Formula for Natural Frequency and Mode Shape, Van<br />
NastraudReinhold Company, New York.<br />
6. Mark, S and Torben. R.L Piezoeleric, 1987, Accelerometer and Vibrati<strong>on</strong><br />
Preamplifier Theory and Applicati<strong>on</strong> Handbook, Bruel and Kjaer, Denmark<br />
7. Cakar. 0 and Sanliturk, K.Y. 2005; Eliminati<strong>on</strong> <str<strong>on</strong>g>of</str<strong>on</strong>g> Transducer Mass Loading<br />
Effects from Frequency Resp<strong>on</strong>se Functi<strong>on</strong>s. Mechanical System and Signal<br />
Processing, 19 : 87-104.<br />
111