Energy in Simple Harmonic Motion - Ryerson Department of Physics
Energy in Simple Harmonic Motion - Ryerson Department of Physics
Energy in Simple Harmonic Motion - Ryerson Department of Physics

Create successful ePaper yourself
Turn your PDF publications into a flip-book with our unique Google optimized e-Paper software.
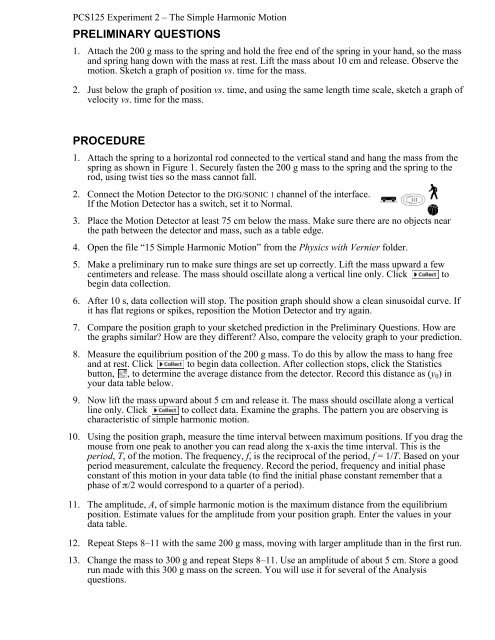
PCS125 Experiment 2 – The <strong>Simple</strong> <strong>Harmonic</strong> <strong>Motion</strong><br />
PRELIMINARY QUESTIONS<br />
1. Attach the 200 g mass to the spr<strong>in</strong>g and hold the free end <strong>of</strong> the spr<strong>in</strong>g <strong>in</strong> your hand, so the mass<br />
and spr<strong>in</strong>g hang down with the mass at rest. Lift the mass about 10 cm and release. Observe the<br />
motion. Sketch a graph <strong>of</strong> position vs. time for the mass.<br />
2. Just below the graph <strong>of</strong> position vs. time, and us<strong>in</strong>g the same length time scale, sketch a graph <strong>of</strong><br />
velocity vs. time for the mass.<br />
PROCEDURE<br />
1. Attach the spr<strong>in</strong>g to a horizontal rod connected to the vertical stand and hang the mass from the<br />
spr<strong>in</strong>g as shown <strong>in</strong> Figure 1. Securely fasten the 200 g mass to the spr<strong>in</strong>g and the spr<strong>in</strong>g to the<br />
rod, us<strong>in</strong>g twist ties so the mass cannot fall.<br />
2. Connect the <strong>Motion</strong> Detector to the DIG/SONIC 1 channel <strong>of</strong> the <strong>in</strong>terface.<br />
If the <strong>Motion</strong> Detector has a switch, set it to Normal.<br />
3. Place the <strong>Motion</strong> Detector at least 75 cm below the mass. Make sure there are no objects near<br />
the path between the detector and mass, such as a table edge.<br />
4. Open the file “15 <strong>Simple</strong> <strong>Harmonic</strong> <strong>Motion</strong>” from the <strong>Physics</strong> with Vernier folder.<br />
5. Make a prelim<strong>in</strong>ary run to make sure th<strong>in</strong>gs are set up correctly. Lift the mass upward a few<br />
centimeters and release. The mass should oscillate along a vertical l<strong>in</strong>e only. Click to<br />
beg<strong>in</strong> data collection.<br />
6. After 10 s, data collection will stop. The position graph should show a clean s<strong>in</strong>usoidal curve. If<br />
it has flat regions or spikes, reposition the <strong>Motion</strong> Detector and try aga<strong>in</strong>.<br />
7. Compare the position graph to your sketched prediction <strong>in</strong> the Prelim<strong>in</strong>ary Questions. How are<br />
the graphs similar How are they different Also, compare the velocity graph to your prediction.<br />
8. Measure the equilibrium position <strong>of</strong> the 200 g mass. To do this by allow the mass to hang free<br />
and at rest. Click to beg<strong>in</strong> data collection. After collection stops, click the Statistics<br />
button, , to determ<strong>in</strong>e the average distance from the detector. Record this distance as (y 0 ) <strong>in</strong><br />
your data table below.<br />
9. Now lift the mass upward about 5 cm and release it. The mass should oscillate along a vertical<br />
l<strong>in</strong>e only. Click to collect data. Exam<strong>in</strong>e the graphs. The pattern you are observ<strong>in</strong>g is<br />
characteristic <strong>of</strong> simple harmonic motion.<br />
10. Us<strong>in</strong>g the position graph, measure the time <strong>in</strong>terval between maximum positions. If you drag the<br />
mouse from one peak to another you can read along the x-axis the time <strong>in</strong>terval. This is the<br />
period, T, <strong>of</strong> the motion. The frequency, f, is the reciprocal <strong>of</strong> the period, f = 1/T. Based on your<br />
period measurement, calculate the frequency. Record the period, frequency and <strong>in</strong>itial phase<br />
constant <strong>of</strong> this motion <strong>in</strong> your data table (to f<strong>in</strong>d the <strong>in</strong>itial phase constant remember that a<br />
phase <strong>of</strong> π/2 would correspond to a quarter <strong>of</strong> a period).<br />
11. The amplitude, A, <strong>of</strong> simple harmonic motion is the maximum distance from the equilibrium<br />
position. Estimate values for the amplitude from your position graph. Enter the values <strong>in</strong> your<br />
data table.<br />
12. Repeat Steps 8–11 with the same 200 g mass, mov<strong>in</strong>g with larger amplitude than <strong>in</strong> the first run.<br />
13. Change the mass to 300 g and repeat Steps 8–11. Use an amplitude <strong>of</strong> about 5 cm. Store a good<br />
run made with this 300 g mass on the screen. You will use it for several <strong>of</strong> the Analysis<br />
questions.