HERALD INVESTMENT TRUST plc ANNUAL REPORT ...
HERALD INVESTMENT TRUST plc ANNUAL REPORT ...
HERALD INVESTMENT TRUST plc ANNUAL REPORT ...

Create successful ePaper yourself
Turn your PDF publications into a flip-book with our unique Google optimized e-Paper software.
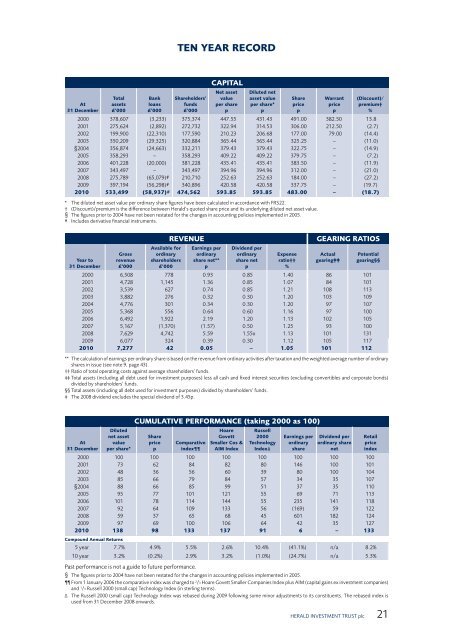
TEN YEAR RECORD<br />
At<br />
31 December<br />
Total<br />
assets<br />
£’000<br />
Bank<br />
loans<br />
£’000<br />
Shareholders’<br />
funds<br />
£’000<br />
CAPITAL<br />
Net asset<br />
value<br />
per share<br />
p<br />
Diluted net<br />
asset value<br />
per share*<br />
p<br />
Share<br />
price<br />
p<br />
Warrant<br />
price<br />
p<br />
(Discount)/<br />
premium†<br />
%<br />
2000 378,607 (3,233) 375,374 447.55 431.43 491.00 382.50 13.8<br />
2001 275,624 (2,892) 272,732 322.94 314.53 306.00 212.50 (2.7)<br />
2002 199,900 (22,310) 177,590 210.23 206.68 177.00 79.00 (14.4)<br />
2003 350,209 (29,325) 320,884 365.44 365.44 325.25 – (11.0)<br />
§2004 356,874 (24,663) 332,211 379.43 379.43 322.75 – (14.9)<br />
2005 358,293 – 358,293 409.22 409.22 379.75 – (7.2)<br />
2006 401,228 (20,000) 381,228 435.41 435.41 383.50 – (11.9)<br />
2007 343,497 – 343,497 394.96 394.96 312.00 – (21.0)<br />
2008 275,789 (65,079)# 210,710 252.63 252.63 184.00 – (27.2)<br />
2009 397,194 (56,298)# 340,896 420.58 420.58 337.75 – (19.7)<br />
2010 533,499 (58,937)# 474,562 593.85 593.85 483.00 – (18.7)<br />
* The diluted net asset value per ordinary share figures have been calculated in accordance with FRS22.<br />
† (Discount)/premium is the difference between Herald’s quoted share price and its underlying diluted net asset value.<br />
§ The figures prior to 2004 have not been restated for the changes in accounting policies implemented in 2005.<br />
# Includes derivative financial instruments.<br />
Year to<br />
31 December<br />
Gross<br />
revenue<br />
£’000<br />
Available for<br />
ordinary<br />
shareholders<br />
£’000<br />
REVENUE<br />
Earnings per<br />
ordinary<br />
share net**<br />
p<br />
Dividend per<br />
ordinary<br />
share net<br />
p<br />
Expense<br />
ratio††<br />
%<br />
GEARING RATIOS<br />
Actual<br />
gearing‡‡<br />
Potential<br />
gearing§§<br />
2000 6,508 778 0.93 0.85 1.40 86 101<br />
2001 4,728 1,145 1.36 0.85 1.07 84 101<br />
2002 3,539 627 0.74 0.85 1.21 108 113<br />
2003 3,882 276 0.32 0.30 1.20 103 109<br />
2004 4,776 301 0.34 0.30 1.20 97 107<br />
2005 5,368 556 0.64 0.60 1.16 97 100<br />
2006 6,492 1,922 2.19 1.20 1.13 102 105<br />
2007 5,167 (1,370) (1.57) 0.50 1.25 93 100<br />
2008 7,629 4,742 5.59 1.55‡ 1.13 101 131<br />
2009 6,077 324 0.39 0.30 1.12 105 117<br />
2010 7,277 42 0.05 – 1.05 101 112<br />
** The calculation of earnings per ordinary share is based on the revenue from ordinary activities after taxation and the weighted average number of ordinary<br />
shares in issue (see note 9, page 43).<br />
†† Ratio of total operating costs against average shareholders’ funds.<br />
‡‡ Total assets (including all debt used for investment purposes) less all cash and fixed interest securities (excluding convertibles and corporate bonds)<br />
divided by shareholders’ funds.<br />
§§ Total assets (including all debt used for investment purposes) divided by shareholders’ funds.<br />
‡ The 2008 dividend excludes the special dividend of 3.45p.<br />
At<br />
31 December<br />
Diluted<br />
net asset<br />
value<br />
per share*<br />
CUMULATIVE PERFORMANCE (taking 2000 as 100)<br />
Share<br />
price<br />
p<br />
Comparative<br />
index<br />
Hoare<br />
Govett<br />
Smaller Cos &<br />
AIM Index<br />
Russell<br />
2000<br />
Technology<br />
Index∆<br />
Earnings per<br />
ordinary<br />
share<br />
Dividend per<br />
ordinary share<br />
net<br />
2000 100 100 100 100 100 100 100 100<br />
2001 73 62 84 82 80 146 100 101<br />
2002 48 36 56 60 39 80 100 104<br />
2003 85 66 79 84 57 34 35 107<br />
§2004 88 66 85 99 51 37 35 110<br />
2005 95 77 101 121 55 69 71 113<br />
2006 101 78 114 144 55 235 141 118<br />
2007 92 64 109 133 56 (169) 59 122<br />
2008 59 37 65 68 45 601 182 124<br />
2009 97 69 100 106 64 42 35 127<br />
2010 138 98 133 137 91 6 – 133<br />
Compound Annual Returns<br />
5 year 7.7% 4.9% 5.5% 2.6% 10.4% (41.1%) n/a 8.2%<br />
10 year 3.2% (0.2%) 2.9% 3.2% (1.0%) (24.7%) n/a 5.3%<br />
Past performance is not a guide to future performance.<br />
§ The figures prior to 2004 have not been restated for the changes in accounting policies implemented in 2005.<br />
From 1 January 2006 the comparative index was charged to 2 /3 Hoare Govett Smaller Companies Index plus AIM (capital gains ex investment companies)<br />
and 1 /3 Russell 2000 (small cap) Technology Index (in sterling terms).<br />
∆ The Russell 2000 (small cap) Technology Index was rebased during 2009 following some minor adjustments to its constituents. The rebased index is<br />
used from 31 December 2008 onwards.<br />
<strong>HERALD</strong> <strong>INVESTMENT</strong> <strong>TRUST</strong> <strong>plc</strong> 21<br />
Retail<br />
price<br />
index