Marine Industries Global Market Analysis - Marine Institute
Marine Industries Global Market Analysis - Marine Institute
Marine Industries Global Market Analysis - Marine Institute

Create successful ePaper yourself
Turn your PDF publications into a flip-book with our unique Google optimized e-Paper software.
<strong>Marine</strong> industries<br />
global market analysis<br />
March 2005<br />
Douglas-Westwood Limited<br />
<strong>Marine</strong> Foresight Series<br />
No.1
“to undertake, to co-ordinate, to promote and to assist in marine research and<br />
development and to provide such services related to marine research and<br />
development that, in the opinion of the institute, will promote economic<br />
development and create employment and protect the marine environment”<br />
<strong>Marine</strong> <strong>Institute</strong> Act 1991.<br />
<strong>Marine</strong> Research and Innovation Strategy<br />
This report is one of a series prepared at the request of the <strong>Marine</strong> <strong>Institute</strong> as a contribution to the development<br />
of a comprehensive National <strong>Marine</strong> Research and Innovative Strategy (2006-2012). This strategy being prepared<br />
through the course of 2005 will identify the key actions needed to provide sustainable growth and development<br />
opportunites that will contribute to socio-economic progress and the protection of the marine environment. This<br />
report is designed to identify climate-induced impacts, and necessary related actions, that Foresight/Stateholder<br />
groups will have to take into account in preparing future R&D plans and programmes.<br />
ISSN: 1649-590X<br />
Further copies of this publication may be obtained from:<br />
<strong>Marine</strong> <strong>Institute</strong>,<br />
Galway Technology Park,<br />
Parkmore,<br />
Galway,<br />
Ireland.<br />
Alternatively you can download a PDF version from www.marine.ie
Contents<br />
1 Douglas-Westwood – Company Background 7<br />
2 Introduction & Objectives 9<br />
3 Summary & Conclusions 11<br />
4 Methodology & Definitions 31<br />
5 Long-Term Factors 41<br />
6 Shipping & Transport 51<br />
7 <strong>Marine</strong> Commerce 57<br />
8 Ports 61<br />
9 Cruise Industry 65<br />
10 <strong>Marine</strong> Tourism 69<br />
11 Ocean Survey 73<br />
12 Submarine Telecoms 79<br />
13 Fishing 81<br />
14 <strong>Marine</strong> Aquaculture 85<br />
15 Seaweed 89<br />
16 Seafood Processing 91<br />
17 Offshore Oil & Gas 95<br />
18 <strong>Marine</strong> Renewable Energy 101<br />
19 Minerals & Aggregates 105<br />
20 Shipbuilding 107<br />
21 <strong>Marine</strong> Equipment 111<br />
22 <strong>Marine</strong> IT 113<br />
23 <strong>Marine</strong> Biotechnology 117<br />
24 Education & Training 121<br />
25 Research & Development 123<br />
The information contained in this document is believed to be accurate, but no representation or warranty, express or implied, is made by Douglas-Westwood Limited as to the<br />
completeness, accuracy or fairness of any information contained in this document, and we do not accept any responsibility in relation to such information whether fact, opinion or<br />
conclusion that the addressee may draw.<br />
Douglas-Westwood Limited, St Andrew’s House, Station Road East, Canterbury, Kent, CT1 2WD, UK.<br />
Telephone: +44 1227 780 999 Facsimile: +44 1227 780 880 e-mail: admin@dw-1.com www.dw-1.com
2 MARINE INDUSTRIES GLOBAL MARKET ANALYSIS
MARINE INDUSTRIES GLOBAL MARKET ANALYSIS<br />
3<br />
Figures<br />
Figure 3.1: World <strong>Marine</strong> Industry Totals 2005–2009 (€ billion) 10<br />
Figure 3.2: World <strong>Marine</strong> Industry Sector Totals 2005–2009 (€ billion) 13<br />
Figure 4.1: Shipbuilding Expressed in € and $ 38<br />
Figure 6.1: Tonne.miles and Charter Rates 51<br />
Figure 6.2: Shipping – World <strong>Market</strong> 51<br />
Figure 6.3: Shipping – Regional Segmentation 2005–2009 52<br />
Figure 6.4: Shipping Rates 2001–4 52<br />
Figure 6.5: Danish Shipowners Earnings 2003 53<br />
Figure 7.1: <strong>Marine</strong> Commerce – World <strong>Market</strong> 57<br />
Figure 7.2: <strong>Marine</strong> Commerce – Regional Segmentation 2005–2009 57<br />
Figure 7.3: <strong>Marine</strong> Commerce Cluster (London) 59<br />
Figure 8.1: Ports – World <strong>Market</strong> 61<br />
Figure 8.2: Ports – Regional Segmentation 2005–2009 61<br />
Figure 8.3: Chinese Port Container Throughput 63<br />
Figure 9.1: Cruise – World <strong>Market</strong> 65<br />
Figure 9.2: Cruise – Regional Segmentation 2005–2009 66<br />
Figure 9.3: European Cruise Destinations (million passengers) 66<br />
Figure 10.1: <strong>Marine</strong> Tourism – World <strong>Market</strong> 69<br />
Figure 11.1: Ocean Survey – World <strong>Market</strong> 73<br />
Figure 11.2: Ocean Survey – Regional Segmentation 2005–2009 73<br />
Figure 11.3: Ocean Survey – European Segmentation 74<br />
Figure 11.4: Ocean Survey – Sectors 74<br />
Figure 12.1: Submarine Telecoms – World <strong>Market</strong> 79<br />
Figure 12.2: Submarine Telecoms – Regional Segmentation 2005–2009 79<br />
Figure 13.1: Fishing and Aquaculture Production 81<br />
Figure 13.2: Fishing – World <strong>Market</strong> 81<br />
Figure 13.3: Fishing – Regional Segmentation 2005–2009 82<br />
Figure 14.1: <strong>Marine</strong> Aquaculture – World <strong>Market</strong> 85<br />
Figure 14.2: <strong>Marine</strong> Aquaculture – Regional Segmentation 2005–2009 85<br />
Figure 15.1: Seaweed – World <strong>Market</strong> 89<br />
Figure 15.2: Seaweed – Regional Segmentation 2005–2009 89<br />
Figure 16.1: Seafood Processing – World <strong>Market</strong> 91<br />
Figure 16.2: Seafood Processing – Regional Segmentation 2005–2009 91
4 MARINE INDUSTRIES GLOBAL MARKET ANALYSIS<br />
Figure 17.1: Offshore Oil & Gas – <strong>Global</strong> Expenditure 95<br />
Figure 17.2: Offshore Oil & Gas – Regional Segmentation 2005–2009 95<br />
Figure 17.3: Offshore Oil & Gas – European Expenditure 96<br />
Figure 17.4: Subsea Field Development Costs 97<br />
Figure 17.5: Deepwater Oil & Gas Production 98<br />
Figure 17.6: Floating Production Expenditure Forecast 99<br />
Figure 18.1: <strong>Marine</strong> Renewable Energy – Expenditure 101<br />
Figure 18.2: Renewable Energy – Regional Segmentation 2005–2009 101<br />
Figure 18.3: Offshore Windpower – European Capital Expenditure 102<br />
Figure 18.4: Offshore Wind Turbine Size 102<br />
Figure 19.1: Minerals & Aggregates – World <strong>Market</strong> 105<br />
Figure 19.2: Minerals & Aggregates – Regional Segmentation 2005–2009 105<br />
Figure 20.1: Shipbuilding – World <strong>Market</strong> 107<br />
Figure 20.2: Shipbuilding – Main Regional Segmentation 2005–2009 107<br />
Figure 21.1: <strong>Marine</strong> Equipment – World <strong>Market</strong> 111<br />
Figure 21.2: <strong>Marine</strong> Equipment – Regional Segmentation 2005–2009 111<br />
Figure 21.3: Typical Ship Cost Segmentation 112<br />
Figure 22.1: <strong>Marine</strong> IT – Major Sectors 113<br />
Figure 22.2: <strong>Marine</strong> IT – World <strong>Market</strong> 113<br />
Figure 22.3: <strong>Marine</strong> IT – Regional Segmentation 2005–2009 114<br />
Figure 23.1: <strong>Marine</strong> Biotechnology – World <strong>Market</strong> 117<br />
Figure 24.1: Education & Training – World <strong>Market</strong> 121<br />
Figure 25.2: R&D – Regional Segmentation 2005–2009 123<br />
Figure 25.3: <strong>Marine</strong> R&D by Sector 124<br />
Figure 25.4: <strong>Marine</strong> R&D by Region 124
MARINE INDUSTRIES GLOBAL MARKET ANALYSIS<br />
5<br />
Tables<br />
Table 3.1: World <strong>Marine</strong> Sectors – Value and Growth (Ranking 2005–09) 24<br />
Table 3.2: <strong>Marine</strong> Sector Values – Euros and US dollars (Ranked by 2004 values) 28<br />
Table 6.1: Shipping – World <strong>Market</strong> 52<br />
Table 6.2: Top 25 Shipowners – Tonnage 54<br />
Table 6.3: Controlled & Registered Fleets 55<br />
Table 6.4: Annual Average Growth Rate (%) 56<br />
Table 7.1: <strong>Marine</strong> Commerce – World <strong>Market</strong> 57<br />
Table 7.2: Companies in London’s <strong>Marine</strong> Commerce Cluster 58<br />
Table 8.1: Ports – World <strong>Market</strong> 61<br />
Table 8.2: Top Eight Operators by TEU 62<br />
Table 9.1: Cruise – World <strong>Market</strong> 66<br />
Table 9.2: European Country Passenger Calls 67<br />
Table 9.3: European Ports Passenger Calls 67<br />
Table 9.4: Cruise Ships by Owner (end 2003) 67<br />
Table 10.1: <strong>Marine</strong> Tourism – Industry Segmentation 2003 (€ millions) 69<br />
Table 11.1: Ocean Survey – World <strong>Market</strong> 73<br />
Table 12.1: Submarine Telecoms – World <strong>Market</strong> 79<br />
Table 13.1: Fishing – World <strong>Market</strong> 82<br />
Table 14.1: <strong>Marine</strong> Aquaculture – World <strong>Market</strong> 85<br />
Table 15.1: Seaweed – World <strong>Market</strong> 89<br />
Table 16.1: Seafood Processing – World <strong>Market</strong> 91<br />
Table 17.1: Oil & Gas – Expenditure Totals 95<br />
Table 18.1: <strong>Marine</strong> Renewable Energy – Totals 101<br />
Table 19.2: Electricity Generation Costs 104<br />
Table 19.1: Minerals & Aggregates – World <strong>Market</strong> 105<br />
Table 20.1: Shipbuilding – World <strong>Market</strong> 107<br />
Table 21.1: <strong>Marine</strong> Equipment – World <strong>Market</strong> 111<br />
Table 22.1: <strong>Marine</strong> IT – World <strong>Market</strong> 113<br />
Table 25.1: R&D – World <strong>Market</strong> 123
6 MARINE INDUSTRIES GLOBAL MARKET ANALYSIS<br />
Abbreviations<br />
AUV<br />
BIM<br />
BMF<br />
bn<br />
Capex<br />
CFP<br />
CGT<br />
DGPS<br />
DNA<br />
DWT<br />
EEA<br />
EEZ<br />
EU<br />
FAO<br />
FPSO<br />
FPSS<br />
GDP<br />
GT<br />
GTL<br />
IMPACT<br />
ISM<br />
ISPS<br />
ISL<br />
IT<br />
LPG<br />
M&A<br />
NOAA<br />
OECD<br />
OPEC<br />
Opex<br />
QSP<br />
R&D<br />
RNA<br />
ro-ro<br />
ROV<br />
S&P<br />
SME<br />
TEU<br />
TLP<br />
UNCLOS<br />
UNCTAD<br />
VLCC<br />
VTMS<br />
WTO<br />
Autonomous Underwater Vehicle<br />
Bord Iascaigh Mhara (Irish sea fisheries board)<br />
British <strong>Marine</strong> Federation<br />
Billion<br />
Capital Expenditure<br />
Common Fisheries Policy<br />
Compensated Gross Tonnage<br />
Differential <strong>Global</strong> Positioning<br />
Deoxyribonucleic Acid<br />
Deadweight Tonnage<br />
European Economic Area<br />
Exclusive Economic Zone<br />
European Union<br />
Food and Agriculture Organisation (of the United Nations)<br />
Floating Production Storage and Offloading (Vessel)<br />
Floating Production Semi-submersible<br />
Gross Domestic Product<br />
Gross Tonnes<br />
Gas to Liquids<br />
<strong>Global</strong> Model of Food Supply and Demand for 28 Commodities<br />
International Management Code for the Safe Operation of Ships and for Pollution Prevention<br />
International Ship and Port Facility Security Code<br />
<strong>Institute</strong> of Shipping Economics and Logistics<br />
Information Technology<br />
Liquid Petroleum Gas<br />
Merger & Acquisition<br />
National Oceanographic and Atmospheric Administration<br />
Organisation for Economic Cooperation and Development<br />
Organisation of Petroleum Exporting Countries<br />
Operational Expenditure<br />
Quality Seafood Product<br />
Research & Development<br />
Ribonucleic Acid<br />
Roll-on/roll-off (Road Transport Ferries)<br />
Remotely Operated Vehicle<br />
Survey and Positioning<br />
Small or Medium Sized Enterprise<br />
Twenty Foot Equivalent Units (Container)<br />
Tension Leg Platform<br />
United Nations Conference on the Law Of the Sea<br />
United Nations Conference on Trade and Development<br />
Very Large Crude Carrier (“super tanker”)<br />
Vessel Traffic Management System<br />
World Trade Organisation
MARINE INDUSTRIES GLOBAL MARKET ANALYSIS<br />
7<br />
1 Douglas–Westwood<br />
1.1 COMPANY BACKGROUND<br />
Douglas-Westwood Limited is an independent consultancy that carries out strategic<br />
business research, market modelling and analysis.Work is primarily commissioned<br />
business research for the international energy and marine industries, their suppliers<br />
and investors. Since its formation in 1990, DWL has completed over 340 projects,<br />
involving 24 industrial marine sectors worldwide.The firm is UK-based but<br />
results of its research is used by clients in 32 countries. Specific marine sector<br />
clients range from government agencies worldwide to shipbuilders and international<br />
marine equipment suppliers, from the offshore oil & gas majors to renewable<br />
energy companies.<br />
Douglas-Westwood’s major published work ranges from definitive technoeconomic<br />
sector studies on <strong>Marine</strong> Renewable Energy to <strong>Marine</strong> Propulsion<br />
and Ocean Survey.<br />
Douglas-Westwood Limited www.dw-1.com
8 MARINE INDUSTRIES GLOBAL MARKET ANALYSIS
MARINE INDUSTRIES GLOBAL MARKET ANALYSIS<br />
9<br />
2 Introduction & Objectives<br />
2.1 OBJECTIVES<br />
The <strong>Marine</strong> <strong>Institute</strong> is the national agency charged with co-ordinating, supporting<br />
and undertaking marine research and development in Ireland.The <strong>Institute</strong> aims to<br />
maximise the contribution of the marine resource to sustainable economic<br />
development and employment growth.<br />
The <strong>Institute</strong> is embarking on the development of a new National <strong>Marine</strong> Research<br />
& Innovation Strategy for the <strong>Marine</strong> Sector in Ireland.This strategy will address the<br />
period 2006-2012.<br />
This report was commissioned by the <strong>Marine</strong> <strong>Institute</strong> and completed in March<br />
2005. Its aims are to act as an input to the strategy development process and<br />
specifically to provide the following:<br />
• An estimate of the global market for marine activities in 2004 for sub-sectors<br />
defined by the <strong>Institute</strong>.<br />
• An estimate of the Irish share of the market.<br />
• An assessment of regional market trends and outturns over the period 1999-2004.<br />
• An estimate of the global market and growth prospects by sub-sector over the<br />
period 2005–2009.<br />
• Comments on factors that will impact in the longer term – to 2012.<br />
2.2 LONG-TERM TRENDS<br />
Most business forecasting is based on five years, i.e. 2005 – 2009 for which this report<br />
gives quantitive forecasts.<br />
We believe that the major factors that will impact on the marine sector over the<br />
period to 2012 are as follows:<br />
• Political & economic change.<br />
• <strong>Global</strong>isation.<br />
• Population growth & demographic change.<br />
• Energy supply and demand, and prices.<br />
• Environmental concerns & responses.<br />
• <strong>Global</strong> terrorism – threats & responses.
10 MARINE INDUSTRIES GLOBAL MARKET ANALYSIS<br />
It is important to recognise that to some extent, all of the above are linked either in<br />
cause or effect. Furthermore many of these major factors are often regarded as being<br />
outside the normal remits of forecasting. However, result from long-term trends<br />
which provide a backdrop to this report. Our overall view on these is as follows:<br />
<strong>Global</strong>isation will continue to be driven by the lower costs of the developing<br />
countries and the ageing of populations in the developed world.This will result in an<br />
increasing demand for commodity feedstocks, and for energy – particularly oil and<br />
liquid fuels for transportation, perhaps increasingly derived from gas.<br />
Energy supply – we believe that oil supplies have a potential to peak sometime after<br />
2013 and if this occurs the consequences could be serious for world economic<br />
growth. Some energy prices have already increased dramatically over the past three<br />
years and in the light of such increases renewable energy could be a good long-term<br />
investment.<br />
Growing industrialisation is likely to have environmental impact and result in<br />
increasing expenditure on remedial/preventative measures. However, we note that<br />
there is already some awareness in China that their long-term development cannot be<br />
based on the Western model.<br />
Growing populations in the Middle East could, unless expectations are managed,<br />
result in political change and further fuel political instability.<br />
Disruption – during the last half of the 20th century a major disruption occurred<br />
every five to seven years – it is unlikely that the period 2005–2012 will pass<br />
without another.
MARINE INDUSTRIES GLOBAL MARKET ANALYSIS<br />
11<br />
3 Summary & Conclusions<br />
3.1 MARKET SEGMENTATION<br />
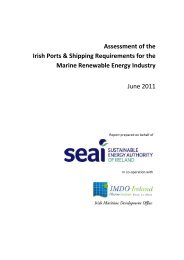
Figure 3.1: World <strong>Marine</strong> Industry Totals 2005–2009 (€ billion)<br />
Services 2454<br />
Resources 1306<br />
Shipping 1437<br />
<strong>Marine</strong> Commerce 29<br />
Ports 136<br />
Cruise Industry 67<br />
<strong>Marine</strong> Tourism 928<br />
Ocean Survey 10<br />
Submarine Telecoms 12<br />
<strong>Marine</strong> Fisheries 802 Energy 489<br />
Fishing 250 Renewable 13<br />
Aquaculture 134 Oil & Gas 476<br />
Seaweed 33<br />
Processing 385<br />
Minerals &<br />
Aggregates 15<br />
Manufacturing 541<br />
Shipping Building 155 <strong>Marine</strong> IT 16<br />
<strong>Marine</strong> Equipment 358 <strong>Marine</strong> Biotechnology 12<br />
Education & Research 62<br />
Education & Training 8 Research & Development 54<br />
The world marine industry can be divided into four main areas. After some major<br />
items of double counting have been removed we estimate that these have the<br />
following values over the period 2005–2009:<br />
• Services. Valued at €2,454bn over the period 2005–2009 – dominated by the<br />
shipping industry and tourism.<br />
• Resources. Valued at €1,306bn over the period 2005–2009 – dominated by<br />
Fisheries and Energy. 1<br />
• Manufacturing. Valued at €541bn over the period 2005–2009 – mainly production<br />
of equipment for the Shipbuilding and Oil & Gas industries.<br />
• Education and Research. Valued at €62bn over the period 2005–2009 – activities<br />
associated with Education & Training and R&D for specific sub-sectors.<br />
3.2 KEY DRIVERS OF CHANGE<br />
Growth of the Chinese economy, and to a lesser extent other developing economies, has<br />
caused considerable increases in both their demand for commodities and their exports.<br />
The result has been an unprecedented growth in demand for shipping – large amounts<br />
of new tonnage have been ordered and will be delivered in 2005–6.The question for<br />
the future is whether there will then be excess capacity and depressed rates.<br />
1<br />
We exclude the value of the energy produced.
12 MARINE INDUSTRIES GLOBAL MARKET ANALYSIS<br />
The increased demand for commodities has resulted in supply shortages and large<br />
price rises in crude oil, steel and other metals.<br />
The US has been importing increasing amounts of goods from China and its growing<br />
balance of payments deficit has resulted in a fall in the value of the US dollar against<br />
the Euro which has undermined Eurozone companies’ competitiveness.<br />
<strong>Global</strong>isation and the growth of low-cost manufacturing centres (China, India,<br />
E. Europe) is having serious implications for developed countries as it becomes<br />
increasingly necessary for some companies to re-locate production in order to remain<br />
internationally competitive.<br />
The aging and declining workforce in developed economies and high wage costs are<br />
also pushing industries into locating production in the developing world.<br />
Although there are costs for the marine industry arising from requirements to comply<br />
with environmental legislation, this also generates benefits for technology providers.<br />
Development of the renewable energy sector is but one example.<br />
<strong>Global</strong> terrorism and associated security needs has resulted in development of new<br />
‘markets’ in provision of products and services.<br />
The strong growth in global energy demand, particularly from the developing<br />
countries has boosted the offshore oil & gas sector but increasingly raises concerns<br />
over a possible limit to oil supplies.<br />
The interplay of the above factors means that marine industries are going through a<br />
period of considerable change and this seems to be the likely pattern in the future.<br />
3.3 WORLD MARKET SECTORS<br />
Of the marine sectors analysed within the report, there are a few that stand out as<br />
either being substantial in today’s market, or that are currently small but set for rapid<br />
growth.The largest market in 2004 was the shipping and transport sector<br />
(€343 billion), a position it will still hold through to 2009. However, it is forecast to<br />
experience a decline in Euro terms over the period to 2009, averaging 1.8% per year<br />
as shipping rates moderate somewhat. At the other end of the scale is the marine<br />
renewable sector, valued in 2004 at only €128 million, but forecast to grow<br />
dramatically, by almost 1,000% during the period, to €5.6 billion.These examples<br />
illustrate the point that very small sectors may contain great opportunity for new<br />
players and activity. Summaries of trends for all sectors are outlined in figure 3.2.
MARINE INDUSTRIES GLOBAL MARKET ANALYSIS<br />
13<br />
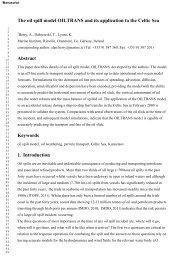
Figure 3.2: World <strong>Marine</strong> Industry Sector Totals 2005–2009 (€ billion)<br />
3.4 SERVICES<br />
SHIPPING & TRANSPORT<br />
Page 51 (€343bn in 2004, €308bn in 2009)<br />
Shipping and Transport is the largest marine sector, within Europe the cluster has<br />
been estimated to comprise 10,000 companies 2 and to form a market worth<br />
€151 billion in 2004.The world market for the same year is estimated at €343<br />
billion. Over 90,000 ships of 100 GT or more are registered and in excess of 50,000<br />
are thought to be trading internationally. Of the 11,412 shipowners & operators<br />
listed, Greece is the largest owner of tonnage. 3<br />
1999–03 2004 2005–09<br />
Irish <strong>Market</strong> €M 5,612 1,000 9,460<br />
UK <strong>Market</strong> €M 61,161 20,442 86,201<br />
Europe <strong>Market</strong> €M 452,186 151,137 637,315<br />
World <strong>Market</strong> €M 1,011,600 342,743 1,436,684<br />
The UN has noted that:“It is generally considered that maritime capabilities,<br />
specifically the ownership of substantial tonnage, are essential for countries’ trade<br />
support and promotion”. 4 It is estimated that more than 90% of world trade tonnage<br />
is transported by sea and seaborne trade has grown by 400% in the past 40 years. Of<br />
particular significance is the container sector, set to grow by a further 400% by 2022.<br />
Shipping is a highly cyclical industry presently enjoying an unprecedented boom,<br />
increasing 127% from 1999 (€151 billion) to 2004. However, it is likely that by 2006<br />
additional capacity entering the market will cause rates to fall and we expect a return<br />
to slower long-term trends from 2007.Therefore, by 2009 the market is forecast to be<br />
valued at €308 billion, representing an average growth rate from 2005 of –1.8%.<br />
2<br />
Lloyd’s List p1, 27 Jan 2004.<br />
3<br />
Lloyd’s Register – Fairplay ‘World Shipping Directory’ 2004–05’<br />
4<br />
‘Review of <strong>Marine</strong> Transport 2003’ United Nations Conference on Trade and Development (UNCTAD)
14 MARINE INDUSTRIES GLOBAL MARKET ANALYSIS<br />
1999–03 2004 2005–09<br />
Irish <strong>Market</strong> €M 832 150 780<br />
UK <strong>Market</strong> €M 10,429 1,842 9,595<br />
Europe <strong>Market</strong> €M 58,695 10,478 54,569<br />
World <strong>Market</strong> €M 141,979 25,017 135,526<br />
PORTS<br />
Page 61 (€25bn in 2004, €29bn in 2009)<br />
The Ports sector worldwide was worth €25bn in 2004 with Europe’s share<br />
amounting to €10.5 billion.There are over 8,000 ports & terminals worldwide<br />
of which some 2,000 are significant. However, the top 50 handle the majority<br />
of business.<br />
Ports have major economic impact. In the case of Rotterdam, in 2003 5,741<br />
persons were associated with cargo handling, 58,739 were in ‘direct port-related<br />
employment’. It is claimed that the port generates indirect employment for<br />
250,000 people.<br />
Over the period 1999–2001 the sector increased to €31 billion, returning to previous<br />
levels of €25 billion by 2004. Increasing seaborne trade and containerisation means<br />
strong growth is underway with the sector forecast to be worth €29.3 billion in 2009,<br />
representing 3.2% average annual growth from 2005–2009. However, port congestion<br />
is looming and to tackle this major investments are needed in developing port<br />
infrastructure worldwide.<br />
1999–03 2004 2005–09<br />
Irish <strong>Market</strong> €M 209 55 217<br />
UK <strong>Market</strong> €M 5,636 1,477 5,846<br />
Europe <strong>Market</strong> €M 10,437 2,736 10,826<br />
World <strong>Market</strong> €M 26,092 6,840 28,670<br />
MARINE COMMERCE<br />
Page 57 (€7bn in 2004, €6bn in 2009)<br />
The <strong>Marine</strong> Commerce sector was worth almost €7 billion in 2004, with Europe’s<br />
share constituting €2.7 billion, 40% of world activity.‘<strong>Marine</strong> Commerce’ is perhaps a<br />
better description than the often-used term ‘<strong>Marine</strong> Services’, as the sector ranges<br />
from ship operations, brokering and insurance to specialist publications.<br />
This is a long-term growth sector, although the 2005–2009 average growth rate<br />
shows a decline of 1.8% per year.This is due to a peak in activity in 2004 (and the<br />
continued weakening of the dollar against the Euro) to €6.8 billion, following strong<br />
growth in the previous two years. In 2005 activity returned to previous levels and<br />
looks set for steady growth, with period growth forecast at 7%. Over the entire<br />
reported period, the sector value is set to rise from €4.1 billion in 1999 to<br />
€6.1 billion in 2009. London is still the world’s leading centre, but its position is<br />
increasingly under threat from SE Asia (particularly Singapore). <strong>Marine</strong> commerce is<br />
of major strategic importance as a successful centre tends to cluster decision makers<br />
for many associated activities.
MARINE INDUSTRIES GLOBAL MARKET ANALYSIS<br />
15<br />
OCEAN SURVEY<br />
Page 73 (€2bn in 2004, €2.1bn in 2009)<br />
In 2004 the world value of ocean surveying was €2 billion with Europe representing<br />
€538 million of this.The sector satisfies a continuing need for provision of up-to-date<br />
charts essential for safe navigation. However, the largest commercial activity is in<br />
surveys for the offshore oil & gas industry. Europe is a major player in this high tech<br />
sector, which is dominated by one international company headquartered in the<br />
Netherlands.There is also emerging market potential associated with the<br />
commissioning of EEZ surveys and areas where Ireland has world-class experience<br />
(having completed the world’s largest survey) but has no major commercial player.<br />
1999–03 2004 2005–09<br />
Irish <strong>Market</strong> €M 64 12 54<br />
UK <strong>Market</strong> €M 608 104 517<br />
Europe <strong>Market</strong> €M 3,201 538 2,722<br />
World <strong>Market</strong> €M 11,715 2,013 10,137<br />
The world market exhibits a long-term growth trend (if analysed in US dollars, but is<br />
stable if represented in Euros, due to the decline in value of the dollar over time in<br />
relation to the Euro.)<br />
SUBMARINE TELECOMS<br />
Page 79 (€1bn in 2004, €3bn in 2009)<br />
In 2004 the industry is valued at €1bn, after a €7bn capital expenditure peak in 2001<br />
which was followed by a market collapse in 2001–2.This was due to the combined<br />
effects of the ending of the ‘dotcom’ stock market boom and improvement in<br />
technology which increased cable bandwidth.The collapse also impacted on some oil<br />
& gas service sectors, as cable installation contractors tried to re-deploy resources.<br />
1999–03 2004 2005–09<br />
Irish <strong>Market</strong> €M – – –<br />
UK <strong>Market</strong> €M – – –<br />
Europe <strong>Market</strong> €M 3312 185 1915<br />
World <strong>Market</strong> €M 21,270 1,126 11,646<br />
As a global business that views its markets by oceans, this sector is difficult to segment<br />
by country or region, but the value of the European share in 2004 is €185 million,<br />
constituting 16% of the world. Slow long-term growth is now forecast for submarine<br />
cable installations, to €3bn in 2009, representing average annual growth of 21.8%<br />
from 2005.<br />
MARINE TOURISM<br />
Page 69 (€168bn in 2004, €198bn in 2009)<br />
<strong>Marine</strong> tourism is the second largest marine sector in the world and we estimate its<br />
value to have been €168bn in 2004. <strong>Marine</strong> tourism is defined as angling, coastal and<br />
inland leisure boating, water sports and cruise liner holidays. Europe is an important<br />
market for marine tourism, valued at €72 billion in 2004.<br />
1999–03 2004 2005–09<br />
Irish <strong>Market</strong> €M 709 155 848<br />
UK <strong>Market</strong> €M – – –<br />
Europe <strong>Market</strong> €M 328,302 71,812 392,695<br />
World <strong>Market</strong> €M 762,345 168,189 928,267
16 MARINE INDUSTRIES GLOBAL MARKET ANALYSIS<br />
The marine leisure sector is forecast to enjoy continuing long-term growth in line<br />
with the overall increase in tourism and leisure activity to €198 billion in 2009,<br />
representing 3.3% annual growth from 2005.This is based on the historical trend<br />
exhibited by tourism as a whole (marine and land-based), from an annual value of<br />
€142 billion in 1999.<br />
1999–03 2004 2005–09<br />
Irish <strong>Market</strong> €M – 66 –<br />
UK <strong>Market</strong> €M 5,220 1,104 6,458<br />
Europe <strong>Market</strong> €M 11,178 2,365 13,829<br />
World <strong>Market</strong> €M 54,570 12,000 67,436<br />
CRUISE INDUSTRY<br />
Page 65 (€12bn in 2004, €15bn in 2009)<br />
The world revenues for cruise sector operators was estimated at €12bn in 2004, with<br />
Europe’s share constituting €2.4 billion.The sector offers large potential with major<br />
investments being made in cruise terminals worldwide.Total economic benefit delivered<br />
by the industry is considerable.Although dominated by the US market which accounts<br />
for more than 70% of passengers. It is of note that 2.7 million Europeans took cruise<br />
holidays in 2003 and of these 2 million were in European waters. 5<br />
From being worth €7.7 billion in 1999 the sector has grown by 56%. Further strong<br />
growth is expected globally and regionally, with European cruise passengers increasing<br />
to 4 million in 10 years.There is significant growth of smaller specialised cruises in<br />
Northern European waters, resulting in an overall 4.4% average annual growth during<br />
the forecast period to €14.8 billion in 2009.<br />
In Ireland, ship visits increased from 77 in 2000 to 127 in 2003. Cork and Dublin had<br />
in total 75,124 passenger ‘calls’ in 2004 (compared with Southampton with 536,493 6 )<br />
out of a European total of 4.3 million. 7 Purchases of goods and services in Ireland<br />
totalled €66 million sustaining 484 full time jobs. 8<br />
3.5 MARINE FISHERIES<br />
This area includes capture fishing, marine aquaculture, seaweed and<br />
seafood processing.<br />
1999–03 2004 2005–09<br />
Irish <strong>Market</strong> €M 951 176 788<br />
UK <strong>Market</strong> €M 4,338 678 3,033<br />
Europe <strong>Market</strong> €M 32,313 4,758 21,280<br />
World <strong>Market</strong> €M 362,035 55,983 250,386<br />
FISHING<br />
Page 81 (€56bn in 2004, €49bn in 2009)<br />
World marine capture fisheries production was valued at €56 billion in 2004, with<br />
Europe representing 8% of this (€4.8 billion).This is an important industry with<br />
strong market demand.<br />
5<br />
European Cruise Council 2004 (first statistics).<br />
6<br />
Southampton has a cruise liner terminal and is a turnaround port for a number of cruise liners, thus accounting for the large<br />
number of passenger “calls”.<br />
7<br />
GP Wild reported in ‘Lloyd’s Cruise International’, Aug/Sept 2004.
MARINE INDUSTRIES GLOBAL MARKET ANALYSIS<br />
17<br />
Historically, production value was €67 billion, and is forecast to fall to €49 billion by<br />
2009 as a result of declining catch tonnage worldwide caused by serious resource<br />
problems and resulting quota restrictions.There are some opportunities offered by<br />
‘new’ (previously unexploited) species. Nevertheless, the industry faces a future of<br />
continuing global decline worldwide until a point of sustainability can be reached.<br />
This decline is forecast at a rate of 2.5% per year in Euros (1% in US Dollars).<br />
MARINE AQUACULTURE<br />
Page 85 (€24bn in 2004, €29bn in 2009)<br />
<strong>Marine</strong> aquaculture production was valued at €24bn in 2004, with Europe taking<br />
a relatively small share at €3.5 billion. Environmental issues and scares have at times<br />
depressed demand, within Europe and globally, but the industry has always<br />
recovered quickly. Norway leads European production and benefits from a strong<br />
international brand.<br />
1999–03 2004 2005–09<br />
Irish <strong>Market</strong> €M 496 111 623<br />
UK <strong>Market</strong> €M 2,383 554 3,119<br />
Europe <strong>Market</strong> €M 16,359 3,483 19,621<br />
World <strong>Market</strong> €M 104,220 23,876 134,492<br />
Between 1996 and 2002 tonnage growth was 9% p.a. and $ value growth 4% p.a.<br />
Continuing strong future growth in demand is forecast.There are opportunities for<br />
new species development and research opportunities in a number of areas.<br />
As a whole, the industry is experiencing a long-term growth trend, partially associated<br />
with filling the capture fishing gap, but also due to the low price of its products. (SE<br />
Asia is a low-cost high-volume producer, with annual average forecast growth<br />
expected at 4%, reaching €29 billion in 2009.)<br />
SEAWEED<br />
Page 89 (€6bn in 2004, €7bn in 2009)<br />
The world seaweed value of wild and cultivated product was €6 billion in 2004. In<br />
Europe, seaweed aquaculture has only developed to any commercial extent in France<br />
where wakame is being grown for food, although this is not recorded in international<br />
data. Irish data shows that in 2002 the country’s production was valued at €10<br />
million, but again, this data is not included in international data.<br />
1999–03 2004 2005–09<br />
Irish <strong>Market</strong> €M 10 – –<br />
UK <strong>Market</strong> €M – – –<br />
Europe <strong>Market</strong> €M – – –<br />
World <strong>Market</strong> €M 28,490 5,988 32,746<br />
This surprisingly large sector is dominated by China (which produces 75% but is still<br />
a net importer) and other Asian producers (15%).The farming of seaweed has<br />
expanded rapidly as demand has outstripped the supply available from natural<br />
resources. Commercial harvesting occurs in about 35 countries, both in the Northern<br />
and Southern Hemispheres. 9<br />
8<br />
‘Report to Cruise Ireland’, March 2004. (If applied across all of Europe then a total economic benefit of 3.7bn is suggested).<br />
9<br />
FAO:‘A Guide to the Seaweed Industry’ 2003.
18 MARINE INDUSTRIES GLOBAL MARKET ANALYSIS<br />
At the start of the reported period seaweed production was valued at €6.4 billion,<br />
then dipped in 2000, but the following years have all seen growth, with the 2000<br />
value of production forecast to be reached again in 2006. Forecast annual growth over<br />
the period 2005–2009 is estimated at 3%.<br />
1999–03 2004 2005–09<br />
Irish <strong>Market</strong> €M 1,447 287 1,411<br />
UK <strong>Market</strong> €M 6,721 1,232 6,152<br />
Europe <strong>Market</strong> €M 48,671 8,241 40,901<br />
World <strong>Market</strong> €M 466,254 79,859 384,878<br />
FISH/SEAFOOD PROCESSING<br />
Page 91 (€80bn in 2004, €78 in 2009)<br />
In 2004 the seafood processing industry is estimated to have been worth €80bn.This<br />
is based on the assumption that processing can add up to 100% to the overall value of<br />
the raw product (based on analysis of limited data).The main driver is consumers’<br />
increasing preference for convenience foods, resulting in more value being added to<br />
the raw product.<br />
A considerable export market exists for processed seafoods and high cost European<br />
processors, such as Norway, are greatly aided by the establishment and development of<br />
a premium brand. A challenge for smaller producers such as Ireland is the need to<br />
develop/invest in automation and increase volumes to achieve economies of scale.<br />
Historical and forecast values are based on the stated trends for the fishing and<br />
aquaculture sectors (i.e. the availability of the raw product). As a result the industry is<br />
forecast to decline, but towards the end of the period the impact in the increase of<br />
aquaculture production leads to a slight upturn, but not to levels previously reached.<br />
Forecast average annual growth for 2005–2009 is therefore still negative, but only<br />
marginally so at –0.4%.<br />
3.6 ENERGY<br />
The marine energy sector is dominated by oil and gas, but growth is beginning in the<br />
offshore renewable energy sector.<br />
1999–03 2004 2005–09<br />
Irish <strong>Market</strong> €M 478 114 483<br />
UK <strong>Market</strong> €M 54,699 7,927 30,751<br />
Europe <strong>Market</strong> €M 133,583 19,112 81,681<br />
World <strong>Market</strong> €M 504,110 91,146 475,748<br />
OFFSHORE OIL & GAS<br />
Page 95 (€91bn expenditure in 2004, €99bn in 2009)<br />
Expenditure in 2004 was €91 billion worldwide with Europe accounting for<br />
€19 billion. Offshore oil and gas is probably the world’s largest marine industry in<br />
terms of the value of its output (the oil & gas produced), which we estimate was<br />
some €700bn in 2004.
MARINE INDUSTRIES GLOBAL MARKET ANALYSIS<br />
19<br />
Historically, there was an expenditure peak in 2001 of €100 billion, in part due to<br />
exchange rate differences caused by valuing a dollar-based market in Euros.<br />
Nevertheless, even when valued in Euros, growth is forecast.<br />
The sector is benefiting from a long-term growth in demand and increased oil & gas<br />
prices and gas is growing in importance as a fuel. Shallow water producing regions are<br />
now in decline (although many small fields remain) causing major oil and gas<br />
companies to move to deepwater areas. However, operational spend is still growing in<br />
most regions. As numbers of shallow water fixed platform installations decline there is<br />
an increase in the use of floating production systems and subsea production. All these<br />
drivers are leading to 1.7% growth per year from 2005 to 2009 globally, although<br />
Europe is mature with oil production in long-term decline.<br />
MARINE RENEWABLE ENERGY<br />
Page 101 (€0.1bn in 2004, €6bn in 2009)<br />
This tiny new industry was valued globally at €128 million in 2004, with the vast<br />
majority of this spend in Europe (€121 million).<br />
1999–03 2004 2005–09<br />
Irish <strong>Market</strong> €M 46 – 255<br />
UK <strong>Market</strong> €M 108 109 3,356<br />
Europe <strong>Market</strong> €M 738 121 11103<br />
World <strong>Market</strong> €M 741 128 12,649<br />
It displays the largest growth of any sector and should increase to nearly €6 billion<br />
by 2009, representing 131% average annual growth rate 2005 to 2009 (987% over the<br />
forecast period). 99% of expenditure will be on wind farms with 2,258 turbines<br />
(totalling 7.5 GW) forecast to be installed over the period.There is also embryonic<br />
wave and tidal activity.<br />
Europe will account for 85% of the forecast capital expenditure.The UK will develop<br />
first (with 26% of total expenditure to 2009) then Germany will follow on and<br />
achieve 40% of total five-year expenditure. European technology leads the world, but<br />
the challenge is to reduce costs by use of large 5 MW turbines involving increased<br />
distances from the shore and water depths. Ireland has one development to date, but a<br />
world-class natural resource.<br />
MINERALS & AGGREGATES<br />
Page 105 (€2.7bn in 2004, €3.1bn in 2009)<br />
The world value of the industry is estimated at €2.7 billion in 2004, with Japan<br />
reported to be the largest producer.Within Europe, valued at €1.3 billion in 2004, the<br />
UK dominates, with the industry employing 2,500 people.The sector is dominated<br />
by the production of aggregates which are supplied to local markets, with offshore<br />
1999–03 2004 2005–09<br />
Irish <strong>Market</strong> €M – – –<br />
UK <strong>Market</strong> €M 3,008 672 3,648<br />
Europe <strong>Market</strong> €M 5,761 1,344 6,938<br />
World <strong>Market</strong> €M 11,746 2,741 14,149
20 MARINE INDUSTRIES GLOBAL MARKET ANALYSIS<br />
dredging reducing the need for onshore pits bringing certain environmental benefits.<br />
Historically the sector has displayed steady growth through to 2004, from €2.3 billion<br />
in 1999.The forecast is for growth, averaging 2.7% leading to a value of €3.1 billion<br />
in 2009.<br />
3.7 MANUFACTURING<br />
1999–03 2004 2005–09<br />
Irish <strong>Market</strong> €M 2 0 2<br />
UK <strong>Market</strong> €M 1,001 234 928<br />
Europe <strong>Market</strong> €M 63,913 13,143 52,076<br />
World <strong>Market</strong> €M 183,440 37,746 155,017<br />
SHIPBUILDING<br />
Page 107 (€38bn in 2004, €30bn in 2009)<br />
The shipbuilding industry was valued at €38 billion in 2004, with Europe’s<br />
€13 billion share being significant, some one third of this.<br />
1,430 shipbuilders and repairers are listed worldwide, but there is a history of overinvestment<br />
and subsidy. As a result, Asia dominates the ‘bulk’ vessel market, but the<br />
emergence of China as a shipbuilder now threatens the main players, Japan & Korea.<br />
Europe is associated with higher tech, low volume vessels (cruise, offshore, etc), but<br />
the high value of the Euro has major impact on EU shipbuilders and their suppliers.<br />
Ireland is not a significant player.<br />
From a value of €31.9 billion in 1999 the sector peaked (in Euro terms) in 2002 at<br />
€40 billion.This peak, we believe, will be followed by a return to long-term lower<br />
growth trends, with a market value similar at the end of the forecast period, to the<br />
start of the historic period.Therefore, the forecast annual growth rate for 2005–2009<br />
in Euros is –4%, representing the return to previous levels of activity.<br />
1999–03 2004 2005–09<br />
Irish <strong>Market</strong> €M 1 0 1<br />
UK <strong>Market</strong> €M 571 133 529<br />
Europe <strong>Market</strong> €M 94,721 16,675 73,263<br />
World <strong>Market</strong> €M 355,826 72,871 358,315<br />
MARINE EQUIPMENT<br />
Page 111 (€73bn in 2004, €70bn in 2009)<br />
This is a very large market (€73 billion in 2004) and although other smaller sectors<br />
could also be included there are two main segments:<br />
• Shipbuilding, where items such as propulsion systems & machinery total €21bn<br />
with over 5,000 suppliers listed worldwide.<br />
• Oil & gas sector, where capital items such as platforms, pipelines, subsea equipment,<br />
etc. total €49bn and over 6,000 suppliers are listed worldwide.<br />
The market was worth €64 billion in 1999. Since then, the sector has displayed slight<br />
fluctuations, but a general trend of growth, with forecast value of €70 billion for
MARINE INDUSTRIES GLOBAL MARKET ANALYSIS<br />
21<br />
2009, representing a slight decline of 0.6% annually from 2005 following a peak of<br />
€74 billion in 2006.This is due to a forecast slight decline in shipbuilding.<br />
There is growing technology content and hundreds of high-tech sub-sectors, many of<br />
which offer opportunities.<br />
MARINE IT<br />
Page 113 (€3.4bn in 2004, €3.4bn in 2009)<br />
In 2004 the world value of <strong>Marine</strong> IT was €3.6 billion. Europe’s share was<br />
€1.4 billion, amounting to nearly 40% of the world market.<br />
There are more than 500 suppliers of ‘marine computing’ worldwide (mainly SMEs,<br />
plus many leisure sector players). IT hardware & software applies to, and is embedded<br />
in all aspects of marine activity so it is difficult to value.The major sectors are ship<br />
operations (e.g. integrated bridge), equipment support (e.g. engine management),<br />
marine operations (e.g. cargo handling) and design.<br />
1999–03 2004 2005–09<br />
Irish <strong>Market</strong> €M 43 18 78<br />
UK <strong>Market</strong> €M 648 217 917<br />
Europe <strong>Market</strong> €M 3,794 1,382 5,872<br />
World <strong>Market</strong> €M 9,780 3,570 16,012<br />
<strong>Marine</strong> IT has grown substantially from €1.3 billion in 1999.There is an overall longterm<br />
increase in IT content in the marine sector and it could hold significant<br />
potential for Ireland. <strong>Global</strong>ly, the sector is set for its long-term steady growth to<br />
continue; however, after a peak in 2004, annual growth is forecast at –0.9%, although<br />
total period growth 2005–2009 is 7%.<br />
MARINE BIOTECHNOLOGY<br />
Page 113 (€2.2bn in 2004, €2.6bn in 2009)<br />
In 2004 the global value of marine biotechnology was €2.2 billion. As the sector is in<br />
the early stages of its development, there is at present insufficient information on<br />
which to base country or regional segmentation of these estimates.<br />
80% of living organisms are found only in aquatic ecosystems, yet little is known<br />
about their biochemical characteristics.This is a new sector with considerable interest<br />
being shown by the US, Japan, the UK and others.There have been some initial<br />
successes (the US Sea Grant programme, with small investments, developed five drugs<br />
“with market potential of $2bn p.a.”) and considerable long-term potential beyond<br />
the timeframe of this report.<br />
1999–03 2004 2005–09<br />
Irish market €M – – –<br />
UK market €M – – –<br />
Europe market €M – – –<br />
World market €M 11,350 2,190 11,848
22 MARINE INDUSTRIES GLOBAL MARKET ANALYSIS<br />
The long-term potential of the sector is very large, arguably greater than conventional<br />
(non-marine) biotechnology activity which in 2002 generated $35.8 billion of<br />
revenues. Annual average growth 2005–2009 is estimated at 3.8%, with a total growth<br />
rate of 24% over the forecast period.<br />
“One of the most exciting emerging technology sectors.” 10<br />
3.8 EDUCATION AND RESEARCH<br />
1999–03 2004 2005–09<br />
Irish <strong>Market</strong> €M – – –<br />
UK <strong>Market</strong> €M – – –<br />
Europe <strong>Market</strong> €M – – –<br />
World <strong>Market</strong> €M 10,041 1,537 7,691<br />
EDUCATION & TRAINING<br />
Page 121 (>€1.5bn in 2004, €1.6bn in 2009)<br />
Worth €1.5bn in 2004, the sector has three primary activities: seafarer training,<br />
offshore workers and higher education. As training may be provided in one country<br />
to meet demand from other countries, it is not feasible to segment the ‘market’ by<br />
countries or regions.<br />
• Seafarer training – 400,000 officers and 825,000 ratings are employed worldwide<br />
with 60% of the latter being from the Asia Pacific region. 418 ‘maritime schools’ are<br />
listed worldwide and there has been a 27% oversupply of ratings recently (mainly<br />
Philippinos). At the same time there is a 4% undersupply of officers which is<br />
expected to rise to 12% by 2010. Seafarer training costs range from $5–20K,<br />
officers $40K and we estimate that during the period 2005–9 the number of<br />
people requiring training will be 177,000.<br />
• Offshore workers undergo safety training on a four year cycle.With an estimated<br />
80,000 workers worldwide, some 20,000 are trained per annum.<br />
• Higher education establishments offering marine courses total at least 241<br />
worldwide. However, it is difficult to estimate the associated expenditure in this area.<br />
All education and training has a role in ‘marketing’ the supplier country and its<br />
technology to foreign students. (The new National Maritime College of Ireland,<br />
located in Cork, offers a wide range of courses geared specifically towards the<br />
commercial shipping sector and the navy.)<br />
Due in part to a recent over-supply of seafarers being trained, historic levels of<br />
activity have declined slightly to 2004.This is due to be followed by a slight upturn<br />
with other areas within the sector seeing growth, resulting in annual average growth<br />
of 1.5% over the period 2005–2009.<br />
10<br />
Report to the UK Foresight <strong>Marine</strong> Panel, January 05.
MARINE INDUSTRIES GLOBAL MARKET ANALYSIS<br />
23<br />
RESEARCH & DEVELOPMENT<br />
Page 123 (€11bn in 2004, €11bn in 2009)<br />
The <strong>Marine</strong> R&D sector was valued at €11bn in 2004 with Europe’s share of<br />
the world market exceeding €3.2 billion in 2004. A number of areas make up this<br />
global value.<br />
1999–03 2004 2005–09<br />
Irish <strong>Market</strong> €M 325 62 329<br />
UK <strong>Market</strong> €M 3,252 621 3,294<br />
Europe <strong>Market</strong> €M 15,742 3,273 16,471<br />
World <strong>Market</strong> €M 50,484 10,629 54,320<br />
• We currently value shipbuilding R&D at €1.8bn – its growth mainly a function<br />
of future increases in shipbuilding revenues.<br />
• The oil & gas industry is estimated to spend €2.5bn, but in future years this<br />
increase will be a function of the technical challenges that will be faced.<br />
• Other marine industries, we believe, total €1bn.<br />
• Governments are major spenders with over 1,200 ‘research’ vessels worldwide.<br />
The US leads and the National Oceanographic and Atmospheric Administration’s<br />
(NOAA) marine budget we estimate at €2bn. Other governments probably total<br />
of the order of €3bn.The response to global warming is likely to increase this<br />
spend. (Our figures exclude the important military naval sector where the US<br />
alone accounts for $13bn and the world total could be €26bn.)<br />
Historically, activity has been fairly constant with forecast growth estimated at 1.4%<br />
annually from 2005 through to 2009.
24 MARINE INDUSTRIES GLOBAL MARKET ANALYSIS<br />
Table 3.1: World <strong>Marine</strong> Sectors – Value and Growth (Ranking 2005–09)<br />
Annual Total Irish<br />
Growth Growth Share<br />
Euros million 99–03 2004 05–09 2005 to 09 2005 to 09 2004<br />
Shipping & Transport 1,011,600 342,743 1,436,684 –1.8% 7% 0.29%<br />
<strong>Marine</strong> Tourism 762,345 168,189 928,267 3.3% 14% 0.09%<br />
Offshore Oil & Gas 504,110 91,146 476,044 1.7% 12% 0.13%<br />
Seafood Processing 466,254 79,859 384,878 –0.4% 3% 0.37%<br />
<strong>Marine</strong> Equipment 355,826 72,871 358,315 –0.6% –1% 0.00%<br />
Fishing 362,035 55,983 250,386 –2.5% –4% 0.33%<br />
Shipbuilding 183,440 37,746 155,017 –4.0% –10% 0.00%<br />
Ports 141,979 25,017 135,526 3.2% 18% 0.60%<br />
<strong>Marine</strong> Aquaculture 104,220 23,876 134,492 4.0% 17% 0.46%<br />
Cruise Industry 54,570 12,000 67,436 4.4% 24% 0.55%<br />
Research & Development 50,484 10,629 54,320 1.4% 10% 0.81%<br />
Seaweed 28,490 5,988 32,746 3.0% 13% 0.00%<br />
<strong>Marine</strong> Commerce 26,092 6,840 28,670 –1.8% 7% 0.80%<br />
<strong>Marine</strong> IT 9,780 3,570 16,012 –0.9% 7% 0.50%<br />
Minerals & Aggregates 12,268 2,741 14,878 2.7% 11% 0.00%<br />
Renewable Energy 741 128 12,649 131.4% 987% 0.00%<br />
<strong>Marine</strong> Biotechnology 11,350 2,190 11,848 3.8% 24% 0.00%<br />
Submarine Telecoms 21,270 1,126 11,646 21.8% 97% 0.00%<br />
Ocean Survey 11,715 2,013 10,137 1.3% 11% 0.61%<br />
Education & Training 10,041 1,537 7,691 1.5% 14% 0.00%<br />
3.4 CONCLUSIONS<br />
<strong>Marine</strong> industries are of major economic importance. Although many of the<br />
sectors are large, they often deliver economic benefits that are multiples ranging<br />
from 2 to 10 times the values of direct spend we give in this report.<br />
The above table 3.1 shows that the marine sectors range greatly in size.The largest<br />
ones such as shipping, marine tourism and oil & gas (“traditional areas”) offer many<br />
niche opportunities and existing world markets. Some very small ones such as marine<br />
biotechnology and renewable energy have very high growth prospects and<br />
investments in these could offer a large return.<br />
It has been estimated that the European maritime cluster generates employment for
MARINE INDUSTRIES GLOBAL MARKET ANALYSIS<br />
25<br />
almost 1.5 million people. In terms of direct value added, the United Kingdom has<br />
the largest maritime cluster, closely followed by Germany and Norway. 11<br />
However, some small countries such as Greece, Denmark and the Netherlands have<br />
developed major marine industries. As a small country, in 2004 Ireland had a<br />
correspondingly small share of world markets, largest in the key sectors of research &<br />
development and marine commerce.<br />
We believe that the future potential a small country such as Ireland lies in sectors that<br />
are ‘internationally mobile’ and therefore receptive to advantageous tax regimes,<br />
and/or would benefit from application of new technology; or are particularly suited<br />
to Ireland’s natural environment. For example:<br />
• Aquaculture – a growth sector where Ireland can be promoted as a ‘green and<br />
clean’ producer.<br />
• Maritime commerce – focused around Dublin’s shipping and financial community.<br />
This however needs an attractive taxation environment.<br />
• <strong>Marine</strong> renewable energy – Ireland has an outstanding wind, wave and tidal regime.<br />
• <strong>Marine</strong> technology and biotechnology – capitalising on Ireland’s attractions<br />
as a location for technological investments.<br />
• <strong>Marine</strong> education – Ireland has made training investments and has a reputation<br />
for academic excellence.<br />
• Ocean survey – specifically related to building on Ireland’s recent EEZ<br />
survey experience.<br />
• Tourism – as cruise industry and watersports customers seek new destinations.<br />
In developing any strategy for the marine industries it is important to recognise the<br />
significance of commercial initiatives (as opposed to research initiatives), particularly<br />
within the “traditional sub-sectors”. Examples of countries which have developed<br />
positions of commercial leadership include Greece with the highest ownership of the<br />
world’s ship tonnage, Germany in regard to container vessels, Denmark which<br />
operates twice its owned tonnage and is a world leader in the manufacture of wind<br />
energy technology, the UK in marine commerce (Greek shipping is mainly Londonbased),<br />
and the Netherlands in ports and ocean survey (it claims some 11,800<br />
companies active in marine sectors). 12 In comparison it has been noted that “New<br />
York declined as a marine cluster due to tax changes”.<br />
11<br />
‘The Economic Impact of Maritime <strong>Industries</strong> in Europe’, Policy Research Corporation NV for the European Commission, 2002.<br />
12<br />
http://www.kvnr.nl/kvnr/engels.asp
26 MARINE INDUSTRIES GLOBAL MARKET ANALYSIS<br />
As a small country, Ireland is not limited by having a major share of any world market<br />
sector, so in many instances, with application of the correct strategy, there is potential<br />
for growth. However, Ireland is limited in marine technology by the lack of a defence<br />
sector and predominance of small companies.Therefore niche opportunities must be<br />
carefully selected.<br />
Ireland has been successful in attracting high technology companies, such as major<br />
players in software and pharmaceuticals. It is now necessary to attract key players in<br />
the marine sector and the involvement of the Irish Development Authority (IDA) is<br />
vital to such a process. In this respect the Irish ‘patented product’ tax laws could be<br />
helpful in attracting more investment.<br />
The presence of multinationals tends to result in cluster development, both to service<br />
them and also spin-off companies, the overall result being creation of jobs.<br />
To maximise its potential, Ireland must become perceived as a good place to do<br />
(marine sector) business. It is essential to understand and promote the advantages of<br />
doing business from a location in Ireland.<br />
A highly skilled workforce provides an opportunity for technology development in<br />
key growth areas.<br />
Internationally perceived Irish strengths include a positive image, high IT skills,<br />
English language and being fully ‘European’.<br />
Opportunities for Ireland can be considered as being in two areas – technical<br />
and commercial.<br />
There is no fundamental reason why Dublin could not be developed into a significant<br />
centre of marine finance and commerce by building on its activities in the<br />
financial sector and of the existing maritime companies, and by developing initiatives<br />
to attract more.<br />
A centre for marine technology and education could be developed in perhaps<br />
another location where there is already marine research and/or educational activity.<br />
One possibility that warrants further consideration is a centre for research into marine<br />
renewable energy, which could be developed further into a physical Centre of<br />
Excellence in <strong>Marine</strong> Technology. However, high level political support would be<br />
essential. Models that may be relevant are the Southampton Oceanography Centre<br />
and the Scripps <strong>Institute</strong> in the US.
MARINE INDUSTRIES GLOBAL MARKET ANALYSIS<br />
27<br />
A key need is to identify areas for R&D that results in both products and in<br />
intellectual property development. In the main, the focus needs to be into<br />
development of a small number of niche markets. Examples may include <strong>Marine</strong> IT,<br />
Ocean Environmental Monitoring (sensors and data systems), Biotechnology,<br />
Renewable Energy, etc.<br />
It is essential to develop and maintain a knowledge base in the selected key areas by<br />
means such as research fellowships, for example.<br />
<strong>Marine</strong> IT may be particularly well suited to Ireland, but further research is needed to<br />
identify specific medium-term opportunities.<br />
A significant weakness is probably the low international awareness of Irish marine<br />
activities. Ireland needs a maritime ‘brand’.This is particularly the case at sector<br />
level. (Norway, for example, has very high brand recognition for its seafood in major<br />
international markets such as the US.)<br />
Above all, Ireland needs high visibility long-term government support of its marine<br />
industries and marketing, both internally to raise awareness of marine opportunities<br />
and externally to attract foreign key companies.<br />
Once a strategy is developed it is essential to market it, both nationally and<br />
internationally.
28 MARINE INDUSTRIES GLOBAL MARKET ANALYSIS<br />
Table 3.2: <strong>Marine</strong> Sector Values – Euros and US Dollars (Ranked by 2004 Values)<br />
<strong>Marine</strong> Sector Values – Euros<br />
Euros Millions 1999 2000 2001 2002 2003 2004 2005 2006 2007 2008 2009<br />
Shipping & Transport 150,754 217,087 216,265 184,495 243,000 342,743 287,748 275,467 274,653 290,886 307,930<br />
<strong>Marine</strong> Tourism 142,467 147,290 152,288 157,471 162,829 168,189 173,739 179,487 185,440 191,606 197,995<br />
Offshore Oil & Gas 87,141 104,532 109,700 108,022 94,715 91,146 88,237 93,544 97,132 98,011 99,119<br />
Seafood Processing 83,992 99,686 100,432 97,108 85,037 79,859 75,813 76,350 76,930 77,556 78,229<br />
<strong>Marine</strong> Equipment 64,098 72,141 73,559 74,978 71,052 72,871 70,654 74,078 73,301 70,531 69,751<br />
<strong>Marine</strong> Fishing 67,495 79,309 78,118 75,034 62,079 55,983 50,983 50,526 50,073 49,625 49,180<br />
Shipbuilding 31,885 37,000 38,090 39,494 36,971 37,746 32,744 33,141 30,835 28,716 29,582<br />
Ports 25,331 30,283 31,071 29,664 25,630 25,017 24,827 26,068 27,111 28,196 29,324<br />
<strong>Marine</strong> Aquaculture 16,497 20,377 22,313 22,074 22,957 23,876 24,831 25,824 26,857 27,931 29,049<br />
Cruise Industry 7,749 10,483 12,079 12,474 11,785 12,000 11,993 12,803 13,556 14,240 14,845<br />
R&D 10,202 9,982 10,041 10,100 10,160 10,629 10,346 10,757 10,803 11,010 11,404<br />
<strong>Marine</strong> Commerce 4,154 5,533 5,115 5,292 5,997 6,840 5,742 5,497 5,481 5,805 6,145<br />
Seaweed 6,442 5,074 5,506 5,654 5,814 5,988 6,168 6,353 6,544 6,740 6,942<br />
<strong>Marine</strong> IT 1,304 1,845 2,023 2,015 2,592 3,570 3,159 3,115 3,122 3,236 3,380<br />
Minerals & Aggregates 2,297 2,375 2,454 2,532 2,610 2,741 2,819 2,897 2,976 3,054 3,132<br />
<strong>Marine</strong> Biotechnology 1,768 2,212 2,500 2,588 2,282 2,190 2,123 2,240 2,363 2,493 2,630<br />
Ocean Survey 2,020 2,497 2,601 2,465 2,133 2,013 1,925 1,964 2,022 2,082 2,144<br />
Education & Training 1,733 2,193 2,344 2,203 1,568 1,537 1,449 1,479 1,531 1,584 1,649<br />
Submarine Telecoms 4,816 3,919 7,193 4,591 751 1,126 1,502 2,065 2,441 2,685 2,953<br />
Renewable Energy – 15 71 234 421 128 514 1,365 2,327 2,857 5,586
MARINE INDUSTRIES GLOBAL MARKET ANALYSIS<br />
29<br />
<strong>Marine</strong> Sector Values – US Dollars<br />
US$ Millions 1999 2000 2001 2002 2003 2004 2005 2006 2007 2008 2009<br />
Shipping & Transport 160,598 200,412 193,595 174,414 274,950 426,297 389,481 372,857 371,756 393,727 416,797<br />
<strong>Marine</strong> Tourism 151,771 135,976 136,325 148,867 184,237 209,190 235,164 242,944 251,002 259,348 267,995<br />
Offshore Oil & Gas 92,831 96,503 98,200 102,120 107,168 113,366 119,433 126,616 131,473 132,663 134,163<br />
Seafood Processing 89,477 92,029 89,904 91,802 96,217 99,327 102,617 103,343 104,129 104,975 105,886<br />
<strong>Marine</strong> Equipment 68,283 66,600 65,848 70,881 80,393 90,636 95,634 100,267 99,217 95,467 94,411<br />
<strong>Marine</strong> Fishing 71,903 73,217 69,930 70,934 70,242 69,631 69,007 68,389 67,776 67,169 66,567<br />
Shipbuilding 33,968 34,158 34,097 37,336 41,832 46,948 44,320 44,857 41,737 38,868 40,040<br />
Ports 26,985 27,957 27,814 28,043 29,000 31,115 33,605 35,285 36,696 38,164 39,691<br />
<strong>Marine</strong> Aquaculture 17,575 18,812 19,974 20,868 25,976 29,696 33,610 34,954 36,352 37,806 39,319<br />
Cruise Industry 8,255 9,678 10,813 11,793 13,335 14,925 16,233 17,329 18,348 19,275 20,093<br />
R&D 10,868 9,215 8,988 9,548 11,496 13,221 14,004 14,559 14,623 14,903 15,435<br />
<strong>Marine</strong> Commerce 4,426 5,108 4,579 5,003 6,785 8,507 7,772 7,441 7,419 7,857 8,317<br />
Seaweed 6,863 4,684 4,929 5,345 6,578 7,448 8,349 8,599 8,857 9,123 9,396<br />
<strong>Marine</strong> IT 1,390 1,703 1,811 1,905 2,933 4,441 4,276 4,216 4,226 4,380 4,574<br />
Minerals & Aggregates 2,447 2,193 2,196 2,394 2,953 3,409 3,816 3,922 4,028 4,134 4,239<br />
<strong>Marine</strong> Biotechnology 1,883 2,042 2,238 2,447 2,582 2,724 2,873 3,031 3,198 3,374 3,560<br />
Ocean Survey 2,152 2,305 2,328 2,330 2,413 2,504 2,605 2,658 2,737 2,818 2,903<br />
Education & Training 1,846 2,024 2,099 2,082 1,775 1,911 1,961 2,001 2,072 2,144 2,232<br />
Submarine Telecoms 5,131 3,618 6,439 4,340 850 1,401 2,033 2,795 3,303 3,634 3,997<br />
Renewable Energy – 14 63 221 476 159 696 1,847 3,150 3,867 7,562<br />
Exchange Rate 0.94 1.08 1.1 1.06 0.88 0.80 0.74 0.74 0.74 0.74 0.74<br />
Exchange rates – Over the past five years there have been major variation in<br />
exchange rates, in particular the US dollar against the Euro is of great importance as<br />
activity in the marine industries is mainly denominated in US dollars. Between 2002<br />
and 2004 the US dollar has fallen and the Euro risen against major currencies.The<br />
effect of this can be to change a market that has grown in US dollars into a decline<br />
when measured in euros.
30 MARINE INDUSTRIES GLOBAL MARKET ANALYSIS
MARINE INDUSTRIES GLOBAL MARKET ANALYSIS<br />
31<br />
4 Methodology & Definitions<br />
4.1 INTRODUCTION<br />
No industrial sector is an isolated economic activity and many of the forecasts for<br />
individual sectors are in reality interlinked. For example:<br />
• Shipbuilding is a key forecast as its results also feed into shipping, marine<br />
equipment and marine IT.<br />
• Shipping itself drives activity in marine commerce and ports.<br />
• Offshore oil & gas expenditure also feeds part of the marine equipment sector.<br />
• Ocean survey is driven by activity in offshore oil & gas and ports, and to a lesser<br />
extent submarine telecoms and marine renewable energy.<br />
Most significantly, virtually all are a function of global economic activity and the<br />
factor having greatest impact on this is political action.<br />
Forecasts of the future are reliant upon knowledge of the present and the past.<br />
In some cases up-to-date values can be difficult to obtain due to the delay in<br />
publication of official statistics.<br />
It is important to note that our forecasts are based on the same processes that we use<br />
in forecasting for our commercial clients – what might reasonably be achieved taking<br />
into account fundamental market drivers and competition in a sector – in other<br />
words, our aim is to generate realistic forecasts that could be used as a basis for<br />
business planning.Where there is a choice we err on the side of caution as we are not<br />
aiming to state maximum potential growth, other methodologies may result in<br />
higher values.<br />
4.2 METHODOLOGY BY SECTOR<br />
SHIPPING<br />
We have developed a $ value for the total world shipping industry for 2003 by using<br />
tonnage shares to scale-up from official figures published by individual countries’<br />
shipping industries.<br />
The main market driver of shipping industry is the tonnage of seaborne trade<br />
(import & export), the volume of which changes as a function of nations’ GDP.<br />
Shipping activity is measured in tonne-miles for which we have used the ClarkSea<br />
index and made tonne-miles projections based on GDP growth taken from IMF<br />
and other forecasters.
32 MARINE INDUSTRIES GLOBAL MARKET ANALYSIS<br />
The volume of trade impacts on availability of vessels and, hence, vessel charter rates.<br />
In effect, a relatively small increase in demand can result in a large increase in<br />
shipping rates (and vice versa) and the value of the shipping sector.<br />
In a rising market ship owner confidence builds and they order more tonnage.<br />
However, this may take one to two years to deliver, so supply will lag demand then<br />
overshoot as demand peaks.The result is considerable variations in charter rates and<br />
thereby values of the shipping sector from year to year.We have considered these<br />
factors and after discussions with industry players developed our view of future<br />
market values.<br />
MARINE COMMERCE<br />
The value for the sector is based upon scaling up from known figures for London, the<br />
largest market. Shipping activity remains the key driver; therefore, demand will grow<br />
in line with the shipping sector forecast.<br />
PORTS<br />
We have valued the ports business by taking revenue and traffic figures for the world’s<br />
leading ports and scaling up. (This value was then compared to other companies’<br />
published estimates.) We then applied estimates for growth in seaborne trade used in<br />
the shipping section to develop forecasts for future ports business.<br />
CRUISE<br />
Annual expenditure for the US, the largest market, is published by the International<br />
Council of Cruise Lines.We have taken this and scaled up to give a view on world<br />
market value. Recently European data on embarkations growth and forecasts has<br />
been published by the European Cruise Council. Using these two main sources and<br />
trends in marine tourism has enabled us to develop a view on annual growth rates<br />
in future years.<br />
MARINE TOURISM<br />
In general the tourism sector, including marine tourism, has grown significantly in<br />
recent decades and is now a major global industry.<br />
By making assumptions on the proportion of domestic to international tourism in<br />
each region, a total tourism value for the world can be estimated. Generally,<br />
developing areas are thought to display the reverse situation of the likes of the US or<br />
13<br />
World Tourism Organisation,‘Tourism Highlights’ Edition 2004.
MARINE INDUSTRIES GLOBAL MARKET ANALYSIS<br />
33<br />
UK, whose populations engage in high levels of international tourism. By applying<br />
the proportions, by region, to the known data on international tourism receipts a<br />
figure of total tourism can be derived. 13<br />
To derive ‘<strong>Marine</strong> Tourism’, a percentage of each world region’s total tourism was<br />
estimated.This gives the world marine tourism market in 2004 as €155 billion, 11%<br />
of all tourism.This percentage varies widely between regions.<br />
(Another way of calculating the value of world marine tourism could be to apply a<br />
multiplier to the Leisure Boating Industry Revenues to estimate ‘<strong>Marine</strong> Tourism’ but<br />
this approach was not found to be viable.) 14<br />
OCEAN SURVEY<br />
The market valuations and forecasts are taken from our published study,‘The World<br />
Ocean Survey Report’.The approach used in the study is a ‘bottom-up’ one – from<br />
data on proposed activities (such as an offshore field development) we generate our<br />
own individual activity forecasts, which, with typical survey task prices, are the inputs<br />
to the models that value the individual markets.These are in two main groups, the oil<br />
& gas markets and the non-oil markets.<br />
SUBMARINE TELECOMS<br />
Our historic data has been taken from ‘The World Ocean Survey Report’ and is<br />
based on various studies we have carried out in the sector and information sourced<br />
from telecom sector specialist KMI. Our forward view is also based on our<br />
projection of their short-term global forecasts of total km to which we have applied<br />
a regional segmentation based on the location of past installations and changes in<br />
regional demand.<br />
FISHING<br />
The global fishing industry is in decline. Our five-year forecasts assume the value<br />
of the catch will stay constant from 2002 onwards.This assumption has been made<br />
on the basis of increasing production of fish (including shellfish) from aquaculture<br />
compensating for the declining production of capture fishing and keeping prices<br />
steady. Production is forecast to decline at the same rate as it has since 1994<br />
(0.99% per year).<br />
<strong>Marine</strong> fishing production can be viewed by tonnage and by value.The values are<br />
derived from tonnage data in the Eurostat online database and further broken down<br />
14<br />
Ireland is the only country where there is available data on which to make this comparison.The boating industry is of varying<br />
importance to tourism in general (Ireland: 12%, UK: 2%, US: 5%).This is probably due to the leisure boat industries in different<br />
countries varying considerably in structure and overall size. For example, new boat sales make up different proportions of the leisure<br />
boating industry (Ireland: 14%, UK: 19% & USA: 35%).There are also likely to be big differences between regions, especially<br />
comparing the developed and developing world. For these reasons, this approach was not used.
34 MARINE INDUSTRIES GLOBAL MARKET ANALYSIS<br />
into molluscs & crustaceans (shellfish) and demersal & pelagic (finfish).This is our<br />
best estimate, although the Eurostat/FIGIS/FAO information only contains data on<br />
‘miscellaneous’ demersal and pelagic fish tonnage, not representing all fish caught.<br />
Therefore, we have assigned ratios of demersal/pelagic (of total catch) based on<br />
available data and applied those ratios to the total fish tonnage data (which is<br />
complete). Eurostat/FIGIS/FAO data on shellfish tonnage appears to be complete and<br />
these areas should be valued more accurately than for fish.<br />
The value of each of these subsets was estimated by assigning an average price per<br />
tonne, using the FAO ‘World Fishery Production: estimated value by group of species’<br />
table, containing annual data from 1999–2002. If anything, this approach is likely to<br />
estimate the world value of marine capture fisheries conservatively. For available years,<br />
BIM data is used for Ireland, and DEFRA data for the UK, rather than our own<br />
estimates.<br />
MARINE AQUACULTURE<br />
Between 1996 and 2002 tonnage growth was 9% p.a. and $ value growth 4% p.a.<br />
Continuing strong future growth in demand is forecast. Forecast data from 2003/4<br />
onwards assumes a continuation of growth rate in the volume of marine aquaculture<br />
produced at 4% per year, based on FAO tonnage and value data.<br />
SEAWEED<br />
The historic value of seaweed production value is based on the Eurostat Aquaculture<br />
and Capture fisheries databases data, based on live weight, 1994 to 2002. Our analysis<br />
shows a value growth trend of 3% forecast growth per annum and we use this as our<br />
future annual growth rate.<br />
FISH/SEAFOOD PROCESSING<br />
There is a generally a lack of information available on this subject, in any useful<br />
format for the purposes of the report.Therefore, seafood processing revenues have<br />
been estimated as being equivalent to the combined marine aquaculture and<br />
fishing product value for each country.This view is based on data from a number<br />
of countries including Canada, Ireland and the UK.This ‘combined value<br />
approach’ correlates well with the limited data found on the value of countries’<br />
processing industries.
MARINE INDUSTRIES GLOBAL MARKET ANALYSIS<br />
35<br />
Therefore, the forecast is based on the trends already defined by the fishing and<br />
aquaculture sectors (i.e. the availability of the raw product). It could be argued that<br />
there is a move towards more processing, with more value being added to the same<br />
amount of raw product. Although, for the purposes of the report, we have maintained<br />
the trends estimated for fishing and aquaculture production.<br />
OFFSHORE OIL & GAS<br />
Both historic and forecast data is based on ‘The World Offshore Oil & Gas Forecast<br />
2005–2015’ published by Douglas-Westwood which draws from the ‘Energyfiles’<br />
system an information service which records activity for each country worldwide.<br />
The forecast methodology does not restrict itself to oil & gas production profiles<br />
and direct capital costs for existing fields and specific new projects, as this tends to<br />
understate total industry activity and spend. Forecasts are based on estimating yearly<br />
production additions on a country by country basis, whereby all elements of<br />
geological potential, capital and operating expenditures are taken into account.Thus,<br />
items such as exploratory activity, front end engineering, unscheduled maintenance<br />
work and unpredicted early production systems on new discoveries, together with<br />
hidden costs such as signature bonuses and other overheads are implicitly included<br />
in cost estimates.<br />
MARINE RENEWABLE ENERGY<br />
Douglas-Westwood operates the ‘World Offshore Wind Database’, and ‘World Wave<br />
& Tidal Database’, extensive project databases with up to 60 fields of data on each<br />
wind, wave and tidal project in operation and planning worldwide.These data sources<br />
have been in place for four years and are constantly updated giving a current view<br />
of industry activity. By only using this data which only relates to identified projects,<br />
the subsequent market forecasts are grounded in reality.<br />
The modelling process uses the Douglas-Westwood ‘slip method’ which considers<br />
each renewable energy project on an individual basis, assessing its viability in light<br />
of market forces such as government policy, financing, availability of contractors, etc.<br />
All projects are allocated a ‘slip’ date which is our view as to when they will come<br />
into production.This new date forms the basis of the forecasts of when future<br />
expenditure and installations will occur.The $ values used in forecasting are based<br />
on actual project costs.
36 MARINE INDUSTRIES GLOBAL MARKET ANALYSIS<br />
MINERALS & AGGREGATES<br />
Past individual reports for the tonnage of aggregates extracted have been scaled up<br />
and a world value estimated. Forecasts are based on taking a view based on historic<br />
growth of aggregates demand.<br />
SHIPBUILDING<br />
The Lloyds Fairplay database was used to determine historic ship deliveries and vessel<br />
presently on order together with their GT & CGT.This was then compared with<br />
results from the Douglas-Westwood study,‘The World <strong>Marine</strong> Propulsion Report’,<br />
whose forecast methodology is based on the strong linkage between shipbuilding,<br />
GDP growth and world seaborne trade tonnage.<br />
In light of the high recent growth in shipbuilding activity, numbers were also<br />
updated using OECD figures for 2003 (tonnages and $/CGT) and also the WES<br />
European figures.<br />
MARINE EQUIPMENT<br />
<strong>Marine</strong> equipment is a very large market and in this report we define it as being<br />
comprised of two main customer groups: the shipbuilding and oil & gas sectors.There<br />
is growing technology content in both sectors, with hundreds of high-tech subsectors<br />
ranging from software to underwater connectors to control systems.<br />
We value the world market for marine equipment in the shipbuilding sector in 2004<br />
at €21.3 billion. For the oil & gas sector the capital expenditure component was used,<br />
which we value at €49.7 billion in 2004.The overall forecast is, therefore, a function<br />
of both the shipbuilding and oil & gas sector forecasts outlined above.<br />
MARINE IT<br />
The very wide range of applications and lack of any official information on the<br />
value of IT deployed in the marine sector means that it is difficult to value the<br />
overall market. In order attempt this, we have assumed that the IT content of<br />
capital expenditure in three key areas of shipping operations (including IT additions<br />
to existing ships), newbuild ship capex, and the offshore oil & gas industry<br />
averages 0.5%.<br />
The continual need to improve efficiency of operations in all sectors of the marine<br />
industries will drive an increasing use of marine IT.Therefore, we assume that this<br />
content grew to 0.75% by 2004 and thereafter remains at this proportion.
MARINE INDUSTRIES GLOBAL MARKET ANALYSIS<br />
37<br />
MARINE BIOTECHNOLOGY<br />
The UK Foresight Report gives a predicted growth rate “exceeding 10% per annum<br />
over the next three years” (from 2002). BCC Research in 2003 estimated average<br />
growth from 1999 to 2007 as: USA 4.7%, the rest of the world at 6.4% and the total<br />
global growth as 5.9%.<br />
Over-estimation of market growth in the early years of technological development is<br />
a common failing, therefore in our forecasts we have chosen to use an average growth<br />
of 3.8%. In our view it is likely that the anticipated very large market for marine<br />
biotechnology will develop outside the time period of this report. (This makes<br />
marine biotechnology a very interesting long-term ‘investment’ prospect.)<br />
EDUCATION & TRAINING<br />
Education & Training has three primary activities: seafarer training, offshore worker<br />
training and higher education.<br />
We have estimated the market for seafarer training and offshore worker training by<br />
taking published data on throughputs of training establishments, manpower updates<br />
and industry statements.The in the case of seafarers we considered the world fleet<br />
size, manning levels and retirement rates, and developed forecasts based on growth in<br />
vessel numbers taken from our shipbuilding forecast. A similar process has been<br />
undertaken for offshore oil & gas workers with future growth based on the main<br />
sector forecast.<br />
Valuing the ‘market’ for higher education is a more difficult process; an example is<br />
how to clearly separate the education element of universities’ activities from research<br />
activities. At least 241 establishments worldwide offer marine-related courses and our<br />
values are based on estimates of annual student intake and average fees.The forecast is<br />
then based on growth at 3% per annum.<br />
RESEARCH & DEVELOPMENT<br />
R&D occurs to a lesser or greater extent in every marine sector.The three largest are:<br />
• Oil and Gas – where we use the mid point between separate estimates by<br />
Shell and McKinsey.<br />
• Shipbuilding – where claims have been made of 10% of revenues. However, we use<br />
a more cautious 5%.
38 MARINE INDUSTRIES GLOBAL MARKET ANALYSIS<br />
• Government (civil spend) – where the US NOAA’s National Ocean Service is<br />
perhaps the world’s largest spender.<br />
Taking into account other industries, our estimated total for 2004 is some<br />
€10.2 billion.<br />
We assume a continuing level of R&D intensity in future years (R&D as a % of<br />
total sector sales value) which is then applied to our individual sector forecasts, such<br />
as shipbuilding.<br />
Figure 4.2: Shipbuilding Expressed in € and $<br />
4.3 DEFINITIONS<br />
Exchange Rates – The marine market is an international industry denominated<br />
in US$. At times, expressing the value of sectors in euros presents a false picture<br />
of markets (see Figure 4.1) and introduces significant statistical difficulty in<br />
our analysis.<br />
We use actual historic exchange rates throughout this report and December 2004<br />
rates for forecasts.<br />
Source: Douglas-Westwood Limited<br />
Growth Rate – The average annual growth rate is the sum of each of the five years’<br />
annual percentage growth, divided by five (sum of 2004 to 2005… 2008 to 2009<br />
divided by 5). However, the period growth (2005–2009) does not include the change<br />
between 2004 and 2005. For example, in the case of Shipping this is significant as a<br />
decline occurred between 2004 and 2005 (from €343bn to €288bn), but this decline<br />
is not included in the period 2005–2009 (when growth is forecast from €288bn in<br />
2005 to €308bn in 2009). During periods of considerable change, the overall effect<br />
can be differences in the ‘annual’ and ‘period’ growth rates, sometimes from positive to<br />
negative trends and vice versa.<br />
Data – As other researchers have noted, more than half of the maritime sectors<br />
identified are not covered by official European statistics and the situation becomes<br />
worse when data is required for other countries and world markets.When data is<br />
available, it is often in units (such as tonnage) and not € values. Internationally<br />
comparable official statistics are often out of date, with data available in early 2005<br />
often relating to 2002.This presents a particular problem due to the considerable<br />
increase in activity in many marine sectors during these years.<br />
In addition, statistics are often based on voluntary contributions and therefore often<br />
incomplete. Examples include the leisure boating industry.
MARINE INDUSTRIES GLOBAL MARKET ANALYSIS<br />
39<br />
<strong>Marine</strong> Tourism – This is a sector that is particularly lacking in comparable<br />
international statistics.<br />
Secrecy – This is another factor that contributes to a lack of data on national and<br />
global market values.The shipping industry operates in a global market and vessels are<br />
registered in locations that present their owners with lowest costs of compliance with<br />
regulations. In addition, a number of companies in the ship owning, shipping and<br />
ports sectors are privately owned and structured to assure privacy and do not issue<br />
annual reports giving values of sales and profits.<br />
Sectors – Definitions of marine sectors differ from country to country (or are not<br />
stated), so that information relating to one country is often not directly comparable to<br />
that from others.<br />
Models – In a number of instances (shipping, offshore oil & gas and renewable<br />
energy are examples) we use our own detailed models of historic and future global<br />
activity. In others such as marine tourism we generate estimates.<br />
Values – In some instances, such as the marine fisheries sectors, shipbuilding, etc., we<br />
use the value of production, in others the capital and operational expenditure. In<br />
general, we are considering ‘markets’ and not the economic benefit to the country,<br />
which is often a multiple of the stated market.<br />
Double Counting – It is important to note that sector values cannot always be added<br />
as, in many instances, this would cause double counting. In Figure 3.1 we try to avoid<br />
some major examples of this.<br />
Industry Structures – Individual countries may apply different structures and<br />
definitions of the marine industries.<br />
Sources/Forecasts – In general, forecasts are generated by Douglas-Westwood and<br />
historical data from various sources which are referenced in the text.
40 MARINE INDUSTRIES GLOBAL MARKET ANALYSIS
MARINE INDUSTRIES GLOBAL MARKET ANALYSIS<br />
41<br />
5 Long-Term Factors<br />
5.1 ECONOMIC AND POLITICAL CHANGE<br />
Economic stability and growth is particularly relevant when considering the<br />
continuing reaction to the ‘war on terrorism’.The US response to 9/11 may have<br />
marked the start of a new type of low-intensity war with occasional flare-ups in<br />
different parts of the world.<br />
Regional wars and prolonged domestic or ethnic violence create some of the most<br />
pronounced shocks to the world economy, due to the substantial costs faced by the<br />
countries or regions involved. Increasingly, disputes may involve using the control of a<br />
vital commodity, such as oil.<br />
Accordingly, security of energy supply is also an issue. Most of the world’s oil reserves<br />
are located in countries with the potential for serious political upheaval in the<br />
coming years.<br />
In the world today there is a heightened degree of interdependence between countries,<br />
which means disruption in one part of the world could have a knock-on effect in<br />
unforeseen locations.As well as ties spanning long distances, such as the UK/US<br />
relationship, closer to home the EU community has recently expanded considerably.<br />
EU ENLARGEMENT<br />
In 2004 ten more countries joined the EU, taking the total number of member states<br />
from 15 to 25.This enlargement has brought trade and investment opportunities and<br />
increases the EU population by 20%.This larger internal market means that firms can<br />
expand production and take advantage of economies of scale.The additional members<br />
will increase the EU’s authority and influence in international trade talks.The<br />
potential for existing members to expand into new markets is also great.<br />
Although to a great extent enlargement took place in the 1990s, with European<br />
agreements liberalising trade.The EU’s export trade has risen 73% since 1995 and<br />
imports by 81%.<br />
Alongside the increased number of member states, other EU measures are likely to<br />
affect the marine sector. One of the most significant is likely to be European<br />
maritime transport policy:<br />
• Revision of Community State Aid guidelines – stricter monitoring of state aid and<br />
strengthening of the flag-link to continue the benefit from tonnage tax.<br />
• Liberalisation of port services.
42 MARINE INDUSTRIES GLOBAL MARKET ANALYSIS<br />
• Short sea shipping – in 2001 this provided 40% of EU tonne-km and the<br />
‘Motorways of the Sea’ programme will build on this.<br />
• ‘Marco Polo’ programme – a second programme is being established from 2007 to<br />
shift international road freight to water and rail.<br />
• Competition rules – adoption of a white paper to introduce more competition into<br />
the sector.<br />
• Safety – (following the sinking of the ‘Prestige’) the accelerated phasing out of<br />
single hull tankers.<br />
• Establishment of the European Maritime Safety Agency and the Future Maritime<br />
Safety Package.<br />
• Maritime security – enhancing ship and port security.<br />
• Human issues – directive on the Minimum Standard of Training for Seafarers.<br />
Consolidation of all existing maritime labour standards.<br />
SECURITY<br />
The continuing effects of 9/11 have increased concerns over maritime security.<br />
Maritime transport is vulnerable to terrorist attack.The cruise ship sector has<br />
benefited as a result of a reluctance of some to holiday using air travel.<br />
Many initiatives and legislation have already been adopted by individual countries and<br />
also internationally, most recently with the introduction of the ISPS Code<br />
(International Ship and Port Facility Security Code). Such legislation will lead to<br />
fundamental changes in the maritime industry.The Code stipulates a number of new<br />
regulations that require additional resources, the costs of which will fall to those<br />
whom the measures are designed to protect. Also, some believe that the Code relies<br />
on seafarers for security and the additional workload is making it more difficult to<br />
recruit and retain them.<br />
LOCAL CONTENT<br />
This is becoming an issue of growing importance in a number of sectors. Many<br />
countries demand a certain level of local content in any contracts awarded to foreign<br />
companies. For operations in developed countries this is not a great problem as work<br />
can be sub-contracted to local companies. However, developing countries present a<br />
challenge as they do not often have the established industrial infrastructure to act as<br />
sub-contractors.
MARINE INDUSTRIES GLOBAL MARKET ANALYSIS<br />
43<br />
Achieving local content is becoming a significant problem in the case of large hightech<br />
capital projects such as those undertaken for the offshore oil & gas industry.<br />
5.2 GLOBALISATION & SEABORNE TRADE<br />
The world market is a growing one, stimulated by increasing consumer demand and<br />
the globalisation of production. Low-cost manufacturing areas continue to increase in<br />
importance and are increasingly involved in globalised activity.The export of<br />
manufactured goods from developing countries doubled between 1981 and 2000. As<br />
the western world still accounts for two-thirds of the world’s manufactured imports,<br />
industrial growth in the developing economies is still dependent on the markets in<br />
the developed world.<br />
In the marine sector a major impact of this in the past three decades has been the rise<br />
of South East Asia as the world’s leading shipbuilding region. However, the market<br />
positions of Japan and South Korea are increasingly likely to be threatened by China<br />
with its lower costs. China is integrating into the global economy rapidly, since<br />
becoming a member of the WTO at the end of 2001.<br />
China’s demand for raw materials and energy to feed its domestic and export<br />
industries has recently grown exponentially.Whilst European oil consumption has<br />
remained relatively constant over the past decade, China’s has doubled. In 2004<br />
Chinese steel imports declined but exports doubled – by 2006 China is forecast to be<br />
producing 30% of the world’s steel.<br />
Since an estimated 90% of world trade is carried by sea, this helps boost the demand<br />
for shipping services.<br />
Developments in China are now considered to be one of the most important stimuli<br />
to growth for the tanker, chemical, bulk and container trades. Order books for<br />
newbuilds are at record levels and if world trade continues to grow at expected rates,<br />
then this extra capacity will eventually be absorbed without any significant long-term<br />
fall in capacity utilisation.<br />
However, there is likely to be a dampening of the currently rising rates for vessels, at<br />
least in the short term.The volume of international seaborne trade increased in 2003<br />
by 4.4%, compared with the previous year, to 5,840 million tonnes and tonne-miles<br />
by 5.9%. In line with such increases in international trade, ports have recently shown<br />
an increase in throughput, especially in container volumes.
44 MARINE INDUSTRIES GLOBAL MARKET ANALYSIS<br />
A further example of globalisation is in engineering design; offshore industry<br />
contracting and some technology companies (particularly in software) are also<br />
increasingly establishing operations in India and Eastern Europe.<br />
5.3 DEMOGRAPHIC CHANGE<br />
The world’s population is ageing, with unprecedented growth in the proportion of<br />
the population over the age of 60.This is a result of the demographic transition from<br />
high to low fertility and mortality rates.This situation has profound effects on all<br />
facets of human life. In the economic area, population ageing will have an impact on<br />
economic growth, savings, investment and consumption, labour markets, pensions,<br />
taxation and intergenerational transfers. Developing countries have not achieved such<br />
advanced levels of transition so their populations continue to grow.<br />
In 2000 the world population was 6.1 billion and growing at 1.4% annually,<br />
representing an increase in population of 85 million people per year. Almost all of this<br />
growth is concentrated in Asia, Latin America and Africa.<br />
Size matters. China has 21% of the world population (is a multiple of that of Japan)<br />
and this size is already manifesting itself strongly in terms of soaring consumption<br />
and exports.<br />
The decline of engineering students is a particular problem in the West. In emerging<br />
markets such as India and China about 40% of students take engineering degrees<br />
compared with the US at 4%. 15<br />
5.4 LOW-COST MANUFACTURING<br />
One impact of changing global demographics is a transfer of manufacturing to countries<br />
with low-cost skilled workforces of which China and India are prime examples. Over<br />
the decade to 2000, the fastest growing exports were ‘high technology goods’<br />
(electronics, etc) with annual average growth in US$ terms of 12.3%. 16 (By comparison,<br />
low technology ‘resource-based’ manufacturing grew at an average of 7.6%.)<br />
The fundamental reason for developing countries’ growth is low costs. Electronics<br />
company Samsung pays workers in the UK £5.61 (€8) an hour, in Slovakia £1<br />
(€1.4) and in China £0.5 (€0.7).<br />
Another factor is low labour productivity due to shorter working hours in some<br />
Eurozone countries compared to countries such as the US. In 1970 the annual<br />
number of working hours per capita in the US and the Eurozone countries was<br />
15<br />
Bill Gates addressing the World Economic Forum. Financial Times, p1, 31 Jan 05<br />
16<br />
UNIDO database
MARINE INDUSTRIES GLOBAL MARKET ANALYSIS<br />
45<br />
about 800. It is now about 950 in the US but less than 700 in the Eurozone. 17 In the<br />
period 2000–4 the Eurozone achieved annual productivity increases of 0.5–1.0%, the<br />
US, 3.8–4.0%. 18<br />
5.5 ENVIRONMENTAL ISSUES<br />
Responses to the effects of climate change include a considerable increase in support<br />
for renewable energy and the impact of environmental policies on sub-sectors ranging<br />
from marine propulsion to offshore engineering projects.<br />
The United Nations Framework Convention on Climate Change was adopted in<br />
1992. In 1997 developed countries, including Ireland, signed the Kyoto Protocol<br />
making a commitment to reducing global emissions legally binding. By 2001 Ireland<br />
had not made any progress towards limiting its emissions, unlike countries such as<br />
Germany and the UK.The effects of climate change, if emissions go unchecked, are<br />
increases in sea temperature, storm intensity, wave height and sea level as well as<br />
possible changes in sea currents, with profound long term implications for marine life.<br />
In addition to the need to cut emissions, increased demand for energy and a possible<br />
decline in oil supply over the next few years could increase the need for, and<br />
commerciality of, renewable energy. Renewable energy is already the fastest growing<br />
sector of the energy industry. Many suggest that governments need to get more<br />
involved with policies to promote the sector, but others feel it should be left to<br />
market forces.The growing importance of climate change, related environmental<br />
monitoring and of aquatic resources as food and of water sources will also impact on<br />
a growing demand for monitoring technologies.<br />
5.6 ENERGY SUPPLY & DEMAND<br />
OIL & GAS<br />
<strong>Global</strong> energy consumption has more than doubled over the past four decades, mostly<br />
being driven by the developing economies. Hydrocarbons (oil & natural gas) are<br />
currently the world’s most important energy source providing some 62% of global<br />
energy demand. 19 In 2004, oil demand was some 80 million barrels per day (b/d) but<br />
the IEA forecasts this demand will grow to 118 million b/d by 2025.<br />
Many individuals and most governments assume oil supplies are virtually unlimited.<br />
However, there are other views.Three fundamentals are now strongly evident:<br />
increasing oil demand, reducing reserves and a decline in discovery rates.<br />
17<br />
Paul de Grave, professor of international economics University of Leuven. Financial Times 5 Aug 2004.<br />
18<br />
Financial Times, p3, 16 Jan 2004.<br />
19<br />
‘BP Statistical Review of World Energy 2004’.
46 MARINE INDUSTRIES GLOBAL MARKET ANALYSIS<br />
For the past 30 years oil prices have been subject to massive fluctuations as a result of<br />
political actions ranging from local civil disturbance to outright wars in the Middle<br />
East.The results were the tripling of oil prices in 1973 and again in 1979.The<br />
reaction of the oil consuming western economies has been to seek oil supplies from<br />
other less troubled areas, resulting in the development of whole new oil production<br />
provinces such as the North Sea. Although oil demand has continued to grow, from<br />
some 58 million barrels per day (bpd) in 1973 to some 80 million bpd in 2004, the<br />
proportion shipped from the Middle East has fallen as the OPEC countries lost<br />
market share to these new non-OPEC suppliers.<br />
Since 1973, European oil demand has grown by only 6%, the US by 16%, whilst in<br />
the developing economies growth has been 202%.<br />
But the picture is changing. In the North Sea and some other shallow-water offshore<br />
areas oil & gas production has passed its peak and will soon be entering a period of<br />
terminal decline. Coupled with other factors, the effects of supply restrictions are now<br />
evident in prices that exceeded $53 in late 2004.<br />
In theory, the reserves that are still available worldwide are considerable – 40 years at<br />
current demand is much quoted, but is this true Such figures do not take into<br />
account the problems (both technical and political) in accessing the reserves.There is<br />
no doubt that OPEC fully realises the economic problems that high oil prices cause<br />
its customer countries which, at their most serious, would again reduce demand.<br />
Figure 5.1: Oil & Gas Supply Forecasts<br />
Conventional non-OPEC oil supplies are being used up at an alarming rate and at<br />
present OPEC countries are unable to provide much more. Politics permitting, in the<br />
short term oil prices could moderate. But longer term, the situation for oil consumers<br />
– in other words all of us – is not looking good.<br />
Source:<br />
“The World Oil Supply Report”<br />
Douglas-Westwood Limited<br />
NATURAL GAS AND LNG<br />
Growth in demand for natural gas is outstripping that of oil. Gas reserves are<br />
considerable, possibly amounting to at least 20 years more than oil.<br />
However, these major reserves are far removed from markets and depletion of reserves<br />
in countries such as the UK and the US means that activity is focused on longdistance<br />
subsea pipelines.<br />
Despite this, much gas is economically stranded and at present liquefaction offers the<br />
only real solution. Investment in liquid natural gas (LNG) plants, LNG tankers and
MARINE INDUSTRIES GLOBAL MARKET ANALYSIS<br />
47<br />
offshore import terminals is set to boom. <strong>Analysis</strong> indicates a 40% growth in spend,<br />
which over the next few years will start to exceed $10 billion per annum. 20 However,<br />
in the longer term the demand for LNG is set to grow much more.<br />
Another factor that could boost the use of gas is a growth in its conversion to liquid<br />
fuels – gas to liquids. GTL, regarded as a high cost process, has been made increasingly<br />
viable by high oil prices and the abundance of gas supplies, resulting in major<br />
investments in the Middle East.<br />
OIL PRICES TO INCREASE<br />
Growing world oil demand and reducing non-OPEC production means more tanker<br />
movements from the Middle East and West Africa, particularly to the developing<br />
countries. As OPEC’s share grows it will increasingly be in a position to more<br />
effectively control global supply and a sustained rise in oil prices will therefore occur.<br />
The balancing act between getting top dollar for its oil and damaging customer<br />
economies by prices that are too high will be difficult to get right and requires<br />
OPEC members to bring on-stream much more capacity to satisfy demand – the big<br />
question is can they do this<br />
It is generally accepted that the major OPEC economies need $30 per barrel oil to<br />
balance their economies, a figure inflated by recent falls in the value of the US dollar.<br />
In short, it is very unlikely that from now on we will see a sustained period with<br />
prices much below this $30 threshold.<br />
Figure 5.2: <strong>Global</strong> Oil Supply to Peak<br />
PEAK OIL<br />
As we look ahead the situation of increasing demand and reducing production<br />
capacity raises fundamental concerns.<br />
<strong>Analysis</strong> for ‘The World Oil Supply Report’ shows that it is increasingly likely that oil<br />
supplies will peak, possibly within a decade. In short, the world is likely to run out of<br />
(cheap) oil. It is becoming increasingly recognised that the situation is not if this will<br />
happen but when and how the energy supply industry will react.<br />
The fundamental conclusions remain that the world’s known and estimated yet-tofind<br />
oil reserves and resources cannot satisfy even the present level of production<br />
beyond 2020. Just 1% growth in demand is such that a production peak occurs as<br />
early as 2016 at some 85 million barrels per day. Increased demand gives a higher<br />
peak but earlier.<br />
Source:<br />
“The World Oil Supply Report”<br />
Douglas-Westwood Limited<br />
20<br />
‘The World LNG & GTL Supply Report’, Douglas-Westwood Limited
48 MARINE INDUSTRIES GLOBAL MARKET ANALYSIS<br />
Although the response will be complex, this will ultimately result in a sustained major<br />
increase in oil prices and a huge demand for other energy sources.<br />
Figure 5.3: Oil Prices 1996–2004<br />
OTHER ENERGY SOURCES<br />
As discussed earlier, we expect a strong growth in demand for natural gas, particularly<br />
LNG. Some power generation capacity will have to switch back to environmentally<br />
unfashionable coal, possibly sourced from countries such as Australia leading to<br />
increased demand for coal carriers. However, ultimately it is likely that nuclear power<br />
will have to be resurrected.<br />
For Europe, marine renewable energy has prospects for strong growth, particularly<br />
offshore windpower, as onshore sites are used up. <strong>Analysis</strong> of prospects in the<br />
‘The World Offshore Wind Database’ suggests a capital spend of nearly $10 billion over<br />
the next five years.The immediate growth market is the UK where we forecast 499<br />
turbines will be installed offshore followed later by Germany with 558. Ireland, with<br />
its excellent coastal wind regime has prospects for power generation far above its own<br />
needs and consequently for exports to the UK.<br />
Source: futures.tradingcharts.com<br />
Wave and tidal power is an embryonic industry but with good long-term prospects.<br />
‘The World Wave and Tidal Database’ is forecasting the cost of annual installation to<br />
reach $150 million by 2006. Here the UK is the market leader, but again Ireland has<br />
excellent potential.<br />
ENERGY – A LONG TERM VIEW<br />
Increasing Energy Prices – There is growing support for the view that oil prices<br />
could increase considerably in the early years of the next decade. Unmanaged, this<br />
could have a significant impact on global GDP and world trade.<br />
Energy Carriers – High oil demand mainly emanating from China has resulted in a<br />
surge of orders for tankers.This new capacity will take some time to be fully absorbed<br />
by the market and may result in some medium-term oversupply. However, we then<br />
expect long-term growth trend to resume.The problem will then become the limits<br />
of oil supplies which we believe could occur around 2015.This is likely to reinforce<br />
the present strong growth in demand for LNG carriers, increase development of<br />
demand for liquid petroleum gas (LPG) carriers and drive a long-term growth in the<br />
coal freighters market.
MARINE INDUSTRIES GLOBAL MARKET ANALYSIS<br />
49<br />
Renewable Energy – This is regarded as a high cost option. However, in light of<br />
rising oil, gas and coal prices, past comparisons of the costs of generating energy from<br />
renewable sources are probably in the main based on input energy costs for electricity<br />
generation now some 50% below present levels.<br />
In the long-term, fossil-fuel generation costs can only increase and a likely effect is<br />
that the present emphasis on developing renewable energy for environmental reasons<br />
will be overtaken by a drive to ensure security of supplies.<br />
Investment in renewable energy should be a key factor in national strategy. In light of<br />
future shortfalls, investment in energy is a win-win situation.
50 MARINE INDUSTRIES GLOBAL MARKET ANALYSIS
MARINE INDUSTRIES GLOBAL MARKET ANALYSIS<br />
51<br />
6 Shipping & Transport<br />
Definition – expenditure on all shipping activities.The UNCTAD estimate based on a<br />
percentage of the value of total world seaborne trade is referenced by shipowner organisations.<br />
1999–03 2004 2005–09<br />
Irish <strong>Market</strong> €M 5,612 1,000 9,460<br />
UK <strong>Market</strong> €M 61,161 20,442 86,201<br />
Europe <strong>Market</strong> €M 452,186 151,137 637,315<br />
World <strong>Market</strong> €M 1,011,600 342,743 1,436,684<br />
6.1 INTRODUCTION<br />
There are more than 50,000 merchant ships trading internationally.The world fleet is<br />
registered in over 150 nations, and manned by over a million seafarers of virtually<br />
every nationality. 21<br />
Figure 6.1: Tonne-miles & Charter Rates<br />
The main driver of the shipping industry is the tonnage of seaborne trade (import &<br />
export), the volume and geographic distribution of which changes as a function of<br />
nations’ GDP. Seaborne transport is estimated to be responsible for up to 90% of<br />
world trade and in the case of some countries such as Brazil and Peru, 95%.<br />
The volume of trade impacts on availability of vessels and hence vessel charter rates.<br />
In effect, a relatively small increase in demand can result in a large increase in<br />
shipping rates (and vice versa).The result is considerable variations in the values of<br />
the shipping sector from year to year.<br />
Over the last four decades seaborne trade has nearly quadrupled and as shown in<br />
figure 6.1 the volume of shipping business continues to rise.The OECD estimates<br />
a world trade growth at 7.8% for 2004 and 9.1% for 2005.<br />
The ClarkSea index in 2004 shows rates averaging $28,000 – compared with previous<br />
ten-year average of $13,800.The chart above also shows the increasing instability of rates.<br />
Source: Fernleys &Clarksons<br />
Figure 6.2: Shipping – World <strong>Market</strong><br />
In the container sector, trade growth is forecast at 10.5% in 2005, slowing slightly to<br />
9.7% in 2006. However, on the supply side, the container vessel fleet is expected to<br />
increase by 9.8% in 2005, 12.6% in 2006 and 8.8% in 2007. So overall, a ‘soft landing’<br />
is projected for container shipping rates. 22<br />
6.2 WORLD SHIPPING MARKET<br />
We estimate merchant shipping was a €243 billion industry in 2003. A rise in world<br />
trade of 16% mainly driven by the Chinese economic boom has driven up shipping<br />
rates and means the market is likely to have grown to €343bn in 2004 – the best year<br />
for 30 years. Although seaborne trade will continue to increase, we forecast falling<br />
freight rates as more shipping capacity enters the market resulting in an average of<br />
€287bn from 2005–09.<br />
Source: Douglas–Westwood<br />
Shipping has traditionally been a boom-bust industry where any major upturn is<br />
eventually undermined by over-investment in new vessels. Drewry Shipping has stated<br />
that the 14% increase in shipping capacity in 2006 is likely to outstrip demand in that<br />
year.The Korea Research <strong>Institute</strong> expects tanker supply to outstrip demand in 2005.<br />
21<br />
http://www.marisec.org/shippingfacts/keyfacts.htm<br />
22<br />
Clarkson’s reported in Lloyd’s List, p4 2 Jan 05
52 MARINE INDUSTRIES GLOBAL MARKET ANALYSIS<br />
Table 6.1: Shipping – World <strong>Market</strong><br />
1999–03 2004 2005–09<br />
Africa 7,861 2,693 11,233<br />
Asia 401,104 137,383 573,153<br />
Australasia 6,391 2,189 9,132<br />
E Europe/FSU 22,625 7,749 32,330<br />
Latin America 14,911 5,107 21,308<br />
Middle East 36,610 12,539 52,313<br />
North America 69,912 23,946 99,901<br />
Western Europe 452,186 151,137 637,315<br />
TOTAL (€M) 1011,600 342,743 1436,684<br />
Source: Douglas-Westwood<br />
Figure 6.3: Shipping – Regional Segmentation<br />
2005–2009<br />
Our own view is of a gradual slowing of shipping sector growth and a return to more<br />
normal long-term trends by 2007.<br />
It is difficult to quantify the value of the volume of world seaborne trade in monetary<br />
terms, as figures for trade estimates are traditionally in terms of tonnes or tonne-miles,<br />
and are therefore not comparable with monetary-based statistics for the value of the<br />
world economy.<br />
However, the United Nations Conference on Trade and Development (UNCTAD)<br />
estimates that the operation of merchant ships contributes about US$380 billion<br />
(€292bn) in freight rates within the global economy, equivalent to about 5% of total<br />
world trade. 23<br />
In order to check the above we have analysed earnings of some major ship owners.<br />
As an example, Danish shipping has earnings of €15bn of which some $5.3bn comes<br />
from its own ships. Danish ships form about 2% of the merchant fleet by gross<br />
tonnage. If other owners have similar earnings then total world earnings of €243bn<br />
are suggested and this is the figure we use.<br />
There is no simple way of precisely apportioning earnings from shipping to regions<br />
and countries.The complication is that a ship may be operating under the flag of<br />
country A, owned by a company in country B, chartered by a company in country C<br />
and trading between countries D and E.The result is that parts of the associated<br />
business will accrue to A, B, C, D and E.<br />
Source: Douglas–Westwood<br />
Figure 6.4: Shipping Rates 2001–04<br />
6.3 CHINA & THE WORLD MARKET<br />
In 2004, rates for many types of shipping were double the averages achieved during<br />
the 1999–2003 period and in October spot rates for some very large crude carriers<br />
(VLCC) reached five times the long-term average.<br />
Shipowners have responded and the waiting time for new vessel deliveries reached<br />
three years.<br />
Chinese economic growth is the main reason for the remarkable increase in shipping<br />
rates and industry profit. In 2003, China’s imports expanded by 40% in nominal dollar<br />
terms while its exports grew by 35%.<br />
China is in the process of becoming the leading global manufacturing base – ‘the<br />
workshop of the world’ (a position once claimed by the UK). Much is driven by low<br />
wage rates, often 90% below European levels. Since the late 1970s it has managed to<br />
Source: Danish Shipping Association/R.S. Platou<br />
23<br />
‘shipping Facts’ http://www.marisec.org/shippingfacts/worldtradevolume.htm
MARINE INDUSTRIES GLOBAL MARKET ANALYSIS<br />
53<br />
double its GDP every ten years and this is likely to continue for the foreseeable<br />
future. However, the recent economic boom could return to its long-term trend with<br />
8% forecast in 2005 compared with an estimated 9.3% in 2004. 25 (It should be noted<br />
that unofficial estimates have put China’s GDP growth at 11% in 2004.)<br />
Figure 6.5: Danish Shipowners Earnings 2003<br />
The growth rate of capital asset investment is expected to be 27% in 2004, (a drop of<br />
15% from the first quarter) and 24% in 2005.The Chinese government has stated that<br />
cooling the economy will be a priority in 2005 and rising interest rates and<br />
government-imposed lending curbs are reported to be initiated.<br />
Economic activity has exceeded long-term rates as large amounts are imported to<br />
both feed manufacturing and infrastructure developments.The overall result is an<br />
unprecedented increase in two-way traffic – import of bulk commodities and export<br />
of containers of manufactured goods.<br />
Source: Danish Shipping – Figures 24<br />
Further Chinese growth is also likely as the European global quota system on textiles<br />
and clothing is lifted. Ultimately there must be a limit as high growth rates become<br />
harder to maintain. For example, China already has 80% share of US imports of toys<br />
and footwear.<br />
6.4 EUROPEAN MARKET<br />
Within Europe the market was estimated to be worth €151 billion in 2004.The<br />
European Union is very dependant on maritime transport. Official statistics state that<br />
70% of external trade (the European Community Shipowners Association say 90%)<br />
and 20% of internal trade in terms of volume is made by sea. A large part of the<br />
increase over the years can be attributed to the import of oil and oil-based products.<br />
Shipping divides into two areas; deep-sea transport – shipping on long sea routes, and<br />
short-sea shipping – between national or European ports.<br />
It has been stated that there were 14,000 enterprises active in the EU in 2001<br />
generating €13.4 billion of added value and employing 155,000 persons. (Includes<br />
both deep-sea and coastal transport.) The value added at 232% of personnel costs<br />
compares with an average (for non-financial services) of 148%.<br />
The sector is characterised by ‘flags of convenience’ or ‘open registries’ whereby<br />
vessels controlled by owners in one country are registered in another that offers more<br />
attractive terms for taxation and legislation.<br />
24<br />
‘Danish Shipping – Figures’ Danish Shipowners Association. 2004.<br />
25<br />
‘Survey by the China National Bureau of Statistics’ reported in China Daily, 20 December 2004.
54 MARINE INDUSTRIES GLOBAL MARKET ANALYSIS<br />
Table 6.2: Top 25 Shipowners – Tonnage<br />
Country GT 1,000 GT%<br />
1 Greece 90590 16.0%<br />
2 Japan 76423 13.5%<br />
3 Germany 36314 6.4%<br />
4 Norway 35169 6.2%<br />
5 USA 31396 5.5%<br />
6 China 29884 5.3%<br />
7 Hong Kong 17502 3.1%<br />
8 South Korea 16665 2.9%<br />
9 Taiwan 15291 2.7%<br />
10 UK 14552 2.6%<br />
11 Singapore 14165 2.5%<br />
12 Denmark 12347 2.2%<br />
13 Russia 10621 1.9%<br />
14 Italy 10302 1.8%<br />
15 Malaysia 7211 1.3%<br />
16 India 7079 1.2%<br />
17 Saudi 6655 1.2%<br />
18 Switzerland 6527 1.2%<br />
19 Turkey 5573 1.0%<br />
20 Sweden 5402 1.0%<br />
21 Iran 4958 0.9%<br />
22 Canada 4407 0.8%<br />
23 France 4281 0.8%<br />
24 Netherlands 3969 0.7%<br />
25 Philippines 3712 0.7%<br />
ROW 95411 16.8%<br />
GT Total World 566406 100.0%<br />
In an effort to counteract the impact of this 11 European countries have adopted a<br />
favourable taxation programme based on tonnage operated rather than profits and this<br />
‘tonnage tax’ has resulted in more owners registering ships with European countries.<br />
Table 6.2, of the top-10 ship-owning countries shows the success of Germany which<br />
has grown its controlled and registered DWT by 67% in four years to take third<br />
place. By comparison Norway has failed to maintain a competitive position, falling to<br />
fifth place.<br />
The EEA (European Economic Area) registered fleet increased to about 28% of the<br />
world fleet in 2003, a growth of 50% compared to the previous year. Clearly the fleets<br />
of the new EU countries contributed to this but even without these there was<br />
growth of almost 5%. 26 However, arguably the more significant figure is that the EU<br />
controlled fleet now represents 44% of the world merchant fleet.<br />
Greece is the biggest shipping operator both in Europe and worldwide, but secrecy<br />
regarding its shipping turnover is legendary. However, the Bank of Greece expects<br />
turnover of €10.9bn for the first 10 months of 2004.We believe this figure grossly<br />
undervalues Greek market share of 16% of world gross tonnage (as Denmark<br />
generates the same turnover with 2.2%).<br />
Greek shipowners control some 161 million DWT, a value that has increased at 4.6%<br />
per annum since 2000.<br />
Denmark, which has a supportive tax regime has seen its flagged tonnage grow by<br />
40% over the last decade. Danish shipping revenues were €15bn in 2003.<br />
Finland has few newbuilds registered under its flag, with the average age of the fleet<br />
at nearly 20 years, almost entirely manned by Finnish seafarers due to a strong union<br />
opposing foreign employees. Finland’s foreign trade shipments (import and exports)<br />
were over 93 million tonnes in 2003.<br />
France – the French fleet consists of 207 ships and has an average age of less than<br />
eight years, representing 4.6 million GT and 6.2 million DWT.<br />
Germany’s fleet in 2003 was expanding with 118 newbuilds, making it the fourth<br />
largest in the world, with its largest component being its 919 container ships. ISL<br />
report that German shipowners increased their controlled tonnage by an annual<br />
average of 13.7% to control 51 million DWT, but only 7 million was attributable to<br />
the German registered tonnage. At the end of 2004, German owners controlled 2,560<br />
26<br />
‘Current International Shipping <strong>Market</strong> Trends’ European Commission. OECD Workshop on Maritime Transport.<br />
Paris, November 2004.
MARINE INDUSTRIES GLOBAL MARKET ANALYSIS<br />
55<br />
ships.The fleet has doubled since the introduction of the tax five years ago. (It is<br />
reported that “in exchange for considerable subsidies” a further 110 vessels will be<br />
brought into the German flagged fleet by end 2005). 27<br />
Ireland’s tax tonnage regime and low corporate tax rate has been of interest to<br />
national and European shipowners and the country’s sector has shown good<br />
development. Older tonnage is being replaced by newer secondhand ships,<br />
47 vessels entered with the Irish Chamber in 2003 – an increase of 68% since<br />
1999.The Irish Maritime Development Office (IMDO) estimate that since 2000<br />
employment in international shipping has increased by an average annual rate of<br />
5.6%. 28 These increases are mainly attributed to the introduction of a tonnage tax<br />
regime. A report commissioned by the <strong>Marine</strong> <strong>Institute</strong> estimates that shipping<br />
and maritime transport was a €1.3bn sector in 2003.<br />
Italy’s fleet numbers 1,407 vessels of which 676 are over 1,000 GT.There has been<br />
a 4% increase in tonnage on 2002, but a 2% decrease in vessel numbers.There are a<br />
large number of newbuilds within the fleet and growing registration in the Italian<br />
International Register. 134 newbuilds were ordered during the 2000–2003 period.<br />
In 2003 shipping (the transport of cargo and passengers) totalled €12.2 billion and<br />
employed 26,800 people and the maritime sector as a whole produced €26.3 billion.<br />
Netherlands – the Netherlands witnessed a slight decrease in the numbers of ships<br />
registering in the country from the end of 2003 (786), compared to 2002 (810).The<br />
first time since 1996 numbers have not increased, perhaps signalling that newbuilds<br />
are being registered elsewhere or existing ships re-registered outside the country.The<br />
shipping industry is worth €12.6 billion and employs 190,000.<br />
Table 6.3: Controlled & Registered Fleets<br />
DWT (M) 2000 2004 Growth<br />
Greece 135.1 161.4 19%<br />
Japan 96.3 114.2 19%<br />
Germany 30.9 51.5 67%<br />
China 39.2 49.1 25%<br />
Norway 54.1 43.8 –19%<br />
US 44.5 40.6 –9%<br />
Hong Kong 36.7 37.9 3%<br />
Korea 35.5 26.2 –26%<br />
Taiwan 19.9 23.7 19%<br />
Singapore 19 23.3 23%<br />
Sub-total 501.3 571.7 14%<br />
other 257.2 283.2 10%<br />
World Total 758.5 854.9 13%<br />
Europe 341.2 375.2 10%<br />
Asia & Oceania 309.9 362.6 17%<br />
America 62.9 58.8 –7%<br />
Africa 6 5.1 –15%<br />
Unknown 38.7 53.3 38%<br />
Source: ISL, ships =>1,000 dwt<br />
Norway did not benefit from the steep rise in freight rates experienced internationally<br />
in 2003.The fleet also shrank by 48 ships, a similar decrease to 2002, leaving 953.The<br />
Norwegian Tonnage Tax System is not competitive with some EU countries, but there<br />
are plans to align it with the EU and a commission was set up in late 2004.<br />
Portugal’s fleet continues to decline, due to lack of development in the national<br />
shipping policy, although a commission for a cruise ferry passenger liner was recently<br />
awarded and three bulk carriers were purchased in 2003.<br />
Spain had a more positive year, with the Spanish controlled merchant fleet increasing<br />
8.3% in GT in 2003 with 40 newbuilds since 2000. Maritime trade increased by 1.4%<br />
from 2002, to 290 million tonnes.<br />
27<br />
Lloyd’s List p3, 26 Jan 2005.<br />
28<br />
Duffy, C, Ireland – growing international shipping centre. Shipping Finance Annual 2004/5.
56 MARINE INDUSTRIES GLOBAL MARKET ANALYSIS<br />
Sweden – in 2003, Swedish shipping consisted of 571 ships totalling 10.8 million<br />
DWT, a slight increase on 2002. 29 new vessels totalling 1.1 million DWT were<br />
delivered to Swedish shipowners during 2003. During 2004 12 new vessels were to<br />
be delivered.<br />
UK – since January 2000, the UK-owned trading fleet has now more than doubled,<br />
and the tonnage under the UK flag has increased by over 250%. During 2003 UK<br />
shipowners purchased vessels (new and second hand) to the value of €898 million. 29<br />
At the end of 2003, the UK managed nearly 6% of the world’s DWT which suggests<br />
a turnover of €14.6 billion. At the end of 2004, 71 companies operated 758 ships.<br />
Table 6.4: Annual Average Growth Rate (%)<br />
2000–05 05–10 10–15 15–22<br />
Dry Bulk 3.0 2.8 1.7 1.5<br />
Tanker 1.3 1.7 1.4 1.3<br />
General Cargo 3.4 4.2 3.2 2.7<br />
Container 5.7 5.3 4.3 3.8<br />
Source: ISL/<strong>Global</strong> Insight World Trade Service<br />
6.5 THE LONG-TERM – 2010 ONWARDS<br />
The strong growth of 2004 is unlikely to be sustained at such high levels. Limits are<br />
being experienced in other parts of the transportation infrastructure – the Panama<br />
Canal is operating at 93% of capacity.The increasing need for major infrastructure<br />
investments may be a factor restraining growth – the Panama Canal needs $8bn of<br />
investment.<br />
However, world seaborne trade is predicted to grow substantially over the long term.<br />
Container traffic should experience the strongest growth as there is a continuing shift<br />
to the use of containers for general cargo. From 576 million tonnes in 2004, (11% of<br />
world seaborne trade) container traffic is expected to reach 1.3 billion tonnes (46%)<br />
by 2022. 30<br />
Other forecasts say there will be another 2 billion tonnes of cargo by 2025.The<br />
OECD region is now economically mature so it is growing quite slowly. As Asia<br />
grows and China finds its feet the importance of the ring of economies around the<br />
South China Sea will increase. India is on the road to deregulation and is growing<br />
fast. Over the next twenty five years the ex-Soviet states may overcome their present<br />
difficulties and become a more substantial economic force. Latin America is growing<br />
steadily and with each decade will gain critical mass as a centre of trade. 31<br />
In the case of China, its exports will have doubled between 2000 and 2005. Its<br />
container exports are forecast to grow from some 15 million TEU in 2004 to 40<br />
million by 2020.<br />
All such forecasts assume continued availability of cheap energy – a situation we<br />
greatly doubt.<br />
29<br />
‘Transport Statistics Report 2003’. UK DoT, published Oct 2004.<br />
30<br />
<strong>Global</strong> Insight World Trade Service.<br />
31<br />
‘The Demand for Sea Transport 2000 to 2025’ Clarksons, 2004.
MARINE INDUSTRIES GLOBAL MARKET ANALYSIS<br />
57<br />
7 <strong>Marine</strong> Commerce<br />
Definition – the sector includes ship operations, brokering and insurance to specialist<br />
publications. (We exclude shipping operations revenues which are covered under ‘shipping’.)<br />
1999–03 2004 2005–09<br />
Irish <strong>Market</strong> €M 209 55 217<br />
UK <strong>Market</strong> €M 5,636 1,477 5,846<br />
Europe <strong>Market</strong> €M 10,437 2,736 10,826<br />
World <strong>Market</strong> €M 26,092 6,840 28,670<br />
7.1 INTRODUCTION<br />
<strong>Marine</strong> Commerce is our preferred term for marine services, a long-term growth<br />
sector modulated by fluctuations in vessel charter rates. London is the world’s leading<br />
centre, but its position is increasingly under threat from SE Asia (particularly<br />
Singapore and increasingly Shanghai) due to the high cost of doing business in<br />
Europe compared to SE Asia, together with the growth of that region as a major user<br />
of shipping.<br />
Figure 7.1: <strong>Marine</strong> Commerce – World <strong>Market</strong><br />
We estimate that London and Western Europe together accounts for 38% of the<br />
world market and Asia 24%.<br />
Due to the complex nature of marine commerce operations, the figures given are<br />
revenues rather than total sales which would be much greater.<br />
<strong>Marine</strong> commerce is of major strategic importance as a successful centre tends to<br />
cluster decision makers for many associated marine activities.<br />
7.2 WORLD MARKET<br />
The <strong>Marine</strong> Commerce sector was worth almost €7 billion in 2004.‘<strong>Marine</strong><br />
Commerce’ is perhaps a better description than the often-used term ‘<strong>Marine</strong><br />
Services’, as the sector ranges from ship operations, brokering and insurance to<br />
specialist publications.<br />
This is a long-term growth sector, although the 2005–2009 average annual growth<br />
rate is -1.8% due to a spike in activity in 2004. However, over the entire period sector<br />
value is set to rise from €4.1 billion in 1999 to €6.1 billion in 2009. London is still<br />
the world’s leading centre, but its position is increasingly under threat from SE Asia<br />
(particularly Singapore). <strong>Marine</strong> commerce is of major strategic importance as a<br />
successful centre tends to cluster decision makers for many associated activities.<br />
7.3 EUROPEAN MARKET<br />
The European <strong>Marine</strong> Commerce sector was worth €2.7 billion in 2004, this share<br />
constituting 40% of the world.The large share is attributed to clusters of marine<br />
financial activity. Usually clustered around a specific city, the marine commerce sector<br />
is comprised of many activities. Detailed analysis of marine commerce clusters are<br />
rare, figure 7.3, drawn from a recent report, depicts London’s activities. 32 The London<br />
model is not directly transposable onto marine commerce in other cities, but clearly<br />
Source: Douglas–Westwood<br />
Table 7.1: <strong>Marine</strong> Commerce – World <strong>Market</strong><br />
1999–03 2004 2005–09<br />
Africa 522 137 573<br />
Asia 5643 1505 6949<br />
Australasia 783 205 860<br />
E Europe/FSU 1305 342 1433<br />
Latin America 1044 274 1147<br />
Middle East 1044 274 1147<br />
North America 5315 1368 5734<br />
Western Europe 10437 2736 10826<br />
TOTAL (€M) 26092 6840 28670<br />
Source: Douglas-Westwood<br />
Figure 7.2: <strong>Marine</strong> Commerce – Regional<br />
Segmentation 2005–2009<br />
32<br />
‘The Future of London’s Maritime Services Cluster’. 2004. Corporation of London.<br />
Source: Douglas–Westwood
58 MARINE INDUSTRIES GLOBAL MARKET ANALYSIS<br />
Table 7.2: Companies in London’s <strong>Marine</strong><br />
Commerce Cluster<br />
Category<br />
No.of Companies<br />
Ship Agency & Forwarding 336<br />
Shipowners, Operators & Managers 206<br />
Marin Insurance 193<br />
Shipbrokers 143<br />
Maritime Organisations / Associations 105<br />
Maritime Legal Services 101<br />
Consultants & Surveyors 98<br />
Ship Finance & Related Services 62<br />
Charterers 42<br />
ICT Services 35<br />
P&I insurance 26<br />
Maritime Education & Training 12<br />
<strong>Marine</strong> Personnel 9<br />
Classification Society 8<br />
Media and Publishing 6<br />
Total 1,382<br />
serves to depict the very wide range of participants. Of particular significance is the<br />
interaction with the London financial services community.<br />
One difference to other marine commerce clusters is the presence of major<br />
international organisations such as IMO in London which serve to act as a point of<br />
attraction for a wide range of other official bodies. Also of significance is the presence<br />
of the Lloyd’s insurance market and the Baltic Exchange.<br />
Net overseas earnings (2002) from marine commerce in the city are estimated at<br />
£1.1bn (€1.7bn), to which earnings from overseas shipping adds a further £1.1bn,<br />
giving a total of £2.2bn (€3.4bn). (In this report we treat shipping as a separate<br />
activity.)<br />
Total sales are considerably greater.The shipping sector for example, comprised of<br />
owners, agencies, brokers & consultants’ stated sales of £9.4bn (€14.4bn).<br />
In addition to the numbers in table 7.2, a further 375 companies have a trading office<br />
in London.The report notes that it is difficult to determine how big or important the<br />
London cluster is, but it is certainly the largest in the world. Significant marine<br />
commerce clusters exist in the other major European shipping countries such as<br />
Denmark, Germany, the Netherlands and Norway.<br />
Figure 7.3: <strong>Marine</strong> Commerce Cluster (London)
MARINE INDUSTRIES GLOBAL MARKET ANALYSIS<br />
59<br />
7.4 THE LONG-TERM – 2010 ONWARDS<br />
The supply of marine commercial services is a fundamental need of the world’s<br />
shipping, shipbuilding and, to a lesser extent, most other marine sectors. Shipping<br />
activity remains the key driver, therefore demand will grow in line with the<br />
shipping sector.<br />
The main potential for change is in the centres from where the market for marine<br />
commerce will be supplied.The major factors that may increasingly determine this is<br />
the growth of the Asian market (mainly China) and the strength of Singapore as a<br />
major financial sector.
60 MARINE INDUSTRIES GLOBAL MARKET ANALYSIS
MARINE INDUSTRIES GLOBAL MARKET ANALYSIS<br />
61<br />
8 Ports<br />
1999–03 2004 2005–09<br />
Irish <strong>Market</strong> €M 832 150 780<br />
UK <strong>Market</strong> €M 10,429 1,842 9,595<br />
Europe <strong>Market</strong> €M 58,695 10,478 54,569<br />
World <strong>Market</strong> €M 141,979 25,017 135,526<br />
Definition – port revenues based on average prices per tonne of cargo loaded and unloaded.<br />
8.1 INTRODUCTION<br />
The Ports & Terminals Guide lists 8,336 ports and terminals worldwide. Perhaps some<br />
1,600 or so of these are significant ports. In 2002, the top 50 ports handled 5.8 billion<br />
tonnes of cargo. In 2003 vessel calls at world ports totalled 576,906. 33<br />
Figure 8.1: Ports – World <strong>Market</strong><br />
Ports are a major benefactor from the strong growth in economic activity in China<br />
and to a lesser extent India. Rotterdam increased its tonnage by 8% in 2004 and<br />
Amsterdam by 13%.<br />
European ports’ container traffic showed a 10% increase to 60 million TEU (twenty<br />
foot equivalent units) in 2003 and it appears that this will be exceeded in 2004. Initial<br />
figures from Rotterdam show a 16% surge in container traffic to 8.3 million TEU in<br />
2004 and Hamburg achieved its fifth year of double digit growth.<br />
However, container shipping capacity is growing faster than capacity of many ports to<br />
receive it. Concerns have been expressed as to whether the European container<br />
terminals and their hinterland connections can adequately adjust to the continuing<br />
sharp increases in container volumes in a timely manner. US ports are also<br />
experiencing severe congestion.<br />
The result is the need for very large investment in expanding port capacity<br />
worldwide. For example, Shanghai is spending $10bn in building what it expects to<br />
be the world’s largest container port. Kuwait is to build a $1.2bn container port<br />
becoming operational in stages from 2008. Spain has announced a plan to spend<br />
€23bn on the maritime and ports sectors over the 15 years to 2020 – the proposal<br />
particularly aims to boost short-sea shipping. New York’s capital improvements in<br />
2005 total $1.7bn.<br />
8.2 WORLD MARKET<br />
The Ports sector worldwide was worth €25bn in 2004. Despite the considerable<br />
numbers of ports, the majority of traffic, 5,700 billion tonnes, flows through the top<br />
50 ports. A practical problem in assessing the market is that most ports do not issue<br />
annual reports that show total sales revenues, but only show tonnage. 34<br />
Source: Douglas–Westwood<br />
Table 8.1: Ports – World <strong>Market</strong><br />
1999–03 2004 2005–09<br />
Africa 3152 569 3083<br />
Asia 32198 5988 34632<br />
Australasia 1849 328 1779<br />
E Europe/FSU 6363 1310 7095<br />
Latin America 7964 1248 6762<br />
Middle East 4641 823 4459<br />
North America 27117 4273 23147<br />
Western Europe 58695 10478 54569<br />
TOTAL (€M) 141979 25017 135526<br />
Source: Douglas-Westwood<br />
Figure 8.2: Ports – Regional Segmentation<br />
2005–2009<br />
Annual reports of some of the largest ports suggest rates per tonne of between<br />
€1.12 to €1.67, whereas the smaller ports can be €2.82 to €3.78. Using these prices<br />
suggests a total turnover for the world ports sector of €26.5 billion in 2003. Since<br />
1999 the sector (in € value terms) increased to €31 billion in 2001, then returned to<br />
previous levels by 2004, at €25 billion. <strong>Analysis</strong> of projections of global trade forecasts<br />
33<br />
‘Vessel Calls at US Ports 2003’, US Department of Transportation, <strong>Marine</strong> Administration Department.<br />
34<br />
e.g.‘The US Public Port Finance Survey’ relies on voluntary responses and shows net income and tonnage.<br />
Source: Douglas–Westwood
62 MARINE INDUSTRIES GLOBAL MARKET ANALYSIS<br />
suggests the sector will grow to €28 billion by 2009. It should be noted that these<br />
values exclude ports’ added-value activities. Also privately-owned tanker terminals and<br />
passenger operations may not be fully included in these values.<br />
8.3 EUROPEAN MARKET<br />
In 2002, Europe had 985 ports of which 285 handle over one million tonnes of<br />
traffic. 35 On average they handle 3.5 billion tonnes of cargo per year and 350 million<br />
passengers – the equivalent of 70% of the entire European population. Europe’s share<br />
of the market amounted to €10.5 billion in 2004.<br />
In Europe the port liberalisation programme started many years ago with the result<br />
that EU ports have been stated to be the cheapest in the world.The European<br />
Transport Workers Federation claim costs for container handling in Europe averages<br />
$100 against $200 for the US and $300 for Japan.<br />
Table 8.2: Top Eight Operators by TEU<br />
TEU (M) % Share<br />
HPH 41.50 13.3%<br />
PSA 28.70 9.5%<br />
APM 21.40 6.2%<br />
P&O Ports 16.00 4.6%<br />
Eurogate 10.80 3.5%<br />
DPA/DPI Group 9.55 3.0%<br />
Cosco 7.40 2.3%<br />
Evergreen 6.70 2.1%<br />
Sub-Total 142.05 44.5%<br />
TOTAL (World) 319.61 100%<br />
Source: Drewry Shipping/Lloyd’s List<br />
8.4 CONTAINER OPERATIONS<br />
The great majority of ports are in public ownership and as a result some suffer from<br />
low productivity (particularly in the US). However, capital investment requirements<br />
are resulting in privitisation or ‘liberalisation’ programmes in a number of countries.<br />
The ports that are in private ownership are often focused on container handling.<br />
Drewry’s database records almost 1,500 facilities worldwide. In 2003, the top eight<br />
global operating companies handled 142 million TEU, 44% of all containers shipped<br />
through ports.The revenues are available for two of these (HPA and P&O Ports)<br />
which together are responsible for 18% and total €3.8bn. Scaling up suggests the<br />
container sector of the dry-cargo ports world market is €22.7 billion.<br />
There is significant international mergers & acquisition (M&A) activity – recently<br />
Dubai Ports International acquired the Hong Kong Port operator for $1.23bn.<br />
The sector is divided into:<br />
• <strong>Global</strong> Stevedores – whose primary function is port operations.<br />
• <strong>Global</strong> Carriers – where terminals are used to support container liner services.<br />
• Hybrids – originally carriers, but increasingly operating their terminals as standalone<br />
business units.<br />
35<br />
Eurostat
MARINE INDUSTRIES GLOBAL MARKET ANALYSIS<br />
63<br />
The integration of shipping, terminal operations and road transportation<br />
services means the total value of the container sector greatly exceeds the port<br />
operations element.<br />
Figure 8.3: Chinese Port Container Throughput<br />
<strong>Global</strong>ly, the trend continues in the move away from traditional bulk and break-bulk<br />
(non-containerised) shipping, into unitised cargoes (containerised and roll-on/roll-off)<br />
traffic.Worldwide seaborne dry cargo traffic has doubled from 1.8 billion tonnes in<br />
1980 to a forecast 3.6 billion tonnes in 2004, according to Drewry’s statistics.<br />
The 2003 total was 3.4 billion tonnes and the figure is expected to have risen to<br />
3.78 billion in 2004. (These figures include bulk, break-bulk, ro-ro, semi-bulk and<br />
containers, but not liquid bulks.)<br />
In 1980 containers represented 6.3% of world traffic. In 2003 they accounted for<br />
23.8% and this is expected to rise to 26.6% – 386 million TEU (twenty-foot<br />
equivalent units) – in 2004. By 2010 container port throughput should reach<br />
432 million TEU.This represents total world container port throughput, including<br />
transshipment, when hub ports are used to switch containers from one ship to<br />
another.The main catalyst for growth is Chinese export activity. 36<br />
Source: Drewry Shipping/Lloyd’s List<br />
8.5 ECONOMIC IMPACT<br />
The sector is of particular importance due the generation of considerable economic<br />
activity which is a multiple of port revenues.<br />
In the case of Rotterdam, in 2003 5,741 persons were associated with cargo handling,<br />
but the total direct port-related employment was 44,384 and in addition another<br />
14,391 were in port ‘industries’ such as oil refining, shipbuilding & repair, etc.<br />
In addition to the 58,739 in ‘direct port-related employment’, it is claimed that the<br />
port generates indirect employment to 250,000 people.<br />
8.6 THE LONG-TERM – 2010 ONWARDS<br />
<strong>Global</strong> port activity is set for long term growth, driven by increasing seaborne trade<br />
with the world’s developing economies. More capital expenditure will be required to<br />
expand port capacity and tackle growing congestion. Growth of the cruise market<br />
will also bring opportunities for port development.Within Europe, an added<br />
dimension will be the desire to increase short haul shipping to counteract growing<br />
congestion of land transportation systems.<br />
36<br />
‘Lifeblood of the <strong>Global</strong> Economy’Times Online quoting from Drewry Shipping Consultants 7 Sept 2004.
64 MARINE INDUSTRIES GLOBAL MARKET ANALYSIS
MARINE INDUSTRIES GLOBAL MARKET ANALYSIS<br />
65<br />
9 Cruise Industry<br />
1999–03 2004 2005–09<br />
Irish market €M – 66 –<br />
UK market €M 5,220 1,104 6,458<br />
Europe market €M 11,178 2,365 13,829<br />
World market €M 54,570 12,000 67,436<br />
Definition – revenues of cruise vessel operators.<br />
9.1 INTRODUCTION<br />
The cruise industry offers large potential with major investments being made in<br />
cruise terminals worldwide.The world market is of the order of €12bn however, the<br />
total economic benefit is at least twice that value.<br />
Figure 9.1: Cruise – World <strong>Market</strong><br />
The cruise industry is US-dominated and the US market is generally acknowledged<br />
to account for more than 70% of passengers.The UK is the second largest source<br />
market and strong growth is occurring in Germany. Asia was the fastest growing<br />
source market in the 1990s before regional economic problems but growth is<br />
expected to resume again.<br />
In 2003 total spending by the cruise lines and passengers in the US was $12.9bn, but<br />
the total economic benefit was $25.4bn resulting in the generation of 294,000 jobs. 37<br />
US ports reported 7.1 million passenger embarcations.<br />
On average, a 2,000 passenger ship with 950 crew members generates some $240,000<br />
in on-shore spending per US port call.<br />
In common with a number of the marine sectors the cruise industry is an<br />
international business. Passengers may fly from their home country in Europe to, say,<br />
Miami to join a cruise which visits a different Caribbean country each day. Each<br />
passenger is reported to spend $112 per port visit. In 2003, direct purchases in<br />
Florida, home to the world’s largest cruise port Miami, totalled $4.5bn.<br />
In 2003 there were 258 cruise vessels registered. After a period of overbuilding of<br />
cruise vessels, and an anticipated downturn in passengers the cruise industry is again<br />
growing strongly. Since 2000, the US industry alone has added 20 ships with 50,000<br />
‘lower berths’. At the end of 2004, 21 ships were on order with a capacity of 55,000<br />
lower berths.<br />
Source: Douglas–Westwood<br />
Table 9.1: Cruise – World <strong>Market</strong><br />
1999–03 2004 2005–09<br />
USA 38562 8254 44822<br />
Western Europe 11178 2365 13829<br />
Others 4830 1381 8785<br />
TOTAL (€M) 54570 12000 67436<br />
Source: Douglas-Westwood<br />
Figure 9.2: Cruise – Regional Segmentation<br />
2005–2009<br />
9.2 WORLD MARKET<br />
The world revenues for cruise sector operators was estimated at €12 billion in 2004.<br />
Historically, the sector has grown from being worth €7.7 billion in 1999, representing<br />
a 56% growth over the period to date. Strong growth is expected globally resulting<br />
in a 4.4% average annual growth during the forecast period reaching €14.8 billion<br />
in 2009.<br />
37<br />
‘The Cruise Industry 2003 Economic Survey in the US’ International Council of Cruise Lines.<br />
Source: Douglas–Westwood<br />
Note:This is a very complex market to analyse.Values<br />
in charts & tables above relate to port of embarkation.<br />
Different values and segmentations apply to source<br />
markets (origin of passengers), ports-of-call, cruise vessel<br />
companies’ locations and vessel owners’ locations. In<br />
addition, and in common with other sectors, much<br />
higher values apply to total economic benefit derived by<br />
a country. Country values are for cruises in northern<br />
European waters.
66 MARINE INDUSTRIES GLOBAL MARKET ANALYSIS<br />
Figure 9.3: European Cruise Destinations<br />
(Million Passengers)<br />
9.3 EUROPEAN MARKET<br />
2.7 million Europeans took cruise holidays in 2003 and of these 2 million were in<br />
European waters. 38 This resulted in 8.5 million passenger calls in European ports.<br />
Strong growth is expected with European passengers increasing to 4 million in 10<br />
years.There is a significant growth of smaller specialised cruises in Northern<br />
European waters. (This mirrors the reported increasing use of smaller ports by the US<br />
industry, but in the US much of this is generated by passengers driving to<br />
embarkation ports.The growth of the US drive-to market and indeed some of the<br />
strong US growth may be a function of passengers’ reluctance to fly after 9/11.)<br />
Source: European Cruise Council 2004<br />
In mainland Europe, Spain is the largest source market, Bilbao is spending<br />
€13.2 million on a new cruise terminal.<br />
In Ireland, ship visits increased from 77 in 2000 to 127 in 2003 and Cork and Dublin<br />
had a total of 75,124 passenger ‘calls’ in 2004 out of a European total of 4.3 million. 39<br />
Purchases of goods & services in Ireland totalled €66 million sustaining 484 full<br />
time jobs. 40<br />
The Cruise Ireland report shows the direct and overall contribution at each Irish port was:<br />
• Cork: €10.48 million direct, €19.79 million overall and 149 full time equivalent jobs.<br />
• Dublin: €16.18 million €30.55 million overall and 227 full time equivalent jobs.<br />
• Waterford: € 4.63 million €8.74 million overall and 61 full time equivalent jobs.<br />
Cruise industry operators are dominated by the USA, followed by Norway. A primary<br />
characteristic of the main players is the large size of their vessels.The average age of<br />
the fleet is about 18 years with Greece being the exception at 37 years.<br />
9.4 THE LONG-TERM – 2010 ONWARDS<br />
The Cruise Ireland report notes that “the international cruise industry has<br />
experienced very significant growth over the past five years and offers further<br />
potential as it continues to be the fastest growing sector in the travel and leisure<br />
industry.The cruise companies see their industry as profitable and resilient and<br />
continue to invest and expand their operations.”<br />
The industry is set for long-term growth as whole new market sectors are developed.<br />
These include the more casual family oriented ‘resort’ ships and smaller ships<br />
more associated with cultural tours. It is notable that much cruise industry activity is<br />
repeat business.<br />
38<br />
European Cruise Council 2004 (first statistics)<br />
39<br />
GP Wild reported in Lloyd’s cruise International Aug/Sept 2004<br />
40<br />
Report to Cruise Ireland, March 2004.<br />
(If this ratio is applied across all of Europe then a total economic benefit of €3.7bn is suggested).
MARINE INDUSTRIES GLOBAL MARKET ANALYSIS<br />
67<br />
Table 9.2: European Country Passenger Calls<br />
Country<br />
Total<br />
Croatia 370,617<br />
Denmark 335,056<br />
Estonia 198,205<br />
Finland 350,570<br />
France 29,628<br />
Germany 267,396<br />
Greece 492,985<br />
Iceland 39,060<br />
Ireland 75,124<br />
Italy 2,524,093<br />
Latvia 52,621<br />
Netherlands 82,955<br />
Norway 323,236<br />
Poland 62,734<br />
Portugal 197,855<br />
Russia 242,862<br />
Spain 1,694,393<br />
Sweden 269,231<br />
UK 917,122<br />
TOTAL 8,525,743<br />
Source: Lloyd’s Cruise International<br />
August/September 2004<br />
Table 9.3: European Ports Passenger Calls<br />
Country Total<br />
1 Barcelona Spain 832,853<br />
2 Palma Majorca Spain 664,568<br />
3 Venice Italy 637,258<br />
4 Southampton UK 536,493<br />
5 Naples Italy 535,590<br />
6 Civitavecchia Italy 521,616<br />
7 Piraeus Greece 492,985<br />
8 Savona Italy 468,876<br />
9 Dubrovnik Croatia 370,617<br />
10 Livorno Italy 360,753<br />
11 Helsinki Finland 350,570<br />
12 Copenhagen Denmark 335,056<br />
13 St Petersburg Russia 242,862<br />
14 Tallinn Estonia 198,205<br />
15 Stockholm Sweden 197,964<br />
16 Lisbon Portugal 197,855<br />
17 Dover UK 195,543<br />
18 Oslo Norway 127,893<br />
19 Bergen Norway 122,361<br />
20 Cadiz Spain 112,791<br />
21 Warnemunde/Rost. Germany 95,403<br />
22 Harwich UK 86,843<br />
23 Vigo Spain 84,181<br />
24 Kiel Germany 83,821<br />
25 Amsterdam Netherlands 82,955<br />
26 Visby Sweden 71,267<br />
27 Gdynia Poland 62,734<br />
28 Bremerhaven Germany 61,814<br />
29 Riga Latvia 52,621<br />
30 Guernsey UK 50,027<br />
31 Dublin Ireland 43,121<br />
32 Honnigsvag/Nordkapp Norway 39,871<br />
33 Reykjavik Iceland 39,060<br />
34 Tromso Norway 33,111<br />
35 Cork/Cobh Ireland 32,003<br />
36 Le Havre France 29,628<br />
37 Hamburg/North Sea Germany 26,358<br />
38 Forth Ports UK 24,872<br />
39 Falmouth UK 23,344<br />
Source: Lloyd’s Cruise International<br />
August/September 2004<br />
Table 9.4: Cruise Ships by Owner (end 2003)<br />
Ships Berths Av. Berths<br />
US 85 118,340 1,392<br />
Norway 37 62,540 1,690<br />
Malaysia 18 28,462 1,581<br />
Greece 21 13,622 649<br />
Japan 8 5,921 740<br />
Monaco 12 6,217 518<br />
France 5 5,038 1,008<br />
UK 8 6,439 805<br />
Switzerland 5 4,648 930<br />
Germany 8 2,856 357<br />
Others 51 20,481 402<br />
Total 258 274,564 1,064<br />
Source: ISL
68 MARINE INDUSTRIES GLOBAL MARKET ANALYSIS
MARINE INDUSTRIES GLOBAL MARKET ANALYSIS<br />
69<br />
10 <strong>Marine</strong> Tourism<br />
Definition – all expenditure on seawater and freshwater angling, sailing and boating inland and<br />
at sea, water sports and inland cruises. Excludes travel and accommodation, and other trips to<br />
the beach, etc.<br />
1999–03 2004 2005–09<br />
Irish <strong>Market</strong> €M 709 155 848<br />
UK <strong>Market</strong> €M – – –<br />
Europe <strong>Market</strong> €M 328,302 71,812 392,695<br />
World <strong>Market</strong> €M 762,345 168,189 928,267<br />
10.1 INTRODUCTION<br />
The <strong>Marine</strong> Tourism sector is a difficult sector to gain precise information on,<br />
because few countries produce statistics covering all activities. However, there are<br />
some statistics for individual leisure activities such as angling and boating.<br />
Figure 10.1: <strong>Marine</strong> Tourism – World <strong>Market</strong><br />
If we define marine tourism to comprise seawater and freshwater angling, sailing and<br />
boating (both inland and at sea), water sports and inland cruises, we estimate the<br />
world marine tourism market in 2004 as €168 billion.This figure is approximately<br />
11% of total tourism revenues globally (€1,523 billion).<br />
Comparable Irish figures for the same activities in 2003 are €151 million; however,<br />
the sector as a whole is worth €566 million when other activities relevant to the<br />
Irish market are included (such as whale watching and trips to the seaside). 41<br />
10.2 WORLD MARKET<br />
In 2004 we estimate the value of marine tourism in the world to be €168bn.<br />
In general the tourism sector, including marine tourism, has grown significantly in<br />
recent decades and is a huge industry. Expressing world totals in euros seems to<br />
show a decline from 2002 to 2003, although in dollars the reverse is true, again<br />
demonstrating the depreciation of the dollar against other currencies.<br />
Source:<br />
World Tourism Organization<br />
Douglas–Westwood<br />
The available international tourism data normally refers to international tourism<br />
receipts, which does not include the huge domestic market.There is information<br />
available for the UK & US, which puts UK tourism expenditure at €107 billion in<br />
2003, only 18% of which was from international tourists.The US situation is similar<br />
with 12% of expenditure from international tourists.<br />
By making assumptions on the proportion of domestic to international tourism in<br />
each region, a total tourism value for the world can be estimated. Generally,<br />
developing areas are thought to display the reverse situation of the likes of the US or<br />
UK, with high proportions of international tourism. By applying the proportions, by<br />
region, to the known data on international tourism receipts a figure of total tourism<br />
can be derived. 42 Total world tourism in 2004 is estimated at €1,523bn.<br />
Table 10.1: <strong>Marine</strong> Tourism – Industry<br />
Segmentation 2003 (€ millions)<br />
Ireland UK USA World<br />
Leisure Boating 33 1,715 26,511 [33,139]<br />
Total Tourism 971 106,872 490,509 [1,523,433]<br />
Source: Douglas-Westwood, BMF,<br />
Irish <strong>Marine</strong> <strong>Institute</strong>, NMMA and ICOMIA.<br />
NB: Data in brackets is estimated.<br />
Then to value ‘<strong>Marine</strong> Tourism’, a percentage of each world region’s total tourism<br />
was estimated.This gives the world marine tourism market in 2004 as €155 billion,<br />
11% of all tourism.This percentage varies widely between regions.<br />
41<br />
‘A National Survey of Water-Based Leisure Activities in Ireland 2003’ <strong>Marine</strong> <strong>Institute</strong>.<br />
42<br />
World Tourism Organisation,‘Tourism Highlights’ Edition 2004.
70 MARINE INDUSTRIES GLOBAL MARKET ANALYSIS<br />
Another way of calculating the value of world marine tourism could be to apply a<br />
multiplier to the Leisure Boating Industry Revenues to estimate ‘<strong>Marine</strong> Tourism’<br />
but this approach was not found to be viable. 43<br />
10.3 EUROPEAN MARKET<br />
We value marine tourism in Western Europe at €72bn in 2004. Over the five years<br />
to 1999 this totalled €328bn.We expect growth to continue its long-term trend of<br />
3% annually, and over the period 2005-2009 to total €393bn.<br />
Within Europe, again the only available data for any form of marine tourism is<br />
the ICOMIA statistics for the sales of boats and related equipment & accessories.<br />
New leisure boat sales for Ireland totalled €14 million in 2003 compared to<br />
€324 million for the UK.<br />
10.4 MARINE LEISURE BOATING<br />
<strong>Marine</strong> ‘Leisure Boating’ is a major sub-sector which includes boat sales, repair<br />
& building, marina operators, yacht charter and chandlery.<br />
According to BMF (British <strong>Marine</strong> Federation) statistics the British marine leisure<br />
boating industry grew by 8.5% in 2004, increasing its turnover to a total of<br />
£1.9 billion (€2.85bn). 44 In six consecutive years of growth from 1999 to 2004,<br />
the revenue of the UK leisure boating industry has increased by 57%.<br />
The industry has also shown considerable strength in the export market, growing by<br />
5.6% and bringing in £839 million (€1.26bn) to the UK economy.<br />
The BMF is forecasting further growth in 2005 of 3.3% which would take total<br />
industry revenues to over £2 billion (€3bn) for the first time.The industry employs<br />
approximately 30,000 people.<br />
Leisure boating involves craft of many sizes, from the sailing dingy to the superyacht.<br />
Superyachts (yachts greater than 80 feet in length), represent a particularly important<br />
sector for some countries with 651 presently on order worldwide. <strong>Market</strong> leaders are<br />
Italy, the US, the Netherlands, the UK,Taiwan, Germany and New Zealand.<br />
The development of the sector in Taiwan is particularly interesting as the leisure<br />
boatbuilding sector has been in decline. Increasing costs caused the leisure<br />
boatbuilding sector to fall from $200 million in 1987 to $75 million in 1994 and 70%<br />
of the yards closed.The remaining players ventured into luxury yacht production and<br />
43<br />
Ireland is the only country that there is available data on which to make this comparison.The boating industry is of varying<br />
importance to tourism in general, by country (Ireland: 12%, UK: 2% & US: 5%).This is probably due to the leisure boat industries<br />
in different countries varying massively in their make up and overall size. For example, new boat sales make up different proportions<br />
of the leisure boating industry (Ireland: 14%, UK: 19% & USA: 35%).There are also likely to be big differences between regions,<br />
especially comparing the developed and developing world. For these reasons, this approach was not used.
MARINE INDUSTRIES GLOBAL MARKET ANALYSIS<br />
71<br />
revenues grew to an estimated $180 million (€144 million) in 2004. A special yacht<br />
manufacturing zone is now being built in southern Taiwan. 45<br />
10.5 THE LONG-TERM – 2010 ONWARDS<br />
The forecast for world international tourist arrivals suggests a 4.1% annual growth<br />
rate from 1995 through to 2020.Therefore, it is reasonable to assume that marine<br />
tourism will also continue its increase.<br />
Europe’s growth rate is lower at 3% over the same period.Applying this same<br />
percentage growth to marine tourism suggests a market value of €198 billion in 2009.<br />
44<br />
‘British <strong>Marine</strong> Federation statistics’ 2005.<br />
45<br />
Financial Times, p28, 31 Jan 05
72 MARINE INDUSTRIES GLOBAL MARKET ANALYSIS
MARINE INDUSTRIES GLOBAL MARKET ANALYSIS<br />
73<br />
11 Ocean Survey<br />
Definition – all expenditure on seabed survey and shallow seismic survey for civil purposes, such<br />
as navigational charts and oil & gas. Excludes deep seismic.<br />
1999–03 2004 2005–09<br />
Irish <strong>Market</strong> €M 64 12 54<br />
UK <strong>Market</strong> €M 608 104 517<br />
Europe <strong>Market</strong> €M 3,201 538 2,722<br />
World <strong>Market</strong> €M 11,715 2,013 10,137<br />
11.1 INTRODUCTION<br />
Survey of the oceans for civilian purposes has a number of distinct sectors including<br />
hydrographic survey for the production of navigational charts, exploration and<br />
development of oil & gas reserves, port & harbours, submarine cable routes, windfarm<br />
installations, etc.<br />
Figure 11.1: Ocean Survey – World <strong>Market</strong><br />
Ocean Survey is a large activity, with some 737 vessels worldwide having significant<br />
survey capability.The number of vessels operated by national hydrographic agencies<br />
alone total 322 and these have crews exceeding 8,700 people. 46<br />
The production of hydrographic survey equipment is also a major activity,<br />
(although we exclude it from this section.) When this is included, our view is that<br />
perhaps 18,000 people are employed in various forms of activities related to ocean<br />
survey worldwide.<br />
11.2 WORLD MARKET<br />
We forecast that the world market will exhibit a long-term growth trend, with<br />
Western Europe and North America continuing to be the regions of greatest activity.<br />
In 2004 the world value of ocean surveying was €2 billion.The world market<br />
exhibits a long-term growth trend if analysed in US dollars, and stable if represented<br />
in euros, due to the decline in value of the dollar over time, in relation to the euro.<br />
Due to the impact of external factors, the commercial contracting industry has<br />
experienced major cycles. 1999 represented a cyclical low due to the impact of the<br />
1998 oil price fall, but in 2000 business rose strongly from the submarine cable sector<br />
which itself collapsed in 2001–2002.The submarine cable sector had attracted<br />
significant resources that were released into the wider market in 2001–2, depressing<br />
prices. Our five-year forecast shows hydrographic charting as the largest sector,<br />
followed by oil & gas and port & harbour survey.<br />
11.3 EUROPEAN MARKET<br />
Europe is a major player in this high tech sector (€538 million in 2004), which is<br />
dominated by the Netherlands.There is also emerging market potential associated<br />
with the commissioning of EEZ surveys.The UK forms the largest European market<br />
due to the combination of its oil & gas industry surveys and hydrographic activity.<br />
Norway is also significant due to its oil & gas activity. Activity in the other significant<br />
markets is mainly a function of hydrographic surveys. Ireland has good experience<br />
(having completed the world’s largest EEZ survey) but has no major player.<br />
Source: Douglas–Westwood<br />
Table 11.1: Ocean Survey – World <strong>Market</strong><br />
1999–03 2004 2005–09<br />
Africa 383 80 439<br />
Asia 1559 270 1363<br />
Australasia 313 59 285<br />
E Europe/FSU 2310 401 2044<br />
Latin America 664 118 617<br />
Middle East 152 35 160<br />
North America 3133 511 2507<br />
Western Europe 3201 538 2722<br />
TOTAL (€M) 11715 2013 10137<br />
Source: Douglas-Westwood<br />
Figure 11.2: Ocean Survey – Regional<br />
Segmentation 2005–2009<br />
46<br />
IHO Yearbook 2003<br />
Source: Douglas–Westwood
74 MARINE INDUSTRIES GLOBAL MARKET ANALYSIS<br />
Figure 11.3: Ocean Survey – European<br />
Segmentation<br />
Source: Douglas–Westwood<br />
Figure 11.4: Ocean Survey – Sectors<br />
11.4 BUSINESS SECTORS<br />
The largest activity is hydrographic survey, a ‘market’ we value at €1.4 billion.This is<br />
the process that is used to produce the navigational charts essential for safe transit of<br />
vessels. Surveys are usually commissioned by nations’ hydrographic offices, often using<br />
naval survey vessels plus, in some instances, civil contractors. In addition there is a<br />
major activity in support of defence requirements (such as the navigation of nuclear<br />
submarines) but this is excluded from this report.<br />
It is very difficult to determine the total world expenditure on hydrography as only<br />
16 of the IHO listed countries report their figures.The known expenditure of the 16<br />
countries totals €352 million for production of about one quarter of the world’s<br />
marine charts. Scaling up suggests a total annual spend of at least €1.4 billion.We say<br />
at least as much of the survey operation is, in many cases, carried out using naval<br />
vessels and personnel and in most instances these costs are probably not included in<br />
the figures.<br />
We estimate that the market for the sale of hydrographic charts exceeded €582<br />
million in 2003.<br />
Source: The World Ocean Survey Report,<br />
Douglas–Westwood<br />
Offshore oil & gas industry survey is valued at €302 million in 2004.The industry<br />
relies upon survey & positioning for exploration and facilities planning, construction<br />
and maintenance and this forms the largest commercial activity. Exploration surveys<br />
(excluded from this report) carried out by seismic survey vessels locate and map the<br />
reservoirs.This phase also includes exploration drilling using rigs that must be precisely<br />
positioned and orientated.The planning and installation of offshore production<br />
platforms and pipelines requires accurate survey techniques and precise positioning.<br />
For nearly two decades Western Europe was the world’s largest offshore oil & gas<br />
survey market and then during the 1990s the North Sea followed the US Gulf of<br />
Mexico into maturity and then into the beginnings of long-term decline.The Gulf of<br />
Mexico meanwhile received a new lease of life as deepwater fields were developed.<br />
Over the next five years we expect Africa to show greatest growth, and to a lesser<br />
extent Latin America, but North America (mainly the US Gulf of Mexico) will decline.<br />
Growth mainly relates to the field development activity.Although business in individual<br />
regions will change, the overall effect is one of a reasonably constant oil & gas industry<br />
world market as declines in mature regions are balanced by gains in others.
MARINE INDUSTRIES GLOBAL MARKET ANALYSIS<br />
75<br />
Ports & harbours – €233 million (2004). Most of the tonnage of international cargo<br />
is moved by sea and this involves the use of over 7,000 ports & harbours world-wide<br />
and over 2,000 of these can be regarded as significant ports – in other words, they<br />
carry out survey work. Major commercial ports do this using in-house hydrographers<br />
although there is a small amount of contracted commercial activity.<br />
Although there is a requirement to conduct the survey of ports and harbours on an<br />
ongoing basis, the amount of money available for this process is fundamentally a<br />
function of the number of ship movements through ports.The tonnage of goods<br />
moved by sea is a function of national GDP and the above table is based on our views<br />
of regional GDP growth over the period.The routine expenditure patterns are<br />
complicated by major port development but as these tend to stretch over several years<br />
the effect is ‘smoothed’ significantly.<br />
We expect a continuing growth in port & harbour survey expenditure, with the US<br />
being by far the largest region. Here the US Army Corps of Engineers is responsible<br />
for a considerable proportion of national expenditure.<br />
Submarine cables – €16 million 2004. Route survey is a critical part of the<br />
installation of submarine cables and is now even more so due to changes in fishing<br />
and shipping activities.This activity collapsed with the end of the ‘dotcom’ stock<br />
market boom and released additional capacity into the other S&P sectors.<br />
After a rapid climb to an annual peak of nearly €104 million in 2000, the installation,<br />
and correspondingly the survey of submarine cable routes, virtually ground to a halt<br />
in 2002.This had the spin-off effect of releasing survey capacity (and ROVs working<br />
on cable burial) into the major market sector, oil & gas, elongating a period of low<br />
prices caused by the earlier oil price fall. A further, but less publicised factor was the<br />
development of technology allowing more capacity on the fibre-optic cables. A very<br />
slow upturn in business is expected as the global economy recovers.<br />
Exclusive economic zones – €23 million 2004.The definition of exclusive<br />
economic zones (EEZ) outside the 200 nautical mile limit under the United Nations<br />
Convention on Law of the Sea (UNCLOS) requires the use of S&P to determine the<br />
location of the outer edge of the continental margin at a depth of 2,500m.<br />
A successful claim can give a nation rights over hundreds of thousands of kilometres<br />
of ‘seabed real estate’ and the associated oil, gas and mineral rights.
76 MARINE INDUSTRIES GLOBAL MARKET ANALYSIS<br />
The seven-year, €32 million survey of Ireland’s seabed formally commenced its<br />
fourth year of data acquisition in May 2003 and was the largest marine survey ever<br />
undertaken anywhere in the world. 47 The Celtic Explorer, the main survey vessel, was<br />
one of six ships and one aircraft employed in the survey and detailed studies of<br />
420,000 sq km of the seabed have been completed.The shallow-water Phase 2 is<br />
now underway.<br />
EEZ survey is a particularly difficult market to value. Considerable survey work is<br />
required by nations to prove-up the basis for their claims and this may be carried out<br />
by survey vessels operated by national hydrographic offices or navies, by research<br />
organisations, by commercial contractors or a combination of all three.Whatever<br />
resources are used these surveys, although few in number, are of significant scope<br />
and cost.<br />
A further complicating factor in market valuation is the seeming secrecy reported by<br />
some informed individuals. However, some costs (such as the major Irish survey<br />
discussed earlier) are in the public domain and from this and known tender<br />
opportunities a view of expenditure can be given. Overall, we expect a general rise in<br />
spend over the period.<br />
Offshore windfarms – €1.6 million (2004).The identification and assessment of<br />
locations suitable for offshore windfarms (and in the future wave and ocean current<br />
devices) involves the S&P industry in the mapping of the seabed environment.<br />
There are many other small activities.These include location and mapping of<br />
shipwrecks and downed aircraft, sea bed mining of minerals ranging from diamonds<br />
to sand & gravel, installation of electricity cables to offshore islands, etc. Due to their<br />
small size or intermittent nature we do not value such activities in this report.<br />
Although there has been strong development in the business of supplying<br />
electronic charts, there is little evidence to date of the commercial survey contractors<br />
becoming involved in a sector that offers significant business opportunities and<br />
diversification potential.<br />
11.5 TECHNOLOGICAL CHALLENGES<br />
Ocean survey is a technology business with large amounts of money invested is<br />
survey vessels’ data gathering and processing systems.<br />
47<br />
http://www.gsiseabed.ie/main.htm
MARINE INDUSTRIES GLOBAL MARKET ANALYSIS<br />
77<br />
Major advances of the past decade have included the almost universal use of<br />
multibeam sonars as the primary tool for data gathering, differential global positioning<br />
(DGPS) as the primary navigation tool and use of advanced sonar data processing.<br />
Ocean survey technology is probably more likely to move forward in a process of<br />
incremental developments rather than by major breakthroughs. Examples of the<br />
former include the commercial application of synthetic array sonar (itself an old<br />
concept increasingly enabled by the improvements in underwater positioning) and the<br />
application of increasing amounts of processing power.<br />
In our view, major potential lies in the application of autonomous underwater vehicles<br />
(AUVs) to ocean survey. Long a tool of academia, outstanding results have been<br />
obtained in deepwater commercial operations in the Gulf of Mexico, off West Africa<br />
and the North Sea. However, the major challenge and indeed opportunity lies in<br />
applying the technology to increase survey efficiency in lesser water depths and attack<br />
the commercial dominance of the survey vessel as the conventional survey platform.<br />
11.6 THE LONG-TERM – 2010 ONWARDS<br />
Ongoing survey of the sea and oceans is a fundamental need for the establishment<br />
of governance mechanisms, continuance of world trade and the extraction of<br />
ocean resources.<br />
Increased awareness of the importance of the oceans to the overall environment is<br />
likely to increase spending on ocean survey.<br />
Much of the work carried out by countries’ hydrographic offices for the production<br />
of navigational charts is based on data gathered by naval survey vessels, a practice<br />
which is difficult to economically justify in a situation where such services can be<br />
bought more cheaply from commercial contractors. However, we expect that the<br />
economic argument will increasingly prevail.<br />
The growth ambitions of the main commercial contractors together with the fall-out<br />
resulting from business cycles has meant that rationalisation and consolidation<br />
activities have been extensive in the S&P market with one truly global player<br />
emerging (Fugro, Netherlands) and two mid size ones (C&C, US and Gardline, UK)<br />
together with a number of small, mainly national players.
78 MARINE INDUSTRIES GLOBAL MARKET ANALYSIS<br />
We have long believed that for many commercial contractors ocean survey is a market<br />
that is too small to meet their shareholders’ growth objectives and companies are<br />
expanding their activities in to areas such as seismic survey.
MARINE INDUSTRIES GLOBAL MARKET ANALYSIS<br />
79<br />
12 Submarine Telecoms<br />
Definition – capital expenditure on the manufacture, supply and installation of submarine<br />
telephone cables.<br />
1999–03 2004 2005–09<br />
Irish <strong>Market</strong> €M – – –<br />
UK <strong>Market</strong> €M – – –<br />
Europe <strong>Market</strong> €M 3312 185 1915<br />
World <strong>Market</strong> €M 21,270 1,126 11,646<br />
12.1 INTRODUCTION<br />
Fibre-optic cables were introduced in 1988. In the next 9 years the investment in<br />
fibre-optic cables totalled $19.8bn.The rapid growth of the internet then caused<br />
traffic volumes to increase at 80–100% per annum. About 40,000 km of cable was<br />
installed in 1998 and over 190,000 km in 2001 at a cost of over €8 billion.<br />
Figure 12.1: Submarine Telecoms –<br />
World <strong>Market</strong><br />
Expected investment in the period 2001 to 2004 was $36 billion 48 and in 1999 a<br />
contract was signed for construction of 13 installation & maintenance ships for the<br />
proposed ‘Project Oxygen’.Then in 2001 “dotcom” technology stocks crashed,<br />
causing cable installations to virtually grind to a halt. Projects underway caused the<br />
bottom of the market not to occur until 2003.<br />
Considerable amounts of capacity had been brought into being to satisfy the boom;<br />
survey vessels, cable lay and burial vessels and the associated hardware such as ROVs<br />
and human resources.The collapse of the submarine cable market had major<br />
repercussions for these suppliers and caused hardware to be made available for work<br />
in the oil & gas sector, depressing day-rates.<br />
The situation was exacerbated by a massive increase in the capacity of individual<br />
cables.TAT11, laid in 1996, had a capacity of 1.6 Gbits/second.The 1999 trans-<br />
Atlantic cable, Gemini, had a capacity of 60 Gbit/s. Cables planned for 2001 were<br />
400 Gbits/s. 49<br />
12.2 WORLD MARKET<br />
In 2004 the submarine telecom industry was valued at €1 billion.The historic data<br />
we show is sourced from KMI. Our forward view is also based on our projection of<br />
their short-term global forecasts of total km to which we have applied a regional<br />
segmentation based on the location of past installations.This is, in practice, difficult to<br />
achieve with accuracy as the submarine industry segments its markets by oceans (e.g.<br />
Atlantic, Pacific, etc) rather than by regions and countries.We are not aware of<br />
significant Irish capital investment in this sector.<br />
Source: Douglas–Westwood<br />
Table 12.1: Submarine Telecoms –<br />
World <strong>Market</strong><br />
1999–03 2004 2005–09<br />
Africa 1539 100 1036<br />
Asia 8982 448 4628<br />
Australasia 998 50 514<br />
E Europe/FSU 171 10 108<br />
Latin America 2575 138 1427<br />
Middle East 721 40 409<br />
North America 2972 156 1608<br />
Western Europe 3312 185 1915<br />
TOTAL (€M) 21270 1126 11646<br />
Source: Douglas-Westwoo<br />
Figure 12.2: Submarine Telecoms – Regional<br />
Segmentation 2005–2009<br />
Following the dramatic collapse of capital expenditure in the sector from 2001–2003,<br />
we believe that growth is again likely. However, this will probably now be at a much<br />
more measured pace than in past years. Slow long-term growth is now forecast for<br />
submarine cable installations, to €3bn in 2009, representing average annual growth of<br />
21.8% from 2005.<br />
48<br />
KMI Corporation.<br />
49<br />
Foot, D. ‘Underwater’. Summer 1998, p121.<br />
Source: Douglas–Westwood
80 MARINE INDUSTRIES GLOBAL MARKET ANALYSIS<br />
12.3 EUROPEAN MARKET<br />
As a global business that views its markets by oceans, this sector is difficult to segment<br />
by country or region, but the European share in 2004 is valued at €185 million,<br />
constituting 16% of the world. Its historical activity was shaped by the global factors<br />
impacting on the industry, outlined in the Introduction above.
MARINE INDUSTRIES GLOBAL MARKET ANALYSIS<br />
81<br />
13 Fishing<br />
1999–03 2004 2005–09<br />
Irish <strong>Market</strong> €M 951 176 788<br />
UK <strong>Market</strong> €M 4,338 678 3,033<br />
Europe <strong>Market</strong> €M 32,313 4,758 21,280<br />
World <strong>Market</strong> €M 362,035 55,983 250,386<br />
Definition – the value of captured fish and shellfish as defined by the FAO.<br />
13.1 INTRODUCTION<br />
Fishing is an important industry that is seeing growing demand, but the world catch<br />
tonnage is falling as a result of serious resource problems and quota restrictions.There<br />
are some opportunities offered by new species, however, aquaculture which is<br />
subsidised in a number of countries provides serious price competition.The industry<br />
faces a future of continuing global decline worldwide until a point of sustainability<br />
can be reached.<br />
Figure 13.1: Fishing and Aquaculture Production<br />
Since 1996 capture fishing tonnage has been at best flat and has shown recent decline.<br />
The growing world demand for fish and other seafood is being met by aquaculture<br />
where tonnage growth over the period 1996 to 2002 averaged 7% and $ value<br />
averaged annual growth of 4%.<br />
Our five-year forecasts assume the value of the catch will stay constant from 2002<br />
prices onwards.This assumption has been made on the basis of increasing production<br />
of fish (including shellfish) from aquaculture, keeping prices steady.<br />
Source: FAO and Eurostat<br />
Within Europe and elsewhere initiatives have been introduced, such as the EU’s CFP<br />
(Common Fisheries Policy), with the aim of conserving remaining fish stocks.<br />
<strong>Global</strong>ly, the volume of captured fish has been decreasing slightly and this decrease<br />
may appear more pronounced if the speculation about China, over-reporting its<br />
production (by as much as 43%), are to be believed. 50 In addition, the depreciation of<br />
the US dollar against the Euro makes the decline more pronounced when values are<br />
viewed in euros rather than dollars.<br />
<strong>Marine</strong> fishing production can be viewed by tonnage and by value.The values are<br />
derived from tonnage data in the Eurostat online database and further broken down<br />
into molluscs & crustaceans (shellfish) and demersal & pelagic (finfish).The value of<br />
each of these subsets was estimated, by country, using the FAO ‘World Fishery<br />
Production: estimated value by group of species’ table, containing annual data from<br />
1999–2002.<br />
50<br />
Delgado, C et al, ,‘The future of fish, issues and trends to 2020’ FAO.
82 MARINE INDUSTRIES GLOBAL MARKET ANALYSIS<br />
Figure 13.2: Fishing – World <strong>Market</strong><br />
Source: FAO, Eurostat and Douglas–Westwood<br />
Table 13.1: Fishing – World <strong>Market</strong><br />
1999–03 2004 2005–09<br />
Africa 16401 2583 11550<br />
Asia 201183 31387 140377<br />
Australasia 6100 939 4198<br />
E Europe/FSU 14698 2091 9351<br />
Latin America 48698 7403 33108<br />
Middle East 3020 501 2242<br />
North America 39622 6323 28278<br />
Western Europe 32,313 4,758 21,280<br />
TOTAL (€M) 362,035 55,983 250,386<br />
Source: FAO, Eurostat and Douglas-Westwood<br />
Figure 13.3: Fishing – Regional Segmentation<br />
2005–2009<br />
13.2 WORLD MARKET<br />
The global fishing industry is in decline, while demand has grown dramatically. In the<br />
last 50 years fish consumption per person has doubled. Japan, the US and the EU are<br />
major seafood markets that depend on imports for approximately half of their<br />
consumption. 51 The value of Asian production was greater than any other region in<br />
2004, at over €31 billion. Latin America’s value was nearly a quarter of Asia’s, with<br />
North America not far behind.<br />
World fish consumption has been increasing since the 1960s, due to population<br />
increase and lifestyle factors, such as increased awareness of health benefits. Fishing<br />
technology has advanced over the years to increase catches. As a result of this overfishing<br />
(and pollution) the ocean population of edible fish has decreased by 90%<br />
during the last 50 years.The only way to bridge the gap between reduced capture<br />
fisheries output and increased world demand is through aquaculture.<br />
In 2004 world marine capture fisheries production was at €56 billion. Historically,<br />
production value was €67 billion in 1999, and is forecast to fall to €49 billion by<br />
2009.The world catch tonnage is falling as a result of serious resource problems and<br />
quota restrictions.There are some opportunities offered by new species. However, the<br />
industry faces a future of continuing global decline worldwide until a point of<br />
sustainability can be reached.This decline is forecast at a rate of 2.5% per year in<br />
Euros (0.99% in US Dollars), based on historic trends.<br />
13.3 EUROPEAN MARKET<br />
Europe’s fishing production amounted to 8% of world production in 2004<br />
(€4.7 billion).Within the EU, the UK, Spain, France and Denmark all have<br />
production valued at approximately €500 million each, although within the whole<br />
of Europe Norway is the clear leader, with an output three times the size at<br />
€1.49 billion in 2003.The expansion of the EU member states in 2003 has increased<br />
competition, but also increased the export market for Irish seafood.<br />
A very high percentage of Irish exports are to the EU, although they declined by<br />
10.2% from 2002 to 2003 (excluding fish landings at foreign ports – some of the Irish<br />
quota is landed in Norway where there are better prices and facilities for 24/7<br />
offloading). 52 Meanwhile the domestic market experienced growth. Outside the EU,<br />
a negative effect of the weak dollar has been felt, due to exports from the EU<br />
becoming more expensive for non-EU consumers.<br />
Source: FAO, Eurostat and Douglas–Westwood<br />
51<br />
FAO,‘Projection of World Fishery Production in 2010’.<br />
52<br />
‘BIM Annual Review’, p8, 2003.
MARINE INDUSTRIES GLOBAL MARKET ANALYSIS<br />
83<br />
13.4 CHALLENGES<br />
The fishing industry in Ireland is very fragmented with many small companies.These<br />
smaller companies are suffering with the increasing burden of legislation. In addition,<br />
cheap imports from the Far East into Europe have increased considerably and quotas<br />
are shrinking.<br />
Foreign supermarkets within Ireland such as Aldi and Lidl are able to undercut Irish<br />
suppliers of processed fish products by 20%. Ireland has the additional disadvantage<br />
of being a day further from markets than other parts of Europe.<br />
To secure regular export orders to international supermarkets, the Irish fisheries<br />
industry has to be able to supply the quantities on a regular basis, ideally with<br />
shipments six days per week, rather than the traditional one or two. International<br />
supermarket chains want to be provided with wide product lines that are QSP<br />
(Quality Seafood Product) labelled, such as salmon, smoked salmon and mussels.<br />
13.5 THE LONG-TERM – 2010 ONWARDS<br />
Future increases in demand for fish is expected to be met by aquaculture, which<br />
is growing rapidly.The contribution from capture fisheries will depend on how<br />
effectively countries and regions can manage their fish stocks to sustain, or<br />
optimistically to increase, fishable stocks.<br />
The International Food Policy <strong>Institute</strong> and the FAO are collaborating on IMPACT<br />
a global model of food supply and demand for 28 commodities. A paper based on<br />
results in 2002 offered the following projections for fisheries (including capture<br />
fishing and aquaculture): 53<br />
• Most growth will occur in developing countries which will account for 79% of<br />
production by 2020. China’s share of production will grow whilst Japan, USA, EU<br />
and FSU contract.<br />
• Fishmeal and oil prices will rise by 18% as these are increasingly concentrated<br />
into aquaculture.<br />
• The share of aquaculture will increase worldwide.<br />
53<br />
Delgado, C et al. Fish as Food, Projections to 2020.
84 MARINE INDUSTRIES GLOBAL MARKET ANALYSIS
MARINE INDUSTRIES GLOBAL MARKET ANALYSIS<br />
85<br />
14 <strong>Marine</strong> Aquaculture<br />
1999–03 2004 2005–09<br />
Irish <strong>Market</strong> €M 496 111 623<br />
UK <strong>Market</strong> €M 2,383 554 3,119<br />
Europe <strong>Market</strong> €M 16,359 3,483 19,621<br />
World <strong>Market</strong> €M 104,220 23,876 134,492<br />
Definition – value of marine ‘farmed’ fish and shellfish as defined by the FAO.<br />
14.1 INTRODUCTION<br />
Due to the decline in global capture fishing, increasing consumer demand and the<br />
low prices of its products, aquaculture is the fastest growing sector in the food<br />
industry. 54 Less than half of all aquaculture production comes from marine<br />
aquaculture; the rest comes from freshwater areas.<br />
SE Asia is a low cost producer and its exports have had particular impact in the US<br />
where, despite a growth in fish and seafood consumption harvest values for nearly<br />
every species have declined in 2001–2. (This also impacted on US capture fishing<br />
values which declined 4% in 2002.) Between 1996 and 2002 annual average tonnage<br />
growth was 9% and growth in US$ terms 4% (FISHSTAT). Continuing strong future<br />
growth in demand is forecast. On a global basis investment in aquaculture will be<br />
critical in growing world fish output.There are opportunities for new species<br />
development and research opportunities in a number of areas.<br />
Environmental issues and scares have at times depressed demand but this quickly<br />
recovered. Norway leads European production and benefits from a strong<br />
international brand.<br />
14.2 WORLD MARKET<br />
<strong>Marine</strong> aquaculture production was valued at €24bn in 2004.With 70% of the<br />
world’s production, Asia is the market leader. Asian production is valued at almost<br />
€17bn in 2004, much of which supplies their own domestic markets. Forecast data<br />
from 2003/4 onwards assumes a continuation of growth rate of marine aquaculture<br />
production value at 4% per year (based on historical dollar growth rate trends),<br />
reaching €29 billion by 2009.This trend is associated with aquaculture trying to fill<br />
the gap left by a decline in capture fishing and also due to the low price of its<br />
products (SE Asia is a low-cost high-volume producer). As with capture fishing, the<br />
Asian values must be treated with caution, due to the large Chinese content and the<br />
scepticism surrounding the high level of reported production (FAO).<br />
Figure 14.1: <strong>Marine</strong> Aquaculture –<br />
World <strong>Market</strong><br />
Source: Douglas–Westwood<br />
Table 14.1: <strong>Marine</strong> Aquaculture –<br />
World <strong>Market</strong><br />
1999–03 2004 2005–09<br />
Africa 235 51 288<br />
Asia 73,516 17,004 95,782<br />
Australasia 1,223 302 1,700<br />
E Europe/FSU 7 1 4<br />
Latin America 9,489 2,317 13,054<br />
Middle East 257 60 340<br />
North America 3,133 657 3,702<br />
Western Europe 16,359 3,483 19,621<br />
TOTAL (€M) 104,220 23,876 134,492<br />
Source: Douglas-Westwood<br />
Figure 14.2: <strong>Marine</strong> Aquaculture – Regional<br />
Segmentation 2005–2009<br />
In the case of the US, seafood imports (both capture and aquaculture) have grown<br />
dramatically over the past decade and now represent 78% of all US seafood<br />
consumption.The US now has a negative seafood trade balance of $8bn annually. 55<br />
54<br />
‘The State of World Fisheries and Aquaculture 2002’, SOFIA<br />
55<br />
‘Sea Technology’, January 2005, p50.<br />
Source: Douglas–Westwood
86 MARINE INDUSTRIES GLOBAL MARKET ANALYSIS<br />
14.3 EUROPEAN MARKET<br />
<strong>Marine</strong> aquaculture production in Western Europe (€3.5 billion in 2004) is ranked<br />
second to Asia in regional production value (€17 billion), but this only amounts to a<br />
fifth of Asia’s. According to available data, Eastern Europe’s production is very small<br />
compared to Western Europe. As within the capture fisheries, Norway is the European<br />
leader by far with its production equal to the combined production of the UK,<br />
France and Spain. European production values are forecast to increase, in-line with<br />
global estimates, at a rate of 4% per annum from 2005 to 2009.<br />
Total European (EU25) production grew by more than 40%, from 1 million tonnes in<br />
1993 to 1.4 million in 1999, and then declined very slightly. 56 France, Italy, Norway,<br />
Spain and the UK are the largest players. Norwegian production at 554,000 tonnes in<br />
2002 is nearly twice that of its nearest rival Spain. (By comparison, Japan produces<br />
about 1.3 million tonnes.)<br />
Within Ireland a number of factors led to a decrease in salmon production from<br />
21,423 tonnes in 2002 to 16,437 tonnes in 2003 (although trout farming was<br />
unaffected).This was due to company receiverships, market issues, disease and other<br />
unfavourable environmental factors. In addition, other countries are able to market<br />
the same products at reduced prices. Price battles among retailers are also contributing<br />
to the pressure to keep prices low – a situation that benefits consumers, whilst<br />
damaging suppliers.<br />
14.4 CHALLENGES<br />
The reputation of farmed fish suffered with the publishing of a report in ‘science’ in<br />
2004, on the levels of chemicals within the fish.The effect of the article highlights<br />
how vulnerable the industry is to negative press. (There has been good development<br />
of Irish mussels since the bio-toxin issue was resolved.) Aquaculturists’ freedom to<br />
improve fish is limited by the need to consider the effects of new or modified fish on<br />
the aquatic ecosystem and human health.The industry has to become more united<br />
and sophisticated in its approach to marketing and promoting the sustainability and<br />
health benefits of farmed seafood. 57<br />
It is thought that the US and Europe will continue to experience increased imports<br />
from Asia.The challenge for exporters is to ensure that they supply safe, properly<br />
labeled products.<br />
56<br />
‘Eurostat Yearbook’ 2004<br />
57<br />
‘Intrafish’, December 2004, p15
MARINE INDUSTRIES GLOBAL MARKET ANALYSIS<br />
87<br />
There is pressure on the location of marine aquaculture facilities as many suitable<br />
locations are also desirable for tourism, shipping and water sports.<br />
Fuel prices are also a concern within seafood companies with rising prices hitting<br />
freight costs. In a highly competitive environment it is difficult for the seafood<br />
industry to pass on these cost increases to their customers.<br />
14.5 THE LONG-TERM – 2010 ONWARDS<br />
The vast bulk of aquaculture production is made up of a small number of species and<br />
there is no apparent reason why other species from among the several thousand that<br />
are exploited by capture fisheries could not eventually be raised economically within<br />
marine aquaculture. Awareness of the requirements of the environment so as to secure<br />
a sustainable future must be at the fore of the considerations of the aquaculture<br />
industry, complementing the concerns of the consumer and society.<br />
A continuing consolidation of the seafood industry is expected. Fragmentation often<br />
means inefficiency. <strong>Global</strong> consolidation is necessary as otherwise the largest<br />
producers (Asia) who control the raw product will control the market, leaving Europe<br />
and America at its mercy.
88 MARINE INDUSTRIES GLOBAL MARKET ANALYSIS
MARINE INDUSTRIES GLOBAL MARKET ANALYSIS<br />
89<br />
15 Seaweed<br />
1999–03 2004 2005–09<br />
Irish <strong>Market</strong> €M 10 – –<br />
UK <strong>Market</strong> €M – – –<br />
Europe <strong>Market</strong> €M – – –<br />
World <strong>Market</strong> €M 28,490 5,988 32,746<br />
Definition – value of farmed and harvested seaweeds as defied by the FAO.<br />
15.1 INTRODUCTION<br />
Today seaweed is used as food, food supplements, fertilizers, cosmetics and for<br />
medicinal preparations.The three main groups of commercial seaweed are red, brown<br />
and green and production is harvested from wild and cultivated sources, with the<br />
latter constituting the majority of the production.<br />
Figure 15.1: Seaweed – World <strong>Market</strong><br />
15.2 WORLD MARKET<br />
The value of the world seaweed market was almost €6 billion in 2004, over 90% of<br />
which was cultivated, the rest wild. Asia is responsible for the vast majority of this<br />
production, of which China and Japan are the main contributors.There is very high<br />
market demand in Asia and China’s demand has outstripped the domestic supply, and<br />
has had to resort to importing from countries such as Korea.The farming of seaweed<br />
has expanded rapidly as demand has outstripped the supply available from natural<br />
resources. Commercial harvesting occurs in about 35 countries, spread between the<br />
Northern and Southern Hemispheres. 58 At the start of the reported period seaweed<br />
production was valued at €6.4 billion, then dipped in 2000, but the following years<br />
have all seen growth, with such value of production forecast to be reached again in<br />
2006. Forecast annual growth 2005–2009 is estimated at 3%.<br />
15.3 EUROPEAN MARKET<br />
In Europe, seaweed aquaculture has only developed to any commercial extent in<br />
France where wakame is being grown for food, although this does not appear in<br />
international data. It is likely that more extensive seaweed aquaculture will become<br />
more widespread in Europe over the next two to three decades.<br />
Ireland, with its extensive coastline, has a long history of seaweed use. Ireland’s<br />
Atlantic seaboard in particular, is ideal for the settlement of seaweeds. Seaweed is<br />
the basis for an industry providing valuable employment in coastal areas that are<br />
geographically remote. Only a dozen or so larger species have been put to any<br />
commercial use. 59 Whilst there are not many companies actively involved in seaweed<br />
or sea vegetable cultivation in Ireland at present, the industry employs several hundred<br />
people, both part-time and full-time gatherers, plus those involved in the processing<br />
side.The value of production of the seaweed industry in Ireland (€9 million) does<br />
not figure in the Eurostat or Fishstat data, perhaps due to the relatively small size of<br />
the industry.<br />
Source: Douglas–Westwood<br />
Table 15.1: Seaweed – World <strong>Market</strong><br />
1999–03 2004 2005–09<br />
Africa 42 11 61<br />
Asia 24,061 5,247 28,694<br />
Australasia 66 13 72<br />
E Europe/FSU 515 126 692<br />
Latin America 879 235 1,283<br />
Middle East 0 0 0<br />
North America 2,898 351 1,919<br />
Western Europe 31 4 24<br />
TOTAL (€M) 28,490 5,988 32,746<br />
Source: Historic Eurostat, forecast DWL<br />
Figure 15.1: Seaweed – Regional Segmentation<br />
2005–2009<br />
58<br />
FAO:‘A guide to the Seaweed Industry’ 2003.<br />
59<br />
Morrissey J., Kraan S. & Guiry M.D.,‘A Guide to Commercially Important Seaweeds on the Irish Coast’, 2001.<br />
Source: Douglas–Westwood
90 MARINE INDUSTRIES GLOBAL MARKET ANALYSIS<br />
15.4 CHALLENGES<br />
The cultivation of seaweeds in Asia is fairly low-technology. Attached plants are<br />
placed in the sea and there is a high labour content in the operation. Several attempts<br />
have been made in various western countries to introduce high technology to the<br />
cultivation of detached plants grown in tanks on land to reduce labour content but<br />
none of these has become commercially viable to date. 60<br />
In Asia low labour costs married to simple and intelligent maricultural techniques<br />
have proved very successful.The labour intensiveness of seaweed mariculture and the<br />
absence of a ready market have been the main reasons why it has not developed to<br />
any great extent in the west. Political instability in such Asian countries might be the<br />
only way Europe could export to Asia.The Asian market expects high standards and<br />
without experience in these markets it might be difficult to achieve penetration.<br />
15.5 THE LONG-TERM – 2010 ONWARDS<br />
There is likely to be a long-term growth in demand for seaweed and seaweed products.<br />
The ultimate development of seaweed cultivation is probably in the growth of<br />
genetically-improved strains with all environmental factors being controlled using<br />
biotechnological techniques.<br />
The production of low volume-high value species with potential in the cosmetics,<br />
biopharma and neutraceutical areas will provide increasing business opportunities to<br />
the sector in Ireland. Specific initiatives in R/D will however be required to optimize<br />
cultivation methodology, to evaluate and to screen for bioactive compounds in the<br />
biomedicine and biotechnology areas.<br />
60<br />
www.seaweed.ucg.ie
MARINE INDUSTRIES GLOBAL MARKET ANALYSIS<br />
91<br />
16 Seafood Processing<br />
1999–03 2004 2005–09<br />
Irish <strong>Market</strong> €M 1,447 287 1,411<br />
UK <strong>Market</strong> €M 6,721 1,232 6,152<br />
Europe <strong>Market</strong> €M 48,671 8,241 40,901<br />
World <strong>Market</strong> €M 466,254 79,859 384,878<br />
Definition – output value of processed seafood (fish and shellfish).<br />
16.1 INTRODUCTION<br />
Processing is a growing activity, fuelled by an increasing consumer appetite for ‘value<br />
added seafood’ and by changing lifestyles.To add value to seafood the process may be<br />
simply filleting or adding a sauce and creating a ready meal. As the world population<br />
has increased, so has the demand for seafood products, with a greater percentage of<br />
people worldwide consuming seafood today than 20 years ago. Further, consumers<br />
are increasingly demanding consistent quality and availability of seafood at a<br />
reasonable price.Worldwide seafood demand is projected to increase over 60% as<br />
projected world population grows from 5.3 billion to 8.5 billion by 2025. 61<br />
Worldwide demand for capture fisheries product is estimated at 110 million tonnes in<br />
2010. 62 Our forecast suggests that the capture fisheries sector would only be supplying<br />
74 million tonnes, although it is predicted that aquaculture production will increase<br />
during the forecast period.<br />
There is a generally a lack of information available on this subject, broken down in<br />
any useful format, for the purposes of this report. Seafood processing revenues have<br />
been estimated as being equivalent to the combined marine aquaculture and fishing<br />
product value for each country.This view is based on data from a number of<br />
countries including Canada, Ireland and the UK.<br />
Our methodology is based on the concept that processing can add up to 100% to the<br />
overall value of the raw product. In other words, the market value is the production<br />
value of marine aquaculture plus the production value of marine capture fishing.<br />
This combined value correlates well with limited data found on countries’ value of<br />
their processing industries.<br />
Therefore, the forecast is based on the trends already defined by the fishing and<br />
aquaculture sectors (ie the availability of the raw product). It could be argued that<br />
there is a move towards more processing, with more value being added to the same<br />
amount of raw product as consumer demand increases. For the purposes of the report<br />
we have maintained the trends estimated for fishing and aquaculture production.<br />
Figure 16.1: Seafood Processing – World <strong>Market</strong><br />
Source: Douglas–Westwood<br />
Table 16.1: Seafood Processing – World <strong>Market</strong><br />
1999–03 2004 2005–09<br />
Africa 16,636 2,634 11,839<br />
Asia 274,700 48,390 236,159<br />
Australasia 7,323 1,240 5,898<br />
E Europe/FSU 14,705 2,092 9,355<br />
Latin America 58,187 9,720 46,162<br />
Middle East 3,277 562 2,582<br />
North America 42,756 6,980 31,981<br />
Western Europe 48,671 8,241 40,901<br />
TOTAL (€M) 466,254 79,859 384,878<br />
Source: Douglas-Westwood<br />
Figure 16.2: Seafood Processing – Regional<br />
Segmentation 2005–2009<br />
16.2 WORLD MARKET<br />
In 2004 the seafood processing industry is estimated to be worth €80bn. Asia has the<br />
biggest proportion of activity, at over 60% of production, due in part to its large<br />
domestic seafood market. Historical and forecast values are based on the trends already<br />
defined by the fishing and aquaculture sectors (i.e. the availability of the raw product).<br />
As a result the industry is forecast to decline, from an historical peak, during the<br />
61<br />
‘Aquaculture Research & Development Strategic Plan’, United States Joint Subcommittee on Aquaculture.<br />
62<br />
Feidi, I.H, October 1999,‘International Seafood Production & Trade to 2010.Where Are We Headed’<br />
Source: Douglas–Westwood
92 MARINE INDUSTRIES GLOBAL MARKET ANALYSIS<br />
reported period, of over €100 billion in 2001 (due mostly to exchange rate<br />
fluctuations) but towards the end of the period the impact in the increase of<br />
aquaculture production leads to a slight upturn, but not to levels previously reached.<br />
Forecast average annual growth for 2005–2009 is therefore still negative, but<br />
marginally at –0.4%. If displayed in dollars, then the processing sector would show<br />
steady growth throughout the forecast period (see table 16.1).<br />
16.3 EUROPEAN MARKET<br />
The European market is valued at €8.2 billion in 2004.The value-added culture is<br />
not spreading in a consistent way across Europe. In most Mediterranean countries<br />
people still have the desire to have a whole fish on their plate and processing can cut<br />
the value. 63 However, generally, value-added products are year by year taking a greater<br />
share especially within the chilled fish sector. From the available information, we<br />
estimate that within the EU, the UK has the largest processing industry, followed by<br />
Spain. 64 A considerable export market exists for processed seafoods. Norway’s<br />
international sales have been greatly aided by the establishment and development of a<br />
premium brand. Obviously far more detailed analysis would have to be performed to<br />
ascertain individual countries’ processing output accurately. As a result some individual<br />
countries’ values may be inflated or deflated.<br />
Challenges for smaller producers such as Ireland include the need to develop and/or<br />
invest in automation and increase production to achieve both economy of scale,<br />
volumes and continuity of supply required by the major European supermarket<br />
chains.The processing industry is an important employer in coastal communities<br />
within Ireland. Our estimates for Irish activity seem to correspond fairly closely with<br />
the BIM data.The Irish processing activity was worth €287 million in 2004. 65<br />
Due to the major differences in labour costs, it is sometimes cheaper for European<br />
countries to export unprocessed products to the Far East and Eastern Europe for<br />
processing and re-import, rather than process at home.<br />
63<br />
Intrafish,‘Value Added Seafood Trends’, November 11 2004.<br />
64<br />
Eurostat<br />
65<br />
Based on DWL estimates.
MARINE INDUSTRIES GLOBAL MARKET ANALYSIS<br />
93<br />
16.4 2010 ONWARDS – THE LONG-TERM VIEW<br />
The combined factors of more women in full time employment, higher disposable<br />
incomes, sophistication of tastes and declining cooking skills mean value-added<br />
seafood sales have been increasing, creating more opportunities for the processing<br />
business. New species are also likely to be added to those used by processors.<br />
European processors will have to focus on the fresh/chilled market to remain<br />
profitable and compete with the frozen products from low cost countries further<br />
afield.This is good news for European processors, as chilled products are outselling<br />
frozen in some countries such as the UK.<br />
Increased processing efficiency is required, to both reduce labour contents and extract<br />
more meat per fish, therefore increasing productivity.
94 MARINE INDUSTRIES GLOBAL MARKET ANALYSIS
MARINE INDUSTRIES GLOBAL MARKET ANALYSIS<br />
95<br />
17 Offshore Oil & Gas<br />
Definition – total capital and operational expenditure. (Not the value of the offshore oil & gas<br />
production which is considerably greater.)<br />
1999–03 2004 2005–09<br />
Irish <strong>Market</strong> €M 478 114 483<br />
UK <strong>Market</strong> €M 54,699 7,927 30,751<br />
Europe <strong>Market</strong> €M 133,583 19,112 81,681<br />
World <strong>Market</strong> €M 504,110 91,146 475,748<br />
17.1 INTRODUCTION<br />
Some 35% of global oil production and 27% of gas production is from offshore.<br />
Expenditure is divided into two main areas, capital expenditure (Capex) –<br />
the investment in offshore field development and operational expenditure (Opex) –<br />
the cost of maintaining and operating the fields. Depletion of reserves in shallow<br />
waters (
96 MARINE INDUSTRIES GLOBAL MARKET ANALYSIS<br />
Figure 17.3: Offshore Oil & Gas –<br />
European Expenditure<br />
17.4 OFFSHORE EUROPE<br />
Two countries, Norway and the UK are forecast to account for 86% of European<br />
expenditure over the next five years, the remainder being mainly divided between<br />
Denmark, the Netherlands, Italy and Ireland.<br />
Although there could still be some significant discoveries, capital expenditure is<br />
already seeing decline, but operational expenditure will remain high for many years.<br />
With the oil majors exiting the North Sea for other regions, considerable<br />
opportunities remain for small oil companies and in this respect, the UK sector is seen<br />
as one of the world’s most attractive ‘plays’.<br />
There are many small undeveloped fields (up to 250 in the UK sector) and these offer<br />
opportunities for development by tie-backs of subsea wells to existing platforms and<br />
pipelines. In addition, there are many prospects for new companies to acquire existing<br />
‘brown fields’ from the existing oil majors<br />
Source: Douglas–Westwood and EnergyFiles<br />
17.5 IRELAND OFFSHORE<br />
Ireland borders a large area of the north Atlantic margin including the Rockall<br />
Trough and the Porcupine Basin, due west of the Celtic Sea. However, there has been<br />
limited success with the only commercial production being from gas fields.<br />
Three gas fields have been brought into production whilst one will begin producing<br />
in 2005. Marathon’s Kinsale Head field came onstream in 1978 in the Celtic Sea and<br />
met Ireland’s gas needs until 1996, when a pipeline was built to import gas from the<br />
UK. Kinsale Head and the nearby small Ballycotton field are in decline but this area<br />
has seen other small discoveries.<br />
Ramco brought the Seven Heads field onstream in December 2003 using a five well<br />
subsea system tied back to the Kinsale Head A platform, where the gas is processed<br />
and exported through the existing pipeline to the Inch Terminal near Cork.<br />
Production peaked at 2.1 million cubic metres per day and in late 2004 production<br />
was restricted to 0.7 million cu m/d as the data was assessed.<br />
The Corrib gas field was discovered in 1996 in 355m water depth in the Porcupine<br />
Basin some 80 km west of County Mayo.The field has eight planned subsea wells<br />
tied back to an offshore pipeline. Reserves are around 70% the volume of Kinsale. A<br />
processing terminal is planned in County Mayo.The field is expected to go into<br />
production in 2006–7.
MARINE INDUSTRIES GLOBAL MARKET ANALYSIS<br />
97<br />
The World Offshore Oil and Gas Forecast 66 suggests that it is fairly unlikely that further<br />
gas finds on a par with Kinsale Head and Corrib will be found and assumes that<br />
Ireland will reach peak gas output at around 2.8 Bcm per year (more than double<br />
2004 rates) in 2006 and then slowly decline as additional smaller finds in the Celtic<br />
Sea are brought onstream. It is forecast that 1.9 Bcm will be produced in 2015.<br />
Although some small oil discoveries have been made in the Celtic Sea no oil<br />
production has been achieved from Ireland and none is forecast in the period of<br />
this report except for negligible amounts of condensate.<br />
Figure 17.4: Subsea Field Development Costs<br />
17.6 OFFSHORE ACTIVITIES<br />
Initial exploration is mainly by the use of seismic surveys. Drilling is a major activity<br />
with about 1,000 exploration & appraisal wells drilled each year and more than 2,000<br />
development wells creating a total annual expenditure exceeding $37bn in 2004.<br />
Source: Douglas–Westwood<br />
Drilling and completing wells can form 50% of the costs of developing an offshore<br />
field.The other major items are fixed and floating platforms and pipelines.<br />
Fixed platforms are still the main development method with over 6,400 estimated<br />
to have been installed in the Gulf of Mexico to date (mainly very small ones).<br />
The North Sea has some 600, with a combined weight of 12 million tonnes.<br />
Where economics do not permit dedicated platforms, fields are often developed<br />
by wells completed on the seabed and ‘tied back’ (connected) to platforms.<br />
This is particularly the case for small fields and fields of all sizes in deepwater.<br />
In many instances, particularly in deepwater, subsea wells are tied back to floating<br />
production platforms.<br />
As a region matures Capex declines and Opex dominates – this is becoming the case<br />
with the North Sea.<br />
Eventually, fields reach the end of their productive life and are decommissioned.<br />
Over 100 small platforms per annum are removed from the Gulf of Mexico. Due to<br />
its larger structures decommissioning will eventually become a major activity in the<br />
North Sea.<br />
66<br />
Douglas-Westwood Limited, 2004.
98 MARINE INDUSTRIES GLOBAL MARKET ANALYSIS<br />
Figure 17.5: Deepwater Oil & Gas Production<br />
17.7 DEEPWATER<br />
The growth of deepwater activity (>500m) is one of the most significant trends of<br />
recent years with the most important areas being Angola, Brazil, Nigeria and the<br />
US Gulf of Mexico – where it now accounts for 60% of total production. In 2004<br />
deepwater oil production, about 2.6 million b/d, comprised 10% of global offshore<br />
production and deepwater gas production of around 7%.<br />
We expect deepwater production to grow from a present oil & gas equivalent of<br />
3.4 million b/d, to 8 million b/d by 2008 and continue its growth beyond 2012.<br />
17.8 FLOATING PRODUCTION<br />
The development of deepwater fields has resulted in a strong growth in the use<br />
of floating production systems.The most common form is the FPSO, (floating<br />
production, storage and offloading system).<br />
Source: The World Offshore Oil & Gas Report<br />
FPSOs are usually tanker conversions, with 137 deployed to end 2003. Other types<br />
include semi-submersibles (FPSS) and more custom structures such as spars and<br />
tension leg platforms (TLP).<br />
We forecast a continued growth in the use of all types of floating production.<br />
Although floaters are used in all water depths, most of this growth will be associated<br />
with deep waters.<br />
17.9 TECHNOLOGICAL CHALLENGES<br />
There are many technological challenges facing the offshore industry. In common<br />
with other sectors, a key theme is that of reducing costs. Particular targets are the<br />
main expenditure sectors of drilling, production facilities and pipelines.<br />
Deepwater operations – the record for deepwater production is currently some<br />
2,316m but exploration is happening in greater than 3,000m water depth. Such great<br />
depths represent major challenges. Operations in deep water considerably increases<br />
the time and therefore costs associated with drilling (a shallow water well can cost<br />
$5 million – a deepwater one 4 to 20 times this).<br />
Installing heavy seabed hardware therefore becomes a challenge as the weight of<br />
lowering cable rapidly exceeds the weight of the hardware multiplying the winch<br />
capacity required.
MARINE INDUSTRIES GLOBAL MARKET ANALYSIS<br />
99<br />
Flowlines to deliver production of product to surface facilities need to be heavily<br />
insulated and/or heated and dynamic risers from floating production form a<br />
particular challenge.<br />
Figure 17.6: Floating Production<br />
Expenditure Forecast<br />
Subsea processing – the output of an oil well is a mixture of oil, gas and water and<br />
the latter increases over time. A major need is to extend the flow distances of<br />
unprocessed oil & gas by separating the product (on the seabed rather than on<br />
production platforms). An alternative is to develop pumping technology able to<br />
handle this multiphase mixture. Significant progress is being made in both these areas.<br />
Floating production – a major new FPSO can cost in excess of €500 million and<br />
costs increase significantly in harsh environment areas (such as the Atlantic margins<br />
and off Northern Norway).<br />
Mature fields – a growing proportion of the world’s oil & gas, both onshore and<br />
offshore, is being produced from fields that are in decline.This proportion is currently<br />
nearing 50% and by 2012 could account for nearly 45,000 b/d. 67 Increasing<br />
production from mature fields represents a major business opportunity likely to attract<br />
considerable funding in future years.<br />
The Reservoir – the ability to image and understand the reservoir that contains the<br />
oil & gas is fundamental to the future success of the industry, both in terms of finding<br />
new reserves and managing the structure to achieve maximum economic recovery.<br />
Considerable progress has been made, but continuing investment is needed.<br />
Source: The World Floating Production Database<br />
17.10 THE LONG-TERM – 2010 ONWARDS<br />
As discussed earlier, we expect to see a continuing growth in world offshore oil and<br />
gas production beyond the time frame of this report. However, production will<br />
decline significantly in the mature (shallow-water) regions and be balanced by that<br />
from deep waters.<br />
It is forecast that after 2010 all offshore oil production growth will come from deep<br />
waters, compensating for declining output from shallow waters. From providing<br />
around 34% of total global oil production in 2004, offshore oil is forecast to be<br />
providing 39% by 2015. 68<br />
From providing around 28% of total global marketed natural gas production in 2004,<br />
offshore gas is forecast to be providing 34% by 2015. By this time around 12% of gas<br />
will be coming from deep waters compared to 7% in 2004.<br />
67<br />
‘Optimisation revitilises brownfields’ E&P, pp12–17 December 2004.<br />
68<br />
‘The World Offshore Oil & Gas Report’, Douglas-Westwood Limited.
100 MARINE INDUSTRIES GLOBAL MARKET ANALYSIS<br />
<strong>Global</strong> offshore Capex is forecast to grow from €49bn in 2004 to €52bn in 2006<br />
before slowly declining to €46bn by 2015, as opportunities slowly become exhausted.<br />
<strong>Global</strong> offshore Opex is forecast to continue increasing from €40bn in 2004 to<br />
€52bn in 2015 as total output grows, especially from more expensive deepwater<br />
environments.<br />
The above is based on present costs, however, over the longer term, after around 2010<br />
when a sustained increase in oil prices is likely as a global energy supply gap develops,<br />
it is very possible that real cost increases will materialise. Additional cost overheads<br />
within some parts of the offshore exploration and production industry could lead to<br />
expenditure growth, but without altering activity levels to a great extent.
MARINE INDUSTRIES GLOBAL MARKET ANALYSIS<br />
101<br />
18 <strong>Marine</strong> Renewable Energy<br />
1999–03 2004 2005–09<br />
Irish <strong>Market</strong> €M 46 – 255<br />
UK <strong>Market</strong> €M 108 109 3,356<br />
Europe <strong>Market</strong> €M 738 121 11103<br />
World <strong>Market</strong> €M 741 128 12,649<br />
Definition – total capital expenditure on wind, wave and tidal current installations.<br />
18.1 INTRODUCTION<br />
This sector is made up of expenditure on wind, wave and tidal installations.<br />
Currently a very small industry, the forecast for growth is huge.<br />
Figure 18.1: <strong>Marine</strong> Renewable Energy –<br />
World <strong>Market</strong><br />
18.2 WORLD MARKET<br />
Investment in offshore renewable energy is now growing strongly, but from a very<br />
small base. From €128 million capital investment in 2004, expenditure is expected to<br />
exceed €5.6 billion by 2009, plus operating expenditure. Some 85% of forecast<br />
expenditure in the period 2005 to 2009 is expected to be in Western Europe with<br />
North America forming the second largest segment at 12%.<br />
The main market driver is the political response to global warming.The UK, for<br />
example, wants to generate 10% of its electricity from renewables by 2010 and 20%<br />
by 2020.The most obvious solution is to increase the use of windpower. However,<br />
the best European onshore locations are becoming used up, there are considerable<br />
local objections to the visual impact of wind turbines and the best (windiest) sites<br />
often have no nearby access to the main transmission grid.<br />
The industry is therefore beginning to move offshore where turbines are out of<br />
sight and have a better wind environment.There have been relatively few installations<br />
to date but major growth is forecast.We are at the beginnings of an important<br />
new industry.<br />
The other developing technologies are wave and tidal current power.These are<br />
at a much earlier stage of commercial take-up and are forecast to form only 1% of<br />
the capital investment in offshore renewable energy by 2009. However, they have<br />
considerable long-term potential<br />
18.3 EUROPEAN MARKET<br />
Over the next five years, Douglas-Westwood forecast that Western Europe will<br />
account for 88% of global expenditure on marine renewable energy. Under present<br />
plans, Ireland would continue to be a very small producer with its share reducing due<br />
to strong growth in other countries’ activities. However, the country’s potential as a<br />
location for offshore renewable energy projects is considerable.<br />
Source: Douglas–Westwood<br />
Table 18.1: <strong>Marine</strong> Renewable Energy – Totals<br />
1999–03 2004 2005–09<br />
Africa 0 0 0<br />
Asia 1 0 20<br />
Australasia 0 0 6<br />
E Europe/FSU 0 0 50<br />
Latin America 0 0 0<br />
Middle East 0 0 0<br />
North America 2 7 1470<br />
Western Europe 738 121 11103<br />
TOTAL ($M) 741 128 12649<br />
Source: Douglas-Westwood<br />
Figure 18.2: <strong>Marine</strong> Renewable Energy –<br />
Regional Segmentation 2005–2009<br />
Source: Douglas–Westwood
102 MARINE INDUSTRIES GLOBAL MARKET ANALYSIS<br />
Figure 18.3: Offshore Windpower –<br />
European Capital Expenditure<br />
18.4 OFFSHORE WINDPOWER<br />
There are 17 operational offshore wind farms worldwide.The 324 installed turbines<br />
in these projects provide a total of 605 MW. A total of 2,258 turbines are forecast<br />
to be installed between 2005 and 2009, a total of 7,500 MW.<br />
The most recent project is the 60 MW Scroby Sands wind farm off the UK.<br />
The first offshore wind turbines were installed at Vindeby off the Danish island of<br />
Lolland in 1991, but significant activity did not begin until 2001. Once the associated<br />
industry was deemed established, the Danish government’s economic support for<br />
offshore windfarms was withdrawn and new installations virtually ceased.<br />
By 2008, it is likely that the UK will be the world’s largest purchaser of equipment<br />
and services, with Germany taking the lead in 2009.The US may also begin<br />
to develop into a significant market over the period.<br />
Source: Douglas–Westwood<br />
Figure 18.4: Offshore Wind Turbine Size<br />
The first ten years saw small projects being built in very shallow water, near shore<br />
locations.These wind farms, in most cases, used onshore turbine models with slight<br />
adaptations.These ‘demonstration’ projects have paved the way for the more recent<br />
projects that are much larger.<br />
Ireland has a relatively high number of project proposals. In the Alternative Energy<br />
Requirement competition AER VI round, two 25 MW projects (Kish and Bray<br />
Banks) were granted concessions. Both are under development by Saorgus Energy,<br />
and Hibernian Wind Power – owned by state company ESB. Scheduled start-up date<br />
is 2006.The 200 MW first phase of the 700 MW Codling Banks project, originally<br />
to begin construction by 2007, may be delayed to the end of the decade.<br />
The 520 MW Clogher Head offshore wind farm off County Louth is under<br />
development by Airtricty. It is in two sections, one of which borders Northern Irish<br />
waters.The wind farm will generate electricity to both Ireland and Northern Ireland<br />
when it is commissioned, potentially by 2010.<br />
18.5 TECHNOLOGICAL CHALLENGES<br />
Increasing offshore wind turbine size is a key issue – fewer turbines mean lower costs.<br />
Source: Douglas–Westwood<br />
The Arklow Banks wind farm off Ireland has seven 3.6 MW turbines operating,<br />
presently the largest in the world. Prototype 4 MW turbines are expected in 2005/6,<br />
5 MW from 2007 and by 2009 these will be the norm. Above this size the
MARINE INDUSTRIES GLOBAL MARKET ANALYSIS<br />
103<br />
technology becomes significantly more costly and difficult to implement (The blades<br />
on a 5 MW turbine span over 120 metres.)<br />
At the same time distances from the shore and water depth are increasing.The<br />
deepest installation to date is Samsø off Denmark, with ten 2.3 MW turbines in an<br />
average of 19m water depth.<br />
The largest project currently operational is the 165 MW Nysted wind farm off<br />
Denmark. In ten years time, 1 GW will be a standard size.The largest project to be<br />
announced is some 75 km offshore Germany in 40m of water, with a target capacity<br />
of 17,500 MW.<br />
At these locations installation work becomes significantly more difficult. Standard<br />
monopile foundations are not ideally suited to large turbines in deeper waters and<br />
tripods or jackets are proposed. Specialised vessels with ‘legs’ that lower to the seabed<br />
to give stability are used for installation.<br />
18.6 WAVE & TIDAL POWER<br />
In comparison to the more established offshore wind sector, both wave and tidal<br />
energies are embryonic sectors and barely register economically because of the low<br />
level of activity.The small number of announced projects limits the short term<br />
outlook for these industries.<br />
To give an example, in 2009, we expect over 30,000 MW of offshore windpower<br />
installations worldwide and only 15 MW of wave and tidal installations.<br />
Nevertheless, despite being overshadowed by the offshore wind sector, wave and tidal<br />
energy offer much long-term potential and the next five years will see a number of<br />
technologies reach commercial application and be installed in multiple-unit<br />
configurations. In this respect these developing industries can be seen as being at a<br />
similar stage to offshore wind a little over a decade ago.With sufficient<br />
encouragement, sizeable wave and tidal farms will be in place by the next decade.<br />
‘Wave power’ is defined as electricity produced by devices utilising the direct and<br />
indirect action and movement of waves in the horizontal and/or vertical planes.This<br />
includes devices located offshore, nearshore and on the shoreline. Operating examples<br />
include the Limpet shoreline device installed in 2000 on the island of Islay off<br />
Scotland’s west coast and the Wave Dragon off Denmark which was the first offshore<br />
grid-connected wave energy device when it was commissioned early in 2003.
104 MARINE INDUSTRIES GLOBAL MARKET ANALYSIS<br />
‘Tidal’ is electricity produced as a direct consequence of the large-scale movement of<br />
bodies of water due to the ebb and flow of the tides.<br />
‘Tidal Current Stream’ is electricity produced through the regular flow of currents.<br />
Whilst tidal action may affect the direction and intensity of a current stream its<br />
motion is not directly dependent upon it. Operating examples include <strong>Marine</strong><br />
Current Turbine’s ‘seaflow’ project off the UK, which was the first tidal current stream<br />
turbine to come online.<br />
Table 18.2: Electricity Generation Costs<br />
Energy Type<br />
€Cents/kWh<br />
Onshore Wind 5.3<br />
Offshore Wind 7.9<br />
Wave/Tidal 9.5<br />
Nuclear Fission 3.3<br />
Coal 3.6 – 4.6<br />
Gas 3.2 – 4.5<br />
Source: The Royal Academy of Engineers<br />
March 2004<br />
18.7 THE LONG-TERM – 2010 ONWARDS<br />
The major challenge faced by offshore renewable energy is in reducing its costs to be<br />
comparable with ‘conventional’ power generation from gas and coal.<br />
The costs in table 18.2 include:<br />
• Capital cost, fuel and operational cost<br />
• Transmission and storage of gas.<br />
Standby generation is also needed for onshore/offshore wind for periods of low wind<br />
and if included this would add approx 1.7 cents/kWh.<br />
Other studies by OXERA, for the UK government’s Renewables Innovation Review,<br />
show that prices for onshore wind could drop to 3.9 cents/kWh by 2010.<br />
Most of the new power generation capacity installed in Western Europe and many<br />
other countries in the past 20 years is fuelled by gas. However, the UK (and the US)<br />
are now facing gas supply shortages and although new foreign supplies can be sourced<br />
these will be at a higher cost.<br />
In addition, by the middle of the next decade it is likely that shortages of oil, leading<br />
to real price increases, will boost demand for gas and result in further gas price<br />
increases.We believe that the overall result of this will be to improve the competitive<br />
position of renewable energy.<br />
There is also potential for the drive for development of renewable energy resources to<br />
change progressively from green politics to security of supply.
MARINE INDUSTRIES GLOBAL MARKET ANALYSIS<br />
105<br />
19 Minerals & Aggregates<br />
1999–03 2004 2005–09<br />
Irish <strong>Market</strong> €M – – –<br />
UK <strong>Market</strong> €M 3,008 672 3,648<br />
Europe <strong>Market</strong> €M 5,761 1,344 6,938<br />
World <strong>Market</strong> €M 11,746 2,741 14,149<br />
Definition – value of aggregates and other minerals recovered from the seas.<br />
19.1 INTRODUCTION<br />
<strong>Marine</strong> production of minerals and aggregates has to date mainly been focused on the<br />
extraction of sand and gravel.<br />
Figure 19.1: Minerals & Aggregates –<br />
World <strong>Market</strong><br />
<strong>Marine</strong> aggregates are an important mineral source for industrial use and coastal<br />
restoration projects. Extraction activity is ongoing from several continental shelves<br />
including Japan (the largest producer), the UK (the second largest producer), the US,<br />
France, Denmark and the Netherlands. Reconnaissance of reserves has been carried<br />
out in Brazilian waters.<br />
‘Minerals & Aggregates’ is dominated by the production of aggregates which are<br />
supplied to local markets in metropolitan areas together with supply to beach<br />
replenishment projects.<br />
Offshore dredging reduces the need for onshore sand and gravel pits so bringing<br />
certain environmental benefits. However, concerns have been raised about the impact<br />
on the local marine environment with the result that the process tends to be confined<br />
to restricted areas.<br />
Other Minerals:The recent increases in demand for minerals and associated price<br />
increases have re-kindled interest in seabed ‘mining’.<br />
The much discussed development of exotic deepwater minerals such as manganese<br />
nodules and hydrothermal sulphides is prohibited by very high recovery costs.<br />
Methane hydrates, although strictly not a mineral, are receiving a high level of<br />
research interest worldwide.<br />
The United Nations International Seabed Authority is continuing its work in<br />
attempting to regulate exploration for seabed minerals but has not yet presented a<br />
text for adoption.<br />
Technology: Seabed ‘mining’ of exotic minerals both in deep and shallow waters<br />
offers future markets for subsea technology.The $30 million vessel MV Kovambo<br />
used off Namibia for subsea diamond dredging has a 160 tonne integrated seabed<br />
crawler, a new application of underwater vehicles.The UK-built crawler is the largest<br />
remotely controlled underwater vehicle (ROV) in the world.The mining company<br />
has also deployed a Danish autonomous underwater vehicle (AUV) to carry out<br />
seabed survey from the Kovambo.<br />
Source: Douglas–Westwood<br />
Table 19.1: Minerals & Aggregates –<br />
World <strong>Market</strong><br />
1999–03 2004 2005–09<br />
Africa 225 53 273<br />
Asia 3840 896 4626<br />
Australasia 0 0 0<br />
E Europe/FSU 0 0 0<br />
Latin America 0 0 0<br />
Middle East 0 0 0<br />
North America 1920 448 2313<br />
Western Europe 5761 1344 6938<br />
TOTAL (€M) 11746 2741 14149<br />
Source: Douglas-Westwood<br />
Figure 19.2: Minerals & Aggregates – Regional<br />
Segmentation 2005–2009<br />
Source: Douglas–Westwood
106 MARINE INDUSTRIES GLOBAL MARKET ANALYSIS<br />
19.2 WORLD MARKET<br />
The world value of the industry is estimated at €2.7 billion in 2004, with Japan being<br />
the largest producer.The sector is dominated by the production of aggregates which<br />
are supplied to local markets, with offshore dredging reducing the need for onshore<br />
pits so bringing environmental benefits.<br />
Historically the sector has displayed steady growth through to 2004, from €2.3 billion<br />
in 1999.The forecast is for growth, with average annual growth of 2.7% leading to a<br />
value of €3.1 billion in 2009.<br />
19.3 EUROPEAN MARKET<br />
Within Europe, with the industry valued at €1.3 billion in 2004, the UK dominates,<br />
with the industry employing 2,500 people and extracted 22 million tonnes in 2003.<br />
Period growth is forecast from total value 1999–2003 of almost €6 billion to almost<br />
€7 billion during 2005–2009.
MARINE INDUSTRIES GLOBAL MARKET ANALYSIS<br />
107<br />
20 Shipbuilding<br />
1999–03 2004 2005–09<br />
Irish <strong>Market</strong> €M 2 0 2<br />
UK <strong>Market</strong> €M 1,001 234 928<br />
Europe <strong>Market</strong> €M 63,913 13,143 52,076<br />
World <strong>Market</strong> €M 183,440 37,746 155,017<br />
Definition – total capital value of ships =>100GRT. Excludes naval vessels.<br />
20.1 INTRODUCTION<br />
The world shipbuilding industry is currently enjoying a strong upturn due to the<br />
major growth in demand for shipping discussed earlier.World economic growth is<br />
buoyant and it is expected to remain so in the medium term boosted by the very<br />
strong growth of the Chinese economy and, to a lesser extent, that of other<br />
developing economies.World seaborne trade has increased with exports of<br />
containerised goods and imports of commodities such as oil & steel.The commercial<br />
shipping industry has become more profitable than at any time during the previous<br />
decade and ship-owner confidence has grown.The overall result has been a surge of<br />
orders for vessels and yards currently have full order books, newbuild tanker prices are<br />
up by 40% and average delivery time extended from two to three years. 69<br />
It is unlikely that such high economic growth rates can be sustained and in 2007–8<br />
we expect a return to more normal activity levels as the new tonnage is absorbed by<br />
the market. As a result, many shipyards are not adding further capacity. Shipbuilders’<br />
profits have been hit by a combination of a large rise in steel prices and a fall in the<br />
US$. A result is that South Korean yards are reported to be targeting fewer orders in<br />
2005. 70 For over a decade the prices of newbuilds has been on a downward trend.The<br />
1990-based US$ index had fallen by 50%, mainly due to chronic overcapacity<br />
resulting from government subsidies, often attacked by the EU to little effect. 71<br />
A resumption of the lower long-term growth trend is, however, likely in the<br />
foreseeable future. From some $35 billion in 2000, we expect the total value of<br />
shipbuilding output to peak at around $45 billion in 2004–2006, and then fall to<br />
$39bn in 2008 before returning to its underlying long-term growth trend. However,<br />
as shown in an earlier chart, the recent major variations in the euro/dollar exchange<br />
masks this dollar market rise.<br />
The industry has, over the longer term, produced an average of some 1,800 vessels<br />
per annum. Notable changes in the market have included a trend towards larger<br />
vessels, especially container vessels and tankers.We believe that this will continue but<br />
will not appreciably affect the average size of new vessels constructed during our<br />
forecast period.<br />
There has been a growth in average vessel size and we may well see 10,000+ TEU<br />
container vessels before 2008 but their numbers will be small.<br />
69<br />
‘Lloyd’s List’ Annual Review 30 December 04.<br />
70<br />
‘Lloyd’s List’ 5 January 2005, p1.<br />
71<br />
‘Report from the Commission to the Council on the Situation in World Shipbuilding’, Commission of the European<br />
Communities, 2003.http://europa.eu.int/comm/enterprise/maritime/
108 MARINE INDUSTRIES GLOBAL MARKET ANALYSIS<br />
Figure 20.1: Shipbuilding – World <strong>Market</strong><br />
20.2 THE WORLD MARKET<br />
The world shipbuilding sector is valued at almost €38 billion in 2004.The European<br />
Commission notes that:“Historically, the industry has suffered from the absence of<br />
global rules and a tendency of (state-supported) over-investment due to the fact that<br />
shipyards purchase a wide range of technologies, employ a significant number of<br />
workers and generate foreign currency income”. 72<br />
The major development in global shipbuilding since the second world war has been<br />
the growth of SE Asia as the main shipbuilding region and the decline of Europe.<br />
This originally began with the post-war rise of Japan and then South Korea. (In 2002<br />
the European Commission reported its efforts to stem the effects of “certain business<br />
practices by Korean yards” concluding that their “prices do not cover the full costs<br />
of production”. 73 )<br />
Source: Douglas–Westwood<br />
Table 20.1: Shipbuilding – World <strong>Market</strong><br />
1999–03 2004 2005–09<br />
Africa 71 11 49<br />
Asia 109,058 22,604 94,402<br />
Australasia 985 174 804<br />
E Europe/FSU 3,498 650 2,995<br />
Latin America 493 97 446<br />
Middle East 83 15 71<br />
North America 5,339 1,052 4,174<br />
Western Europe 63,913 13,143 52,076<br />
TOTAL (€M) 183,440 37,746 155,017<br />
Source: Douglas-Westwood<br />
Figure 20.1: Shipbuilding – Main Regional<br />
Segmentation 2005–2009<br />
During this period, Korea entered new market segments and boosted demand in<br />
existing ones by aggressively cutting prices despite its increasing costs.<br />
Japan undertook massive restructuring by bringing together yards into umbrella<br />
groups and by retaining the major share of its large home market – Japanese owners<br />
are noted for being very reluctant to place orders with foreign yards.<br />
The other and more recent change is the development of China into a major<br />
shipbuilding nation, facilitated by its low labour costs and state investment. Past<br />
organisational problems and difficulties of access to technology have rapidly been<br />
overcome.The EU’s annual report on shipbuilding notes the growth in China’s share<br />
of the world market growing from 7% in 2000 to 13% in 2002.Today the SE Asian<br />
region dominates the delivery of tankers, bulk carriers and other large vessels that can<br />
be efficiently produced by ‘industrial’ shipbuilding techniques.<br />
The present up-cycle was triggered by the growth of the Chinese economy. Overall<br />
world economic activity has also grown, the cruise industry has recovered and<br />
shipowners’ profits have been high generating cash for re-investment in new tonnage<br />
producing a surge in ship orders in 2003 and 2004.<br />
The peak is now in sight and we expect the Chinese economy to cool somewhat and<br />
new orders to decline in 2005 and 2006 before a return to the underlying lowergrowth,<br />
long-term trend. A major uncertainty in the period ahead is the reaction of<br />
the SE Asian yards to a return to lower order levels. However, a further situation that<br />
could impact on demand for shipbuilding is that 1,119 single hull tankers are, in<br />
Source: Douglas–Westwood<br />
72<br />
http://europa.eu.int/comm/enterprise/maritime/<br />
73<br />
‘Sixth Report from the Commission to the Council on the Situation in World Shipbuilding’ Commission of the European<br />
Communities, 13 November 2002.
MARINE INDUSTRIES GLOBAL MARKET ANALYSIS<br />
109<br />
theory, due to be phased out by the end of 2005. 74 The market shows future decline<br />
in euros (-4% annually 2005–2009) although this is not so significant in US dollars –<br />
the currency of the market.<br />
20.3 EUROPEAN MARKET<br />
Shipbuilding is an important and strategic industry in a number of EU Member<br />
States, with Europe’s industry valued at €13 billion in 2004. Shipyards often play<br />
a significant role in regional industrial infrastructure and, with regard to military<br />
shipbuilding, involve national security interests.<br />
The European shipbuilding industry is the global leader in the construction of<br />
complex vessels such as cruise ships, ferries, mega-yachts and dredgers. It also has<br />
a strong position in the building of submarines and other naval vessels. Equally, the<br />
European marine equipment industry is a world leader for a wide range of products,<br />
from large diesel engines to marine electronics.<br />
According to the Association of Western European Shipbuilders and Shiprepairers<br />
(AWES), in 2003:<br />
• The European industry provided 20% of the world shipbuilding capacity.<br />
• Direct employment totals more than 129,000 jobs and the supply chain an<br />
additional 500,000.<br />
• Average turnover of the shipbuilding is €14.4bn.<br />
• Europe has a strong global position in complex vessels (64%) and ship repair (42%).<br />
• The industry has a network of 9,000 sub-suppliers across Europe, mostly SMEs.<br />
• 10% of turnover is spent on research, development and innovation through a high<br />
level of prototyping and the predominance of one-of-a-kind products.<br />
In addition to shipbuilding, European ship repair and conversion was a business<br />
valued by the AWES at €2.2 billion in 2003. Germany is the largest player with<br />
a share of €553 million followed by the UK with €420 million.<br />
Europe has lost market share in terms of total tonnage due to the decline in orders<br />
for ‘standard’ ships which can be produced more cheaply in SE Asia. However, it has<br />
retained the higher value-added, lower-volume parts of the market for more<br />
specialised vessels such as cruise ships, smaller tankers and ships used by the offshore<br />
oil & gas industry.<br />
74<br />
‘Destination Unknown’, European single hull tankers report. Greenpeace 2003.
110 MARINE INDUSTRIES GLOBAL MARKET ANALYSIS<br />
Shipbuilding, like shipping, is a highly cyclical industry. At the time of its sixth report<br />
on the situation in world shipbuilding in late 2002, the European Commission had<br />
noted the impact of past over-ordering following a period of almost continuous<br />
growth from 1995 to 2000.The uncertainties in the world economy following the<br />
events of 11 September 2001 resulted in a fall in confidence and a major reduction in<br />
orders – 60% down in mid 2002 at 3 million CGT, compared with a quarterly peak<br />
of the 7.5 million CGT in mid 2000.<br />
In the EU the situation was even worse with a decline of 80% in new orders. 9/11<br />
also resulted in a major fall in orders for cruise ships, a European specialist sector.<br />
Between 2000 and 2002 the EU share of the world shipbuilding market fell from<br />
19% to 7% and the Chinese share grew from 7% to 13%.<br />
In 2002 the EU authorised direct aid of 6% to shipyards as a Temporary<br />
Defensive Mechanism.<br />
Although Ireland does not have a significant shipbuilding capability, it is necessary<br />
to understand the shipbuilding sector as it is a driver for others such as marine<br />
equipment, education & training, R&D, etc.<br />
20.4 TECHNOLOGICAL CHALLENGES<br />
Fuel price increases have resulted in growing pressures to reduce vessel operating costs<br />
and the major challenge is to radically improve propulsion efficiency. Engine emission<br />
reduction is also a significant challenge.<br />
20.5 THE LONG-TERM – 2010 ONWARDS<br />
The long-term is fundamentally a function of the growth in world seaborne trade,<br />
the underlying driver of shipping demand, which fuels owner confidence and results<br />
in more shipping orders.<br />
In recent years there has been an increase in the size of vessels but this may reach<br />
its practical limit as a function of ports’ capacity.<br />
Of increasing significance could be the growing desire in Europe, and to a lesser<br />
extent the US, to transfer road freight to short-sea shipping and this could result in<br />
an increase in orders for smaller vessels.
MARINE INDUSTRIES GLOBAL MARKET ANALYSIS<br />
111<br />
21 <strong>Marine</strong> Equipment<br />
Definition – value of equipment and materials purchased for commercial shipbuilding<br />
and oil & gas installations.<br />
1999–03 2004 2005–09<br />
Irish <strong>Market</strong> €M 1 0 1<br />
UK <strong>Market</strong> €M 571 133 529<br />
Europe <strong>Market</strong> €M 94,741 16,675 73,263<br />
World <strong>Market</strong> €M 355,826 72,871 358,315<br />
21.1 INTRODUCTION<br />
<strong>Marine</strong> Equipment is a very large market and in this report we define it as being<br />
comprised of two main customer groups:<br />
Figure 21.1: <strong>Marine</strong> Equipment – World <strong>Market</strong><br />
• Shipbuilding sector capital items (e.g. propulsion systems & machinery) total €21bn<br />
with over 5,000 suppliers listed worldwide.<br />
• Oil & gas sector (e.g. production of platforms, pipelines, subsea equipment, etc)<br />
total €49bn and over 6,000 suppliers are listed worldwide.<br />
One of the problems in valuing this sector is definitions. Many other smaller sectors<br />
such as offshore renewable energy could also be included; however, these are much<br />
smaller than oil & shipbuilding and would not make a significant difference to the<br />
totals.We specifically exclude military equipment.<br />
There is growing technology content in all sectors, with hundreds of high-tech subsectors<br />
ranging from software to underwater connectors to control systems and it is<br />
within these that the main opportunities for SMEs exist.<br />
21.2 WORLD MARKET<br />
As mentioned above, there is no clear definition of what constitutes marine<br />
equipment. Often it is regarded as bought-in items of the shipbuilding process such<br />
as propulsion systems and other machinery, the bridge systems, control and<br />
automation, but also extends to scuttles, washroom and galley equipment, etc. In our<br />
analysis we include all bought-in items.The world market for marine equipment in<br />
2004 was €73 billion, marine equipment in the shipbuilding sector accounted for<br />
€21.3 billion of this.<br />
Many definitions of ‘marine equipment’ only recognise the shipbuilding sector and<br />
exclude all others.The definition we use includes the capital expenditure item of<br />
the offshore oil & gas sector. In the oil & gas sector we use the capital expenditure<br />
component which we value at €49.7 billion in 2004.The segmentation of this<br />
expenditure by type of technology varies from region to region and also by water<br />
depth. Historically, the market was worth €64 billion in 1999. Since then, the sector<br />
has displayed slight fluctuations, but a general trend of growth, with forecast value<br />
of €70 billion for 2009, representing a slight decline of 0.6% annually from 2005<br />
following a peak of €74 billion in 2006.<br />
Source: Douglas–Westwood<br />
Table 21.1: <strong>Marine</strong> Equipment – World <strong>Market</strong><br />
1999–03 2004 2005–09<br />
Africa 29,465 8,341 46,050<br />
Asia 102,144 21,756 101,385<br />
Australasia 9,989 2,124 11,557<br />
E Europe/FSU 6,047 3,739 27,278<br />
Latin America 37,857 6,147 32,588<br />
Middle East 18,542 4,255 20,238<br />
North America 57,061 9,834 45,956<br />
Western Europe 94,721 16,675 73,263<br />
TOTAL (€M) 355,826 72,871 358,315<br />
Source: Douglas-Westwood<br />
Figure 21.2: <strong>Marine</strong> Equipment – Regional<br />
Segmentation 2005–2009<br />
Source: Douglas–Westwood
112 MARINE INDUSTRIES GLOBAL MARKET ANALYSIS<br />
Figure 21.3: Typical Ship Cost Segmentation<br />
21.3 EUROPEAN MARKET<br />
Europe is a major provider of marine equipment, particularly high technology and<br />
was valued at €17 billion in 2004. In shipbuilding this ranges from electronic charting<br />
and integrated bridge systems to advanced marine engines.<br />
In 2000, Europe was estimated to satisfy 37% of the world demand for shipbuilding<br />
sector marine equipment (whilst having only a 16% of the world shipbuilding<br />
market). 75 In 1997 the leading European suppliers of marine equipment were<br />
Germany 22%, UK 19% and Norway 15%.<br />
Source: Douglas–Westwood<br />
In offshore oil & gas, Europe is again associated with high technology.<br />
21.4 THE LONG-TERM – 2010 ONWARDS<br />
The market was worth €64 billion in 1999. Since then the sector has displayed slight<br />
fluctuations, but a general rend of growth, with forecast value of €70 billion for 2009,<br />
representing a slight decline of 0.6% annually from 2005 following a peak of<br />
€74 billion in 2006.This is due to a forecast slight decline in shipbuilding.There is a<br />
growing technology content and hundreds of high-tech sub-sectors, many of which<br />
offer opportunities.<br />
75<br />
‘3rd report from the European Commission to the Council on the situation in world shipbuilding 2000’.<br />
(We assume this refers to ships equipment only.)
MARINE INDUSTRIES GLOBAL MARKET ANALYSIS<br />
113<br />
22 <strong>Marine</strong> IT<br />
Definition – IT hardware and software in all aspects of marine activities. (Excludes systems not<br />
designed for specialised marine applications – e.g. typical office software.)<br />
1999–03 2004 2005–09<br />
Irish <strong>Market</strong> €M 43 18 78<br />
UK <strong>Market</strong> €M 648 217 917<br />
Europe <strong>Market</strong> €M 3,794 1,382 5,872<br />
World <strong>Market</strong> €M 9,780 3,570 16,012<br />
22.1 INTRODUCTION<br />
There are more than 500 suppliers of ‘marine computing’ worldwide (these are<br />
mainly SMEs, also there are many marine leisure sector players).<br />
<strong>Marine</strong> IT is a subject that is difficult to assign precise boundaries to. IT hardware &<br />
software applies to, and is embedded in, all aspects of marine activity so is difficult to<br />
value.The major sectors are those associated with critical ship operations (e.g.<br />
integrated bridge), equipment support (e.g. engine management) and marine<br />
operations (e.g. cargo handling).<br />
In addition there are many shore-based applications ranging from fleet management<br />
software to vessel traffic systems, and design software for various marine systems<br />
ranging from ships’ hulls to dynamic risers for floating production systems.<br />
Figure 22.1: <strong>Marine</strong> IT – Major Sectors<br />
Source: Douglas–Westwood<br />
In total, marine IT covers a very wide range of subject areas and systems including:<br />
Critical IT – Navigation, Charting, Engine Management, Systems Management,<br />
Positioning, Communication, Loading/stability,Weather Forecasting and Ocean<br />
Modeling, Data Management.<br />
Non-critical IT – ISM Code Reporting, Accident & Injury Reporting, Cargo<br />
Transactions, Fuel Reporting, Bunkering Ops, Cargo Status Reporting, Crew &<br />
Payroll, Daily Log, Engineers Log, Invoices, Manifesting, Supplies, Equipment<br />
Performance Log, Equipment Procurement, Internet, Classification Reporting,<br />
Maintenance Management, Purchasing Management, Mail,Work Systems.<br />
Other IT – Design, Build, Procurement.<br />
Office-based software – VTMS, Brokering, Engineering Procurement, Crew<br />
management, Positioning/tracking, Accounting, Data Management, Fleet<br />
Management,Vessel Scheduling, Planning & Reservation.<br />
A significant barrier to development of marine IT has been the relatively high costs<br />
of high data rate satellite communications compared with onshore hard-wire or<br />
mobiles. Substantial improvements have been made but until broadband is successfully<br />
launched by Inmarsat in 2005/06, a bottleneck will remain. It is possible that the<br />
provision of internet services for the airline industry may speed up the process and<br />
reduce costs. Boeing are entering the maritime satellite communications market,<br />
challenging the historic dominance of Inmarsat.
114 MARINE INDUSTRIES GLOBAL MARKET ANALYSIS<br />
Figure 22.2: <strong>Marine</strong> IT – World <strong>Market</strong><br />
The previously unavailable Mobile Packet Data Service is to open up new levels of<br />
satellite communication to smaller vessels with the introduction of its capability into<br />
the Fleet 33 service from Inmarsat. Operating in a similar way to a GPRS mobile<br />
phone, the data connection is maintained constantly, resulting in users being charged<br />
only for the amount of data sent or received rather the time spent actually on line.<br />
As in other IT sectors, there is a degree of consolidation ongoing as companies<br />
acquire other players in order to offer a range of applications.<br />
22.2 WORLD MARKET<br />
The very wide range of applications and lack of any official information on business<br />
activity in the marine sector means that it is difficult to value the market.<br />
Source: Douglas–Westwood<br />
Table 22.1: <strong>Marine</strong> IT – World <strong>Market</strong><br />
1999–03 2004 2005–09<br />
Africa 328 124 786<br />
Asia 3,517 1,315 5,620<br />
Australasia 129 43 224<br />
E Europe/FSU 200 94 565<br />
Latin America 466 140 742<br />
Middle East 461 169 808<br />
North America 885 304 1,396<br />
Western Europe 3,794 1,382 5,872<br />
TOTAL (€M) 9,780 3,570 16,012<br />
Source: Douglas-Westwood<br />
Figure 22.3: <strong>Marine</strong> IT – Regional Segmentation<br />
2005–2009<br />
In order to develop a market value, we have assumed that the IT content of capital<br />
expenditure in three key areas of shipping operations (including IT additions to<br />
existing ships), newbuild ship capex, and the offshore oil & gas industry capex &<br />
opex averages 0.5% and this grows to 0.75% by 2004 and thereafter remains at<br />
this proportion.<br />
For example, in the case of a €35 million medium size tanker this would equate to an<br />
IT value of €262,000.This may at first sight appear high, but the value is intended to<br />
include capital items on the vessel such as the IT content of bridge systems,<br />
communication systems, embedded engine control & management systems, safety<br />
and automation systems, etc., right down to the software packages used in the design<br />
of the vessel.<br />
It may be argued that the IT content of other sectors could also be added, however,<br />
the values are much smaller than the three above, and that the IT content of the very<br />
large marine tourism sector is mainly shore-based conventional hotel/reservation<br />
management systems and not marine-specific.<br />
On this basis, marine IT was valued at €3.6 billion in 2004. Historically marine IT<br />
has been growing substantially from €1.3 billion in 1999.There is an overall longterm<br />
increase in IT content in the marine sector. <strong>Global</strong>ly, the sector is set for long<br />
term steady growth; however after a peak in 2004, annual growth is forecast at –0.9%,<br />
although period growth 2005–2009 is 7%.<br />
Source: Douglas–Westwood
MARINE INDUSTRIES GLOBAL MARKET ANALYSIS<br />
115<br />
22.3 EUROPEAN MARKET<br />
Europe accounts for some 39% of the world market in 2004 (€1.4 billion), this is<br />
mainly due to the strong position in shipping, aspects of shipbuilding and the offshore<br />
oil & gas industry. As a result many of the significant players in the sector are<br />
European-based or owned.<br />
These range from providers of electronic charting systems to specialist design<br />
software. It is likely that a significant percentage of European companies’ revenues<br />
from marine IT are from export business. Forecast period growth is estimated, from<br />
€3.8 billion 1999–2003 to €5.9 billion 2005–2009.<br />
22.4 TECHNOLOGICAL CHALLENGES<br />
The main challenges ahead probably relate to the growth of low-cost manufacturing<br />
centres in China, India and Eastern Europe.These are already used by a number of<br />
European players with the result that local manufacturing jobs are being lost to<br />
regions such as SE Asia.The growing capability of companies in these areas and<br />
availability of graduate engineers at low cost probably means that design could also<br />
move there too.<br />
22.5 THE LONG-TERM – 2010 ONWARDS<br />
The continual need to improve efficiency of operations in all sectors of the marine<br />
industries will drive an increasing use of marine IT. Of particular significance will be<br />
the need to respond to increasing fuel costs and increases in automation, vessel<br />
tracking and security requirements and these will form the main focus for R&D.<br />
The growing availability of affordable broadband communications will greatly<br />
improve the prospects for marine IT, by lowering cost of remote access to shore-based<br />
services and the rest of the ‘wired-world’.
116 MARINE INDUSTRIES GLOBAL MARKET ANALYSIS
MARINE INDUSTRIES GLOBAL MARKET ANALYSIS<br />
117<br />
23 <strong>Marine</strong> Biotechnology<br />
1999–03 2004 2005–09<br />
Irish market €M – – –<br />
UK market €M – – –<br />
Europe market €M – – –<br />
World market €M 11,350 2,190 11,848<br />
Definition – the value of biotechnology products based on the use of marine organisms.<br />
23.1 INTRODUCTION<br />
80% of living organisms are found only in aquatic ecosystems, yet little is known<br />
about their biochemical characteristics.The marine biotechnology sector is in the<br />
early stages of its development with considerable interest being shown by the US,<br />
Japan, the UK and others. (It is arguable that at this stage in its development the<br />
<strong>Marine</strong> Biotechnology sector should be regarded as part of the R&D sector.)<br />
<strong>Marine</strong> biotechnology offers considerable long-term potential which is mainly<br />
outside the timeframe of this report.<br />
However, there have been some initial successes – the US Sea Grant has reported<br />
that with small investments five drugs have been developed “with market potential<br />
of $2bn p.a.”<br />
It is likely that the future marine biotechnology market should segment along similar<br />
lines to the established ‘conventional’ biotechnology market which is dominated by<br />
US companies (76% of global revenues followed by Europe 22%). However, the<br />
UK report referenced below implies that this may not be the case and that much<br />
more may be open to non-US companies.<br />
A recent report commissioned by the UK’s Foresight <strong>Marine</strong> Panel stated “With a<br />
global market valued at $2.4 billion in 2002, and a predicted growth rate exceeding<br />
10% per annum over the next three years, there is no doubting that marine<br />
biotechnology represents one of the most exciting emerging technology sectors”. 76<br />
The UK Foresight Report also stated:“<strong>Marine</strong> biotechnology is unlike other areas<br />
of biotechnology in that it is defined in terms of its source material, rather than the<br />
market it serves. It is anticipated that it will eventually contribute to nearly every<br />
industry sector, from healthcare to bioremediation and from cosmetics to<br />
nutraceuticals.The time to invest in the underpinning science, knowledge networks,<br />
and public understanding of this major biotechnology field has now arrived”.<br />
Examples of marine biotechnology are quoted in the UK report as follows:<br />
• The potential for marine natural products as pharmaceuticals was first developed<br />
in the 1950s which led to two marine-derived pharmaceuticals that are still in use<br />
today. Ara-C is an anti-cancer drug (used against acute myelocytic leukemia and<br />
non-Hodgkin’s lymphoma) and Ara-A used as an antiviral drug for treating herpes.<br />
Both these drugs were derived from natural compounds found in sponges off the<br />
Note: Being an early-stage development<br />
there is insufficient information on which<br />
to base a regional segmentation.<br />
76<br />
http://www.dti.gov.uk/marine_biotechnology_report.html
118 MARINE INDUSTRIES GLOBAL MARKET ANALYSIS<br />
coast of Florida. Sponges have provided over 30% of the more than 5,000 chemical<br />
compounds derived from marine organisms to date.<br />
• More recently,Vent DNA polymerase has been isolated from micro-organisms<br />
living around deep-sea hydrothermal vents. Polymerase Chain Reaction (PCR) is<br />
used to amplify very small amounts of DNA or RNA, and forms the basic process<br />
behind the gene mapping for the Human Genome Project. PCR requires enzymes<br />
that are stable at high temperature, precisely the conditions that the Vent DNA<br />
micro-organism has become adapted to.<br />
• Nutraceuticals, or nutritional supplements, is a major growth area for the large<br />
pharmaceuticals companies. <strong>Marine</strong> microalgae are known to produce high levels of<br />
the fatty-acid, docosahexenoic acid (DHA) and arachidonic acid (ARA), both of<br />
which are found at high level in breast milk. Because these polyunsaturated fatty<br />
acids (PUFAs) have been linked to brain grey matter development, they are<br />
regarded as an important nutritional supplement, especially for infants. One such<br />
product, developed by Martek Biosciences in the US, is a market leader.<br />
Figure 23.1: <strong>Marine</strong> Biotechnology –<br />
World <strong>Market</strong><br />
23.2 WORLD MARKET<br />
In 2004 world production was valued at €2.2 billion. An earlier report describes<br />
the US marine biotechnology industry and the emerging market of marine<br />
biotechnology products and services.The global marine biotechnology market<br />
is projected to surpass €2.6 billion by 2009 with the non-US segment comprising<br />
the bulk of the market. 77<br />
The UK Foresight Report gives a predicted growth rate “exceeding 10% per annum<br />
over the next three years” (from 2002). BCC Research in 2003 estimated average<br />
growth from 1999 to 2007 as:<br />
Source: Douglas–Westwood<br />
USA 4.7%<br />
Rest of World 6.4%<br />
Total 5.9%<br />
Over-estimation of market growth in the early years of technological development is<br />
a common failing, therefore in our forecasts we have chosen to use an average growth<br />
of 5.5% . (The 5.5% is the forecast in dollars.When exchange rates are applied, the<br />
Euro growth rate is 3.8%.) In our view it is likely that the anticipated very large<br />
market for marine biotechnology will develop outside the time period of this report.<br />
This makes marine biotechnology a very interesting long-term ‘investment’ prospect.<br />
77<br />
http://www.bccresearch.com/biotech/C184R.html
MARINE INDUSTRIES GLOBAL MARKET ANALYSIS<br />
119<br />
23.3 EUROPEAN MARKET<br />
As the sector is in the early-stages of development, there is insufficient information on<br />
which to base country or regional segmentation of data.‘<strong>Market</strong>’ is rather a misnomer<br />
at this early stage of the development of marine biotechnology as the focus is firmly<br />
on research.The EU has funded some 75 projects in marine biotechnology.Although<br />
most countries have some level of activities, France and Germany are probably the<br />
most significant players, followed by the Netherlands, Ireland and Sweden.<br />
Within the UK some 61 Higher Education <strong>Institute</strong>s are involved in researching<br />
and/or teaching marine sciences and of these 49 are involved in marine<br />
biotechnology or related research.<br />
Of particular significance may be the UK’s high level of development as a centre<br />
for conventional (land-based) biotechnology.<br />
With annual sales of over $9.7 billion, the biotechnology industry in the UK is<br />
second in size only to the US. Along with some of the world’s largest pharmaceutical<br />
multinational corporations, there are approximately 460 biotechnology companies,<br />
including consultant and service companies, working in this sector. An estimated 270<br />
are dedicated biotechnology firms and 48 are publicly traded. Small and mediumsized<br />
biotechnology companies drive the industry as key sources of innovation. 78<br />
Biopharmaceuticals are the primary strength of the UK biotechnology industry,<br />
with an emphasis on genomics and gene therapy, combinatorial chemistry, regulation<br />
of cells, and development of transgenic animals. As much as 70% of all biotechnology<br />
companies focus on health care products.<br />
The UK biotechnology industry is also characterized by clusters. Established to assist<br />
start-up companies and combine expertise to strengthen the industry, biotechnology<br />
clusters have become essential to industry growth.The clusters are located around<br />
academic centres of excellence, the main focal points being London, around Oxford,<br />
Cambridge and Scotland.<br />
Key issues facing the UK marine biotechnology sector (and probably shared<br />
by others) are regarded as:<br />
• Developing stable financial investment.<br />
• Creating productive communication between the marine biotechnology<br />
community and the private and public sectors.<br />
78<br />
http://atn-riae.agr.ca/europe/e3345.htm
120 MARINE INDUSTRIES GLOBAL MARKET ANALYSIS<br />
• Delivering to the industrial sector development leads that are needed and for which<br />
they are willing to pay.<br />
• Educating and training the people to make this possible.<br />
• Promoting, marketing and positioning sector in a distinctive way.<br />
23.4 THE LONG-TERM – 2010 ONWARDS<br />
In 2002, Ernst & Young reported that there were 4,324 biotechnology companies<br />
worldwide with 188,703 employees, R&D expenditure of $16.4 billion and revenues<br />
of $35.8 billion. $25 billion of this was generated by US companies. 79 ‘Invest in Japan’<br />
stated that the Japanese biotechnology market was worth $10.2bn in 2002. 80 These<br />
numbers seem disproportionate, but do serve to illustrate the size of the industry.<br />
Considering that the oceans contain 80% of living organisms, it is reasonable to<br />
suggest that the long-term potential for marine biology must greatly exceed<br />
conventional land-based biotechnology revenue values.<br />
79<br />
‘Refocus:The European Perspective <strong>Global</strong> Biotechnology Report 2004’. Ernst & Young.<br />
80<br />
http://www.jetro.go.jp/usa/newyork/investinjapan/html/bio_overview.htm
MARINE INDUSTRIES GLOBAL MARKET ANALYSIS<br />
121<br />
24 Education & Training<br />
1999–03 2004 2005–09<br />
Irish <strong>Market</strong> €M – – –<br />
UK <strong>Market</strong> €M – – –<br />
Europe <strong>Market</strong> €M – – –<br />
World <strong>Market</strong> €M 10,041 1,537 7,691<br />
Definition – fees from higher education in marine subjects and training of marine personnel.<br />
24.1 INTRODUCTION<br />
Education & Training has three primary activities: seafarer training, offshore worker<br />
training and higher education (e.g. universities).<br />
Seafarer training – 400,000 officers and 825,000 ratings are employed worldwide<br />
with 60% of the latter being from the Asia Pacific region.There has been a 27% oversupply<br />
of ratings although there are doubts about the extent to which large numbers<br />
of these ratings are qualified for international service. 81<br />
The majority of ratings are recruited from developing countries, especially the Far<br />
East.The Philippines alone provides almost 20% of the global maritime workforce.<br />
The Philippines is the largest supplier of seafarers with some 180,000 or 28.5% of the<br />
total maritime population of 632,000 on board vessels worldwide. Russia is second<br />
with 7.3%.<br />
Currently, 418 ‘maritime schools’ are listed worldwide. In 2000, there were 121<br />
maritime schools in the Philippines rapidly resulting in an over-supply of trained<br />
seafarers. However, in 2004 the number of schools was down to 76, twenty of which<br />
will be phased-out in the next two years, after their last students have graduated.<br />
Of the 500,000 registered Filipino seafarers, enough to man most of the vessels afloat<br />
around the world, more than 300,000 are unemployed.<br />
However, other countries are also adding training capacity – South Africa opened<br />
a 150 student training academy in 2003 offering two three-year courses.<br />
Amongst training now being used are tools such as bridge and engine room<br />
simulators. Specialised courses for the fishing industry are offered by some<br />
establishments. In 2003, 1,681 attendances were registered in Ireland at the country’s<br />
BIM Training Centres.<br />
China and India are also significant maritime labour supply nations. Other major<br />
labour supply countries include Greece, Japan, Norway, Russia and the UK.<br />
There is regarded to be a 4% undersupply of officers which is expected to rise to<br />
12% by 2010.The OECD countries remain the most important source for officers,<br />
but growing numbers of officers are now recruited from the Far East and Eastern<br />
Europe and it is expected that this trend will accelerate as the ageing OECD officer<br />
group retires.<br />
Note:As training may be provided in one<br />
country to meet demand from other<br />
countries, it is difficult to segment the<br />
‘market’ by regions.This is particularly the<br />
case for the shipping industry and to a lesser<br />
extent higher education.<br />
81<br />
http://www.marisec.org/resources/2000Manpowerupdate .htm
122 MARINE INDUSTRIES GLOBAL MARKET ANALYSIS<br />
Figure 24.1: Education & Training –<br />
World <strong>Market</strong><br />
Seafarer training typically costs $5–20K and officer $40K. Refresher and ongoing<br />
training, such as fire-fighting or sea survival, are an additional training cost.<br />
We estimate over 2005–9 a total of 177,000 personnel will need training.<br />
Offshore workers undergo safety training on a four year cycle.With an estimated<br />
80,000 workers worldwide, some 20,000 are trained per annum. Safety training facilities<br />
are established in most of the world’s significant offshore oil & gas operating areas.<br />
Safety training has been provided by the industry for many years, with the highest<br />
standards emanating from the North Sea due to a more demanding offshore<br />
environment than the Gulf of Mexico (from where the offshore industry originated)<br />
and its extensive use of helicopters for crew transfers.The need for even higher<br />
standards of safety and training was bought into focus following the Piper Alpha tragedy.<br />
Source: Douglas–Westwood<br />
In addition to normal fire and first aid training, helicopter evacuation training<br />
has long been a requirement for North Sea workers and is conducted in<br />
specially equipped tanks.The introduction of free-fall lifeboats also introduced<br />
another requirement.<br />
North Sea service providers, mainly based in the UK and Norway, have also<br />
developed into international markets.<br />
Higher education establishments offering marine courses total at least 241<br />
worldwide. However, it is difficult to estimate all associated expenditure in this area as<br />
total operating costs of institutions often greatly exceed fees charged. In addition, it is<br />
difficult to clearly separate the education element of institutions’ activities from<br />
research activities.<br />
All education and training has a strategic role in ‘marketing’ the supplier country<br />
and its technology to foreign students.<br />
24.2 WORLD MARKET<br />
The world value is estimated at €1.5 billion in 2004. Due in part to a recent oversupply<br />
of seafarers being trained, levels of activity have fallen slightly.This is due to be<br />
followed by a slight upturn with other areas within the sector seeing growth, resulting<br />
in annual average growth 2005–2009 of 1.5%.
MARINE INDUSTRIES GLOBAL MARKET ANALYSIS<br />
123<br />
25 Research & Development<br />
1999–03 2004 2005–09<br />
Irish <strong>Market</strong> €M 325 62 329<br />
UK <strong>Market</strong> €M 3,252 621 3,294<br />
Europe <strong>Market</strong> €M 15,742 3,273 16,471<br />
World <strong>Market</strong> €M 50,484 10,629 54,320<br />
Definition – expenditure on R&D in all aspects of marine activities.<br />
25.1 INTRODUCTION<br />
Research & Development relates to four main sub-sectors: shipbuilding, oil & gas,<br />
other industrial, and government (mainly academic). Our figures exclude the<br />
important military naval sector where the US accounts for €13bn and the world<br />
total could be €26bn.This is important to the civil sector, not only in terms of<br />
direct military contracts which can financially underpin companies, but also the<br />
technological spin-off into civil applications.The US Navy budget for development,<br />
testing & evaluation has increased from $14.9bn in 2004 to $16.3bn in 2005.This<br />
includes $477m for basic research, $564m for applied research, $677m for advanced<br />
technology development, $2.8bn for advanced components development and $8bn<br />
for system development and demonstration. 82 The US has a programme to specifically<br />
involve SMEs in military R&D.<br />
Figure 25.1: R&D – World <strong>Market</strong><br />
25.2 WORLD MARKET<br />
The <strong>Marine</strong> R&D sector is valued at €11bn for 2004. A number of sectors make<br />
up this global value. Historically, activity has been fairly constant with forecast growth<br />
estimated at 1.4% annually from 2005 through to 2009.<br />
• We value shipbuilding R&D at €1.8bn and its future growth is mainly a function<br />
of future growth of revenues. Centres of shipbuilding R&D exist through Europe<br />
and SE Asia.<br />
• The oil & gas industry is estimated to spend €2.5bn, but in future years this must<br />
increase in line with the technical challenges that will be faced. Major centres are<br />
Brazil, France, Norway, the UK and the US. (Our estimates are based the mid point<br />
of figures produced separately by McKinsey and Shell.)<br />
• Other marine industries, we believe, total some €1bn in annual R&D spend.<br />
• Government is a major spender with over 1,200 ‘research’ vessels operating<br />
worldwide.The US leads and we estimate NOAA’s marine budget at €2bn. Other<br />
countries probably total €3 billion.The response to global warming is likely to<br />
increase this.<br />
Source: Douglas–Westwood<br />
Table 25.1: R&D – World <strong>Market</strong><br />
1999–03 2004 2005–09<br />
Africa 716 151 762<br />
Asia 10,981 2,332 11,709<br />
Australasia 1,083 225 1,163<br />
E Europe/FSU 1,377 286 1,488<br />
Latin America 2,184 445 2,368<br />
Middle East 2,137 445 2,329<br />
North America 16,266 3,472 18,030<br />
Western Europe 15,742 3,273 16,471<br />
TOTAL (€M) 50,484 10,629 54,320<br />
Source: Douglas-Westwood<br />
Figure 25.2: R&D – Regional Segmentation<br />
2005–2009<br />
82<br />
‘Sea Technology Buyers Guide/Directory’ 2005.<br />
Source: Douglas–Westwood
124 MARINE INDUSTRIES GLOBAL MARKET ANALYSIS<br />
Figure 25.3: <strong>Marine</strong> R&D by Sector<br />
Source: Douglas–Westwood<br />
25.3 EUROPEAN MARKET<br />
Europe’s share of the world market was €3.3 billion in 2004 and is set to grow to<br />
€3.5 billion by 2009.“Research & Development (R&D) is a driving force behind<br />
economic growth, job creation, innovation of new products and increasing quality of<br />
products in general, as well as improvements in healthcare and environmental<br />
protection. At the Lisbon summit in 2000,The European Council set a clear strategic<br />
objective for the current decade: to make Europe the most competitive and dynamic<br />
knowledge-based economy in the world.” 83<br />
There has been some progress in this. In terms of patents filed per head of population<br />
in 2001, Finland, Germany, Norway and Sweden greatly exceeded the US despite the<br />
Us’s higher total R&D spend measured as a percentage of GDP.<br />
“R&D intensity is highest in Sweden and Finland (3.4 and 4.3% of GDP) but total<br />
expenditure greatest in Germany, France and the UK. Portugal, Denmark and Ireland<br />
(1.2%) show the highest real growth rate in R&D expenditure.”<br />
Western Europe is responsible for a major part of world R&D activity, probably only<br />
second to the US.The majority of R&D expenditure in Europe comes from industry.<br />
Offshore Oil & Gas – This has benefited from major research programmes in<br />
France, Norway and the UK, resulting in products and technologies sold worldwide.<br />
In the past considerable European Commission funding has been applied to<br />
programmes such as ‘Hydrocarbons Research’ with the aim of reducing dependency<br />
on OPEC oil supplies by development of offshore Europe. However, EU official<br />
focus has now moved onto renewable energy.<br />
Initially, incoming oil companies were ‘encouraged’ to invest in R&D as part of the<br />
UK licensing requirements until this fell foul of EU regulations.<br />
However, production of oil & gas from Norway, is mainly by the Norwegian state oil<br />
companies, who have always invested heavily in R&D.<br />
Nowadays, the main application of oil company R&D funds is in joint industry<br />
programmes (JIP) where they can access 100% of the results for a fraction of the cost.<br />
However, oil companies tend to keep any ‘competitive edge’ R&D in-house or<br />
contract it out on a confidential basis to commercial companies or universities.<br />
The main technical challenges are now at the extremes of the sector: deepwater,<br />
exploiting the many remaining small shallow water fields and maximising recovery<br />
83<br />
‘Eurostat Yearbook’ 2004.
MARINE INDUSTRIES GLOBAL MARKET ANALYSIS<br />
125<br />
from depleting fields (‘brown fields’).Within Scotland the government funded ITI<br />
Energy organisation has initiated a significant programme to address its mature oil &<br />
gas assets.<br />
Other programmes include the US Deepstar aimed at the challenges of deepwater<br />
and there are similar programmes operating in Norway and Brazil.<br />
Shipbuilding – Fuel price increases have resulted in growing pressures to reduce vessel<br />
operating costs and the major challenge is to radically improve propulsion efficiency.<br />
Engine emission reduction is also a significant challenge in light of EU requirements.<br />
As with many other sectors, there is an increasing need for application of higher levels<br />
of control and automation and overall safety.<br />
The shipbuilding industry in Europe reports spending 10% of revenues in R&D,<br />
however, much of this is associated with the need to develop specific design variations<br />
(rather than ‘true’ R&D) for the special vessels that dominate European yards’<br />
production.Therefore in our estimates we use 5% of revenues.<br />
Other <strong>Industries</strong> – Offshore renewables is now a particular area of focus for the UK<br />
and some other European countries.<br />
Government – This includes the various facets of government-funded academic<br />
research carried out in universities and other institutions.<br />
25.4 THE LONG-TERM – 2010 ONWARDS<br />
The long-term drivers are well known:<br />
• <strong>Global</strong> Warming<br />
• Population Growth<br />
• Demographic change<br />
• The Developing Economies.
126 MARINE INDUSTRIES GLOBAL MARKET ANALYSIS<br />
Major R&D challenges lie ahead, including:<br />
Oil & Gas – Increasing exploitation of gas reserves in light of reducing oil supplies,<br />
increasing oil & gas recovery from brown fields and greater water depths, and<br />
economically developing small fields.<br />
Renewable Energy – Reducing capital costs and improving reliability. Operating<br />
wind farms in deeper waters and at greater distances from the shore. Development of<br />
wave and tidal current power.<br />
Methane Hydrates – We expect increasing efforts to commercially exploit this<br />
potentially large deepwater energy resource. (Significant projects are already underway<br />
in Japan.)<br />
Shipbuilding – How to employ technology to counter high European labour costs<br />
and the threat of China’s penetration of the ‘special vessels’ sector that accounts for<br />
much of Europe’s business.<br />
<strong>Marine</strong> Biotechnology – This is likely to receive increasing attention as its large<br />
potential is more widely recognised.<br />
Perhaps one long-term concern should be the development of major R&D<br />
capabilities in Asia and the growing power of these countries to ‘undercut’ established<br />
Western centres in attracting commercial R&D funds.We expect countries such as<br />
China, India and Russia to become increasingly competitive due to low labour costs<br />
(a graduate with a master’s degree can be employed in India at 25% of the cost of an<br />
equivalent person in the US).<br />
Offering to undertake R&D in a developing country is often seen as a way for an<br />
incoming company to deliver local content.<br />
A challenge for Western governments will increasingly be how to anchor technology<br />
development in their own countries.
MARINE INDUSTRIES GLOBAL MARKET ANALYSIS<br />
127<br />
Notes
128 MARINE INDUSTRIES GLOBAL MARKET ANALYSIS<br />
Notes
Strategic Planning and Development Services<br />
www.marine.ie<br />
ISSN: 1649-590X<br />
HEADQUARTERS<br />
MARINE INSTITUTE<br />
Galway Technology Park<br />
Parkmore<br />
Galway<br />
Tel: +353 91 730 400<br />
Fax: +353 91 730 470<br />
Email: institute.mail@marine.ie<br />
(Moving to Oranmore in 2005)<br />
MARINE INSTITUTE REGIONAL OFFICES & LABORATORIES<br />
MARINE INSTITUTE<br />
80 Harcourt Street<br />
Dublin 2<br />
Tel: +353 1 4766500<br />
Fax: +353 1 4784988<br />
MARINE INSTITUTE<br />
Furnace<br />
Newport<br />
Co. Mayo<br />
Tel: +353 98 42300<br />
Fax: +353 98 42340<br />
MARINE INSTITUTE<br />
Snugboro Road<br />
Abbottstown<br />
Dublin 15<br />
Tel: +353 1 822 8200<br />
Fax: +353 1 820 5078