Marine Industries Global Market Analysis - Marine Institute
Marine Industries Global Market Analysis - Marine Institute
Marine Industries Global Market Analysis - Marine Institute

Create successful ePaper yourself
Turn your PDF publications into a flip-book with our unique Google optimized e-Paper software.
38 MARINE INDUSTRIES GLOBAL MARKET ANALYSIS<br />
• Government (civil spend) – where the US NOAA’s National Ocean Service is<br />
perhaps the world’s largest spender.<br />
Taking into account other industries, our estimated total for 2004 is some<br />
€10.2 billion.<br />
We assume a continuing level of R&D intensity in future years (R&D as a % of<br />
total sector sales value) which is then applied to our individual sector forecasts, such<br />
as shipbuilding.<br />
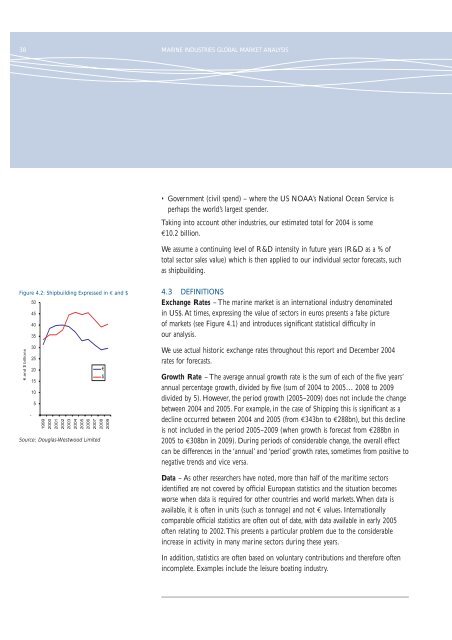
Figure 4.2: Shipbuilding Expressed in € and $<br />
4.3 DEFINITIONS<br />
Exchange Rates – The marine market is an international industry denominated<br />
in US$. At times, expressing the value of sectors in euros presents a false picture<br />
of markets (see Figure 4.1) and introduces significant statistical difficulty in<br />
our analysis.<br />
We use actual historic exchange rates throughout this report and December 2004<br />
rates for forecasts.<br />
Source: Douglas-Westwood Limited<br />
Growth Rate – The average annual growth rate is the sum of each of the five years’<br />
annual percentage growth, divided by five (sum of 2004 to 2005… 2008 to 2009<br />
divided by 5). However, the period growth (2005–2009) does not include the change<br />
between 2004 and 2005. For example, in the case of Shipping this is significant as a<br />
decline occurred between 2004 and 2005 (from €343bn to €288bn), but this decline<br />
is not included in the period 2005–2009 (when growth is forecast from €288bn in<br />
2005 to €308bn in 2009). During periods of considerable change, the overall effect<br />
can be differences in the ‘annual’ and ‘period’ growth rates, sometimes from positive to<br />
negative trends and vice versa.<br />
Data – As other researchers have noted, more than half of the maritime sectors<br />
identified are not covered by official European statistics and the situation becomes<br />
worse when data is required for other countries and world markets.When data is<br />
available, it is often in units (such as tonnage) and not € values. Internationally<br />
comparable official statistics are often out of date, with data available in early 2005<br />
often relating to 2002.This presents a particular problem due to the considerable<br />
increase in activity in many marine sectors during these years.<br />
In addition, statistics are often based on voluntary contributions and therefore often<br />
incomplete. Examples include the leisure boating industry.