Marine Industries Global Market Analysis - Marine Institute
Marine Industries Global Market Analysis - Marine Institute
Marine Industries Global Market Analysis - Marine Institute

You also want an ePaper? Increase the reach of your titles
YUMPU automatically turns print PDFs into web optimized ePapers that Google loves.
52 MARINE INDUSTRIES GLOBAL MARKET ANALYSIS<br />
Table 6.1: Shipping – World <strong>Market</strong><br />
1999–03 2004 2005–09<br />
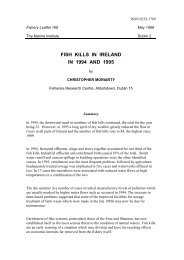
Africa 7,861 2,693 11,233<br />
Asia 401,104 137,383 573,153<br />
Australasia 6,391 2,189 9,132<br />
E Europe/FSU 22,625 7,749 32,330<br />
Latin America 14,911 5,107 21,308<br />
Middle East 36,610 12,539 52,313<br />
North America 69,912 23,946 99,901<br />
Western Europe 452,186 151,137 637,315<br />
TOTAL (€M) 1011,600 342,743 1436,684<br />
Source: Douglas-Westwood<br />
Figure 6.3: Shipping – Regional Segmentation<br />
2005–2009<br />
Our own view is of a gradual slowing of shipping sector growth and a return to more<br />
normal long-term trends by 2007.<br />
It is difficult to quantify the value of the volume of world seaborne trade in monetary<br />
terms, as figures for trade estimates are traditionally in terms of tonnes or tonne-miles,<br />
and are therefore not comparable with monetary-based statistics for the value of the<br />
world economy.<br />
However, the United Nations Conference on Trade and Development (UNCTAD)<br />
estimates that the operation of merchant ships contributes about US$380 billion<br />
(€292bn) in freight rates within the global economy, equivalent to about 5% of total<br />
world trade. 23<br />
In order to check the above we have analysed earnings of some major ship owners.<br />
As an example, Danish shipping has earnings of €15bn of which some $5.3bn comes<br />
from its own ships. Danish ships form about 2% of the merchant fleet by gross<br />
tonnage. If other owners have similar earnings then total world earnings of €243bn<br />
are suggested and this is the figure we use.<br />
There is no simple way of precisely apportioning earnings from shipping to regions<br />
and countries.The complication is that a ship may be operating under the flag of<br />
country A, owned by a company in country B, chartered by a company in country C<br />
and trading between countries D and E.The result is that parts of the associated<br />
business will accrue to A, B, C, D and E.<br />
Source: Douglas–Westwood<br />
Figure 6.4: Shipping Rates 2001–04<br />
6.3 CHINA & THE WORLD MARKET<br />
In 2004, rates for many types of shipping were double the averages achieved during<br />
the 1999–2003 period and in October spot rates for some very large crude carriers<br />
(VLCC) reached five times the long-term average.<br />
Shipowners have responded and the waiting time for new vessel deliveries reached<br />
three years.<br />
Chinese economic growth is the main reason for the remarkable increase in shipping<br />
rates and industry profit. In 2003, China’s imports expanded by 40% in nominal dollar<br />
terms while its exports grew by 35%.<br />
China is in the process of becoming the leading global manufacturing base – ‘the<br />
workshop of the world’ (a position once claimed by the UK). Much is driven by low<br />
wage rates, often 90% below European levels. Since the late 1970s it has managed to<br />
Source: Danish Shipping Association/R.S. Platou<br />
23<br />
‘shipping Facts’ http://www.marisec.org/shippingfacts/worldtradevolume.htm