Marine Industries Global Market Analysis - Marine Institute
Marine Industries Global Market Analysis - Marine Institute
Marine Industries Global Market Analysis - Marine Institute

You also want an ePaper? Increase the reach of your titles
YUMPU automatically turns print PDFs into web optimized ePapers that Google loves.
MARINE INDUSTRIES GLOBAL MARKET ANALYSIS<br />
61<br />
8 Ports<br />
1999–03 2004 2005–09<br />
Irish <strong>Market</strong> €M 832 150 780<br />
UK <strong>Market</strong> €M 10,429 1,842 9,595<br />
Europe <strong>Market</strong> €M 58,695 10,478 54,569<br />
World <strong>Market</strong> €M 141,979 25,017 135,526<br />
Definition – port revenues based on average prices per tonne of cargo loaded and unloaded.<br />
8.1 INTRODUCTION<br />
The Ports & Terminals Guide lists 8,336 ports and terminals worldwide. Perhaps some<br />
1,600 or so of these are significant ports. In 2002, the top 50 ports handled 5.8 billion<br />
tonnes of cargo. In 2003 vessel calls at world ports totalled 576,906. 33<br />
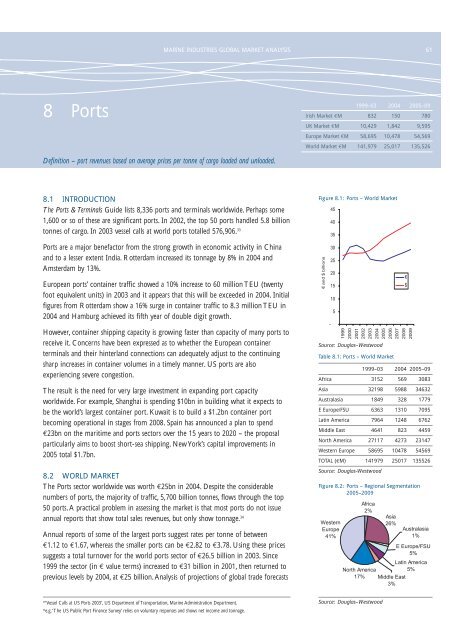
Figure 8.1: Ports – World <strong>Market</strong><br />
Ports are a major benefactor from the strong growth in economic activity in China<br />
and to a lesser extent India. Rotterdam increased its tonnage by 8% in 2004 and<br />
Amsterdam by 13%.<br />
European ports’ container traffic showed a 10% increase to 60 million TEU (twenty<br />
foot equivalent units) in 2003 and it appears that this will be exceeded in 2004. Initial<br />
figures from Rotterdam show a 16% surge in container traffic to 8.3 million TEU in<br />
2004 and Hamburg achieved its fifth year of double digit growth.<br />
However, container shipping capacity is growing faster than capacity of many ports to<br />
receive it. Concerns have been expressed as to whether the European container<br />
terminals and their hinterland connections can adequately adjust to the continuing<br />
sharp increases in container volumes in a timely manner. US ports are also<br />
experiencing severe congestion.<br />
The result is the need for very large investment in expanding port capacity<br />
worldwide. For example, Shanghai is spending $10bn in building what it expects to<br />
be the world’s largest container port. Kuwait is to build a $1.2bn container port<br />
becoming operational in stages from 2008. Spain has announced a plan to spend<br />
€23bn on the maritime and ports sectors over the 15 years to 2020 – the proposal<br />
particularly aims to boost short-sea shipping. New York’s capital improvements in<br />
2005 total $1.7bn.<br />
8.2 WORLD MARKET<br />
The Ports sector worldwide was worth €25bn in 2004. Despite the considerable<br />
numbers of ports, the majority of traffic, 5,700 billion tonnes, flows through the top<br />
50 ports. A practical problem in assessing the market is that most ports do not issue<br />
annual reports that show total sales revenues, but only show tonnage. 34<br />
Source: Douglas–Westwood<br />
Table 8.1: Ports – World <strong>Market</strong><br />
1999–03 2004 2005–09<br />
Africa 3152 569 3083<br />
Asia 32198 5988 34632<br />
Australasia 1849 328 1779<br />
E Europe/FSU 6363 1310 7095<br />
Latin America 7964 1248 6762<br />
Middle East 4641 823 4459<br />
North America 27117 4273 23147<br />
Western Europe 58695 10478 54569<br />
TOTAL (€M) 141979 25017 135526<br />
Source: Douglas-Westwood<br />
Figure 8.2: Ports – Regional Segmentation<br />
2005–2009<br />
Annual reports of some of the largest ports suggest rates per tonne of between<br />
€1.12 to €1.67, whereas the smaller ports can be €2.82 to €3.78. Using these prices<br />
suggests a total turnover for the world ports sector of €26.5 billion in 2003. Since<br />
1999 the sector (in € value terms) increased to €31 billion in 2001, then returned to<br />
previous levels by 2004, at €25 billion. <strong>Analysis</strong> of projections of global trade forecasts<br />
33<br />
‘Vessel Calls at US Ports 2003’, US Department of Transportation, <strong>Marine</strong> Administration Department.<br />
34<br />
e.g.‘The US Public Port Finance Survey’ relies on voluntary responses and shows net income and tonnage.<br />
Source: Douglas–Westwood