NPA Strategic Plan 2013 - 2018 - National Prosecuting Authority
NPA Strategic Plan 2013 - 2018 - National Prosecuting Authority
NPA Strategic Plan 2013 - 2018 - National Prosecuting Authority

You also want an ePaper? Increase the reach of your titles
YUMPU automatically turns print PDFs into web optimized ePapers that Google loves.
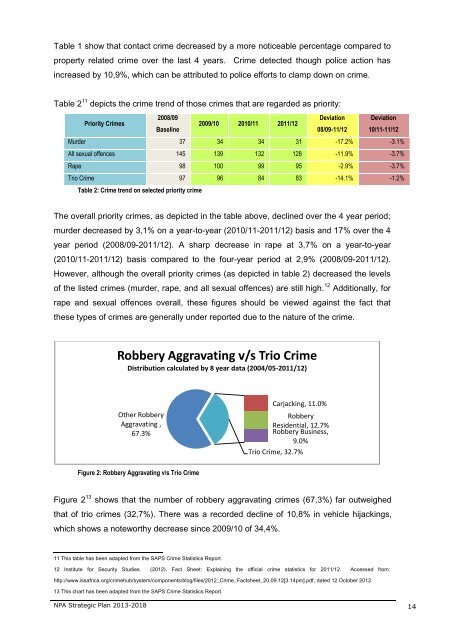
Table 1 show that contact crime decreased by a more noticeable percentage compared to<br />
property related crime over the last 4 years. Crime detected though police action has<br />
increased by 10,9%, which can be attributed to police efforts to clamp down on crime.<br />
Table 2 11 depicts the crime trend of those crimes that are regarded as priority:<br />
Priority Crimes<br />
2008/09<br />
Baseline<br />
2009/10 2010/11 2011/12<br />
Deviation<br />
08/09-11/12<br />
Deviation<br />
10/11-11/12<br />
Murder 37 34 34 31 -17.2% -3.1%<br />
All sexual offences 145 139 132 128 -11.9% -3.7%<br />
Rape 98 100 99 95 -2.9% -3.7%<br />
Trio Crime 97 96 84 83 -14.1% -1.2%<br />
Table 2: Crime trend on selected priority crime<br />
The overall priority crimes, as depicted in the table above, declined over the 4 year period;<br />
murder decreased by 3,1% on a year-to-year (2010/11-2011/12) basis and 17% over the 4<br />
year period (2008/09-2011/12). A sharp decrease in rape at 3,7% on a year-to-year<br />
(2010/11-2011/12) basis compared to the four-year period at 2,9% (2008/09-2011/12).<br />
However, although the overall priority crimes (as depicted in table 2) decreased the levels<br />
of the listed crimes (murder, rape, and all sexual offences) are still high. 12 Additionally, for<br />
rape and sexual offences overall, these figures should be viewed against the fact that<br />
these types of crimes are generally under reported due to the nature of the crime.<br />
Robbery Aggravating v/s Trio Crime<br />
Distribution calculated by 8 year data (2004/05-2011/12)<br />
Other Robbery<br />
Aggravating ,<br />
67.3%<br />
Carjacking, 11.0%<br />
Robbery<br />
Residential, 12.7%<br />
Robbery Business,<br />
9.0%<br />
Trio Crime, 32.7%<br />
Figure 2: Robbery Aggravating v/s Trio Crime<br />
Figure 2 13 shows that the number of robbery aggravating crimes (67,3%) far outweighed<br />
that of trio crimes (32,7%). There was a recorded decline of 10,8% in vehicle hijackings,<br />
which shows a noteworthy decrease since 2009/10 of 34,4%.<br />
11 This table has been adapted from the SAPS Crime Statistics Report.<br />
12 Institute for Security Studies. (2012). Fact Sheet: Explaining the official crime statistics for 2011/12. Accessed from:<br />
http://www.issafrica.org/crimehub/system/components/blog/files/2012_Crime_Factsheet_20.09.12[3.14pm].pdf, dated 12 October 2012.<br />
13 This chart has been adapted from the SAPS Crime Statistics Report.<br />
<strong>NPA</strong> <strong>Strategic</strong> <strong>Plan</strong> <strong>2013</strong>-<strong>2018</strong> 14