No Border
No Border
No Border

You also want an ePaper? Increase the reach of your titles
YUMPU automatically turns print PDFs into web optimized ePapers that Google loves.
Net cash used in investing activities amounted to ¥30,348 million ($283 million).<br />
The primary application of funds included continued acquisition of investment securities,<br />
paralleling the purchase of bonds to raise cash-management efficiency, as well as<br />
investment in such companies as Nissin Hualong Foods Co., Ltd. Also of note, the<br />
Company recorded a reduction in proceeds from sales and redemption of investment<br />
securities.<br />
Net cash used in financing activities came to ¥5,709 million ($53 million). The primary<br />
applications of funds included ¥3,702 million ($34 million) to pay cash dividends<br />
and ¥2,071 million ($19 million) for repayment of short-term borrowings.<br />
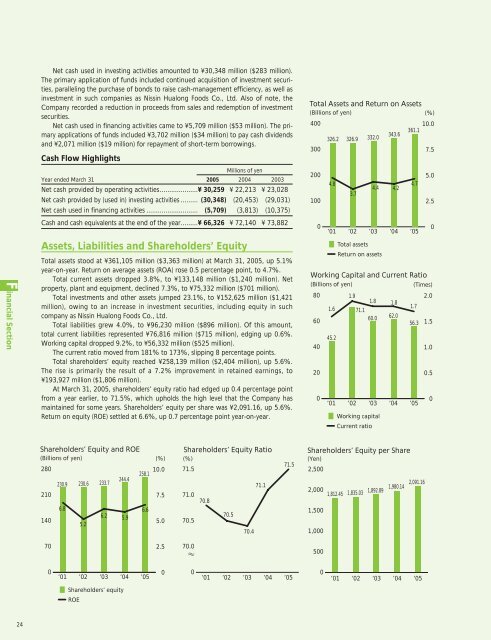
Cash Flow Highlights<br />
Total Assets and Return on Assets<br />
(Billions of yen)<br />
400<br />
300<br />
326.2<br />
326.9<br />
332.0<br />
343.6<br />
(%)<br />
10.0<br />
361.1<br />
7.5<br />
Millions of yen<br />
Year ended March 31 2005 2004 2003<br />
Net cash provided by operating activities....................¥ 30,259 ¥ 22,213 ¥ 23,028<br />
Net cash provided by (used in) investing activities ......... (30,348) (20,453) (29,031)<br />
200<br />
100<br />
4.8<br />
3.7<br />
4.4 4.2<br />
4.7<br />
5.0<br />
2.5<br />
Net cash used in financing activities ........................... (5,709) (3,813) (10,375)<br />
Cash and cash equivalents at the end of the year.........¥ 66,326 ¥ 72,140 ¥ 73,882<br />
0<br />
’01<br />
’02<br />
’03<br />
’04 ’05<br />
0<br />
F inancial Section<br />
Assets, Liabilities and Shareholders’ Equity<br />
Total assets stood at ¥361,105 million ($3,363 million) at March 31, 2005, up 5.1%<br />
year-on-year. Return on average assets (ROA) rose 0.5 percentage point, to 4.7%.<br />
Total current assets dropped 3.8%, to ¥133,148 million ($1,240 million). Net<br />
property, plant and equipment, declined 7.3%, to ¥75,332 million ($701 million).<br />
Total investments and other assets jumped 23.1%, to ¥152,625 million ($1,421<br />
million), owing to an increase in investment securities, including equity in such<br />
company as Nissin Hualong Foods Co., Ltd.<br />
Total liabilities grew 4.0%, to ¥96,230 million ($896 million). Of this amount,<br />
total current liabilities represented ¥76,816 million ($715 million), edging up 0.6%.<br />
Working capital dropped 9.2%, to ¥56,332 million ($525 million).<br />
The current ratio moved from 181% to 173%, slipping 8 percentage points.<br />
Total shareholders’ equity reached ¥258,139 million ($2,404 million), up 5.6%.<br />
The rise is primarily the result of a 7.2% improvement in retained earnings, to<br />
¥193,927 million ($1,806 million).<br />
At March 31, 2005, shareholders’ equity ratio had edged up 0.4 percentage point<br />
from a year earlier, to 71.5%, which upholds the high level that the Company has<br />
maintained for some years. Shareholders’ equity per share was ¥2,091.16, up 5.6%.<br />
Return on equity (ROE) settled at 6.6%, up 0.7 percentage point year-on-year.<br />
Total assets<br />
Return on assets<br />
Working Capital and Current Ratio<br />
(Billions of yen)<br />
(Times)<br />
80<br />
1.9<br />
1.8 1.8<br />
1.6<br />
1.7<br />
71.1<br />
60<br />
60.0<br />
62.0<br />
56.3<br />
45.2<br />
40<br />
20<br />
0<br />
’01 ’02 ’03 ’04 ’05<br />
Working capital<br />
Current ratio<br />
2.0<br />
1.5<br />
1.0<br />
0.5<br />
0<br />
Shareholders’ Equity and ROE<br />
(Billions of yen)<br />
280<br />
210<br />
230.9<br />
230.6<br />
233.7<br />
244.4<br />
258.1<br />
(%)<br />
10.0<br />
7.5<br />
Shareholders’ Equity Ratio<br />
(%)<br />
71.5<br />
71.1<br />
71.0<br />
70.8<br />
71.5<br />
Shareholders’ Equity per Share<br />
(Yen)<br />
2,500<br />
2,000<br />
1,812.45 1,835.03 1,892.89 1,980.14<br />
2,091.16<br />
140<br />
6.8<br />
5.2<br />
6.2 5.9<br />
6.6<br />
5.0<br />
70.5<br />
70.5<br />
70.4<br />
1,500<br />
1,000<br />
70<br />
2.5<br />
70.0<br />
500<br />
0<br />
’01<br />
’02<br />
’03<br />
’04 ’05<br />
0<br />
0<br />
’01<br />
’02<br />
’03<br />
’04 ’05<br />
0<br />
’01<br />
’02<br />
’03<br />
’04 ’05<br />
Shareholders’ equity<br />
ROE<br />
24