
You also want an ePaper? Increase the reach of your titles
YUMPU automatically turns print PDFs into web optimized ePapers that Google loves.
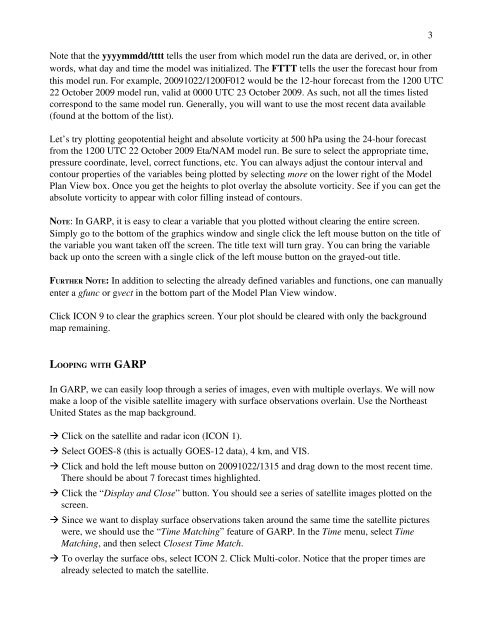
Note that the yyyymmdd/tttt tells the user from which model run the data are derived, or, in other<br />
words, what day and time the model was initialized. The FTTT tells the user the forecast hour from<br />
this model run. For example, 20091022/1200F012 would be the 12hour forecast from the 1200 UTC<br />
22 October 2009 model run, valid at 0000 UTC 23 October 2009. As such, not all the times listed<br />
correspond to the same model run. Generally, you will want to use the most recent data available<br />
(found at the bottom of the list).<br />
Let’s try plotting geopotential height and absolute vorticity at 500 hPa using the 24hour forecast<br />
from the 1200 UTC 22 October 2009 Eta/NAM model run. Be sure to select the appropriate time,<br />
pressure coordinate, level, correct functions, etc. You can always adjust the contour interval and<br />
contour properties of the variables being plotted by selecting more on the lower right of the Model<br />
Plan View box. Once you get the heights to plot overlay the absolute vorticity. See if you can get the<br />
absolute vorticity to appear with color filling instead of contours.<br />
NOTE: In GARP, it is easy to clear a variable that you plotted without clearing the entire screen.<br />
Simply go to the bottom of the graphics window and single click the left mouse button on the title of<br />
the variable you want taken off the screen. The title text will turn gray. You can bring the variable<br />
back up onto the screen with a single click of the left mouse button on the grayedout title.<br />
FURTHER NOTE: In addition to selecting the already defined variables and functions, one can manually<br />
enter a gfunc or gvect in the bottom part of the Model Plan View window.<br />
Click ICON 9 to clear the graphics screen. Your plot should be cleared with only the background<br />
map remaining.<br />
3<br />
LOOPING WITH GARP<br />
In GARP, we can easily loop through a series of images, even with multiple overlays. We will now<br />
make a loop of the visible satellite imagery with surface observations overlain. Use the Northeast<br />
United States as the map background.<br />
Click on the satellite and radar icon (ICON 1).<br />
Select GOES8 (this is actually GOES12 data), 4 km, and VIS.<br />
Click and hold the left mouse button on 20091022/1315 and drag down to the most recent time.<br />
There should be about 7 forecast times highlighted.<br />
Click the “Display and Close” button. You should see a series of satellite images plotted on the<br />
screen.<br />
Since we want to display surface observations taken around the same time the satellite pictures<br />
were, we should use the “Time Matching” feature of GARP. In the Time menu, select Time<br />
Matching, and then select Closest Time Match.<br />
To overlay the surface obs, select ICON 2. Click Multicolor. Notice that the proper times are<br />
already selected to match the satellite.