AOS 452 Lab 1: UNIX and the WEATHER program - Marrella
AOS 452 Lab 1: UNIX and the WEATHER program - Marrella
AOS 452 Lab 1: UNIX and the WEATHER program - Marrella

You also want an ePaper? Increase the reach of your titles
YUMPU automatically turns print PDFs into web optimized ePapers that Google loves.
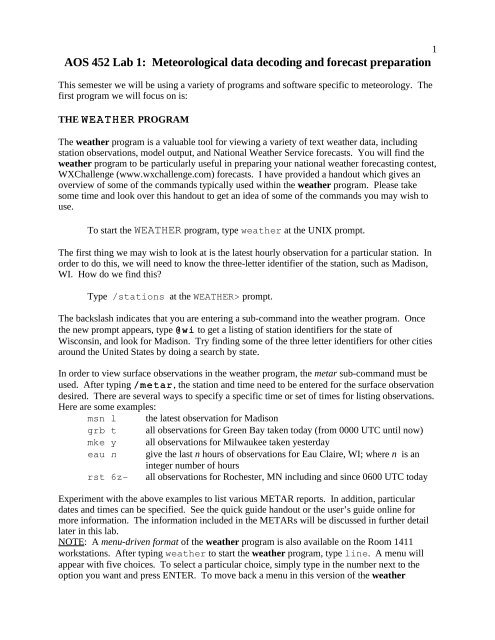
1<strong>AOS</strong> <strong>452</strong> <strong>Lab</strong> 1: Meteorological data decoding <strong>and</strong> forecast preparationThis semester we will be using a variety of <strong>program</strong>s <strong>and</strong> software specific to meteorology. Thefirst <strong>program</strong> we will focus on is:THE <strong>WEATHER</strong> PROGRAMThe wea<strong>the</strong>r <strong>program</strong> is a valuable tool for viewing a variety of text wea<strong>the</strong>r data, includingstation observations, model output, <strong>and</strong> National Wea<strong>the</strong>r Service forecasts. You will find <strong>the</strong>wea<strong>the</strong>r <strong>program</strong> to be particularly useful in preparing your national wea<strong>the</strong>r forecasting contest,WXChallenge (www.wxchallenge.com) forecasts. I have provided a h<strong>and</strong>out which gives anoverview of some of <strong>the</strong> comm<strong>and</strong>s typically used within <strong>the</strong> wea<strong>the</strong>r <strong>program</strong>. Please takesome time <strong>and</strong> look over this h<strong>and</strong>out to get an idea of some of <strong>the</strong> comm<strong>and</strong>s you may wish touse.To start <strong>the</strong> <strong>WEATHER</strong> <strong>program</strong>, type wea<strong>the</strong>r at <strong>the</strong> <strong>UNIX</strong> prompt.The first thing we may wish to look at is <strong>the</strong> latest hourly observation for a particular station. Inorder to do this, we will need to know <strong>the</strong> three-letter identifier of <strong>the</strong> station, such as Madison,WI. How do we find this?Type /stations at <strong>the</strong> <strong>WEATHER</strong>> prompt.The backslash indicates that you are entering a sub-comm<strong>and</strong> into <strong>the</strong> wea<strong>the</strong>r <strong>program</strong>. Once<strong>the</strong> new prompt appears, type @wi to get a listing of station identifiers for <strong>the</strong> state ofWisconsin, <strong>and</strong> look for Madison. Try finding some of <strong>the</strong> three letter identifiers for o<strong>the</strong>r citiesaround <strong>the</strong> United States by doing a search by state.In order to view surface observations in <strong>the</strong> wea<strong>the</strong>r <strong>program</strong>, <strong>the</strong> metar sub-comm<strong>and</strong> must beused. After typing /metar, <strong>the</strong> station <strong>and</strong> time need to be entered for <strong>the</strong> surface observationdesired. There are several ways to specify a specific time or set of times for listing observations.Here are some examples:msn l <strong>the</strong> latest observation for Madisongrb t all observations for Green Bay taken today (from 0000 UTC until now)mke y all observations for Milwaukee taken yesterdayeau n give <strong>the</strong> last n hours of observations for Eau Claire, WI; where n is aninteger number of hoursrst 6z all observations for Rochester, MN including <strong>and</strong> since 0600 UTC todayExperiment with <strong>the</strong> above examples to list various METAR reports. In addition, particulardates <strong>and</strong> times can be specified. See <strong>the</strong> quick guide h<strong>and</strong>out or <strong>the</strong> user’s guide online formore information. The information included in <strong>the</strong> METARs will be discussed in fur<strong>the</strong>r detaillater in this lab.NOTE: A menu-driven format of <strong>the</strong> wea<strong>the</strong>r <strong>program</strong> is also available on <strong>the</strong> Room 1411workstations. After typing wea<strong>the</strong>r to start <strong>the</strong> wea<strong>the</strong>r <strong>program</strong>, type line. A menu willappear with five choices. To select a particular choice, simply type in <strong>the</strong> number next to <strong>the</strong>option you want <strong>and</strong> press ENTER. To move back a menu in this version of <strong>the</strong> wea<strong>the</strong>r
2<strong>program</strong>, press ENTER without entering any characters. Some of you may prefer this version of<strong>the</strong> wea<strong>the</strong>r <strong>program</strong> compared to <strong>the</strong> version discussed earlier.DECODING METARs (SURFACE OBSERVATIONS)MEteorological Terminal Air Report (roughly translated from French) or METAR is aninternational st<strong>and</strong>ard code format for hourly surface wea<strong>the</strong>r observations. All of thisinformation is reported hourly from surface stations around <strong>the</strong> world, typically taken within 10minutes before <strong>the</strong> top of <strong>the</strong> hour. For example, <strong>the</strong> 1300 UTC observation may be taken at1253 UTC. So, when looking for a particular hourly observation, you need to look for <strong>the</strong>observation taken between **50 <strong>and</strong> **00. However, special observations are taken at any timeif wea<strong>the</strong>r conditions that may be important to pilots change, such as visibility, fallingprecipitation or cloud cover.St<strong>and</strong>ards have been set in order to distribute all of this information in a compact format. A keyto decoding METARs has been provided in a h<strong>and</strong>out. The following is an example of aMETAR <strong>and</strong> a brief explanation of <strong>the</strong> information each group contains:What exactly do <strong>the</strong> group numbers mean:1 Group: The 6-hour maximum temperature, precise to convert to nearest degree Fahrenheit.2 Group: The 6-hour minimum temperature, precise to convert to nearest degree Fahrenheit.4 Group: The maximum <strong>and</strong> minimum temperature of <strong>the</strong> last 24-hours.5 Group: Pressure tendency information. See h<strong>and</strong>out for more information.6 Group: Precipitation measured in last 6 hours. 60000 indicated a trace amount. This grouponly appears on <strong>the</strong> 00, 06, 12, 18Z observations.7 Group: Precipitation measured in last 24 hours. Typically appears only on <strong>the</strong> 12Zobservation.Most of <strong>the</strong> time, this is what <strong>the</strong> group numbers mean. There are exceptions, such as when yousee 4/ for snow depth.Below is a table of <strong>the</strong> information described by <strong>the</strong> second character of <strong>the</strong> “5” group:Table: Characteristics of Barometer TendencyPrimaryRequirementAtmosphericpressure nowhigher than 3hours ago.DescriptionCodeFigureIncreasing, <strong>the</strong>n decreasing 0Increasing, <strong>the</strong>n steady, or increasing <strong>the</strong>n increasing more slowly. 1Increasing steadily or unsteadily. 2Decreasing or steady, <strong>the</strong>n increasing; or increasing, <strong>the</strong>n increasing more rapidly. 3
Atmosphericpressure nowsame as 3 hoursago.Atmosphericpressure nowlower than 3hours ago.Increasing, <strong>the</strong>n decreasing 0Steady 4Decreasing, <strong>the</strong>n increasing. 5Decreasing, <strong>the</strong>n increasing. 5Decreasing <strong>the</strong>n steady; or decreasing <strong>the</strong>n decreasing more slowly. 6Decreasing steadily or unsteadily. 7Steady or increasing, <strong>the</strong>n decreasing; or decreasing <strong>the</strong>n decreasing more rapidly. 83Precipitation Type Help, sometimes followed by begin <strong>and</strong> end times:QUALIFIER<strong>WEATHER</strong> PHENOMENAINTENSITY ORPROXIMITY1 LightModerate(see note 2)+ HeavyVC In <strong>the</strong>Vicinity(see note 3)DESCRIPTOR2MI ShallowPR PartialBC PatchesDR LowDriftingBL BlowingSH Shower(s)TSThunderstormFZ FreezingPRECIPITATIONDZ DrizzleRA RainSN SnowSG Snow GrainsIC Ice CrystalsPE Ice PelletsGR HailGS Small Hail<strong>and</strong>/or SnowPelletsUP UnknownPrecipitation3OBSCURATION4BR MistFG FogFU SmokeVA Volcanic AshDU WidespreadDustSA S<strong>and</strong>HZ HazePY SprayOTHER5PO WellDevelopedDust/S<strong>and</strong>WhirlsSQ SquallsFC Funnel CloudTornadoWaterspout(see note 4)SS S<strong>and</strong>stormSS DuststormCloud Type <strong>and</strong> Base Height:Cloud base is reported hundreds of feet. If Towering CUmulus or CumulonumBus arereported TCU or CB will be reported.Cloud cover is based on coverage in terms of octas of <strong>the</strong> sky.SKC Sky clearCLR Sky clear below 12,000 feetFEW 1-2 octas obscured by cloudsSCT 3-4 octas obscured by cloudsBKN 5-7 octas obscured by cloudsOVC 8 octas obscured by cloudsKMSN 190553Z 25003KT 10SM OVC060 17/14 A2992 RMKAO2 RAB06E53 SLP130 P001 60001 T01670139 1020620161 402500100 56002Follow along with each piece of information as this METAR observation is decoded:Location: KMSN (Madison, WI)Time/Date:0600 (0553) UTC on <strong>the</strong> 19 th of <strong>the</strong> month.Wind (direction/speed): 250 degrees (or west-southwest) at 3 knots.Visibility:10 (statute) miles.
Sky cover:Overcast, cloud base height at 6,000 feetTemperature:17 degrees CelsiusDew point temperature:14 degrees CelsiusAltimeter reading:29.92 inches of mercury.---RMK: Remark Section ----Station Type:AO2 (type of automated station)Precipitation Type:RainBegin time:06 minutes past <strong>the</strong> hour (at 0506 UTC)End time:53 minutes past <strong>the</strong> hour (at 0553 UTC)Sea Level Pressure:1013.0 mbRecorded Precip this hour/last 6 hours:.01 inches/.01 inchesPrecise temperature: 16.7 degrees CelsiusPrecise dew pt. temperature: 13.9 degrees CelsiusMaximum temperature in <strong>the</strong> previous 6 hours: 20.6 degrees CelsiusMinimum temperature in <strong>the</strong> previous 6 hours: 16.1 degrees Celsius.Maximum (minimum) temperature for <strong>the</strong> 24-hour period: 25.0 (10.0) degrees Celsius.Pressure tendency:decreasing, <strong>the</strong>n became steady.Pressure change in last 3 hours: fell 0.2 mb4If you want a more in-depth look at METAR decoding, visit <strong>the</strong> following URL:http://www.met.tamu.edu/class/METAR/metar.html.The official guide to METAR code is chapter 12 of Federal Meteorological H<strong>and</strong>book No. 1,which can be found online at http://www.mrx.net/wea<strong>the</strong>r/fmh1/fmh1ch12.htm.STATION MODELSMeteorologists need a way to get <strong>the</strong> detailed information collected into <strong>the</strong> smallest areapossible on a wea<strong>the</strong>r map so that several stations can be plotted for <strong>the</strong> same observation timeon <strong>the</strong> same map, thus giving <strong>the</strong> "big picture" of what <strong>the</strong> wea<strong>the</strong>r is doing at a particularmoment in time. Wea<strong>the</strong>r conditions observed at a particular location are best represented on amap using station models. Most station models depict <strong>the</strong> same important observations found inMETARs. It will be to your benefit to become familiar with station models as you will see <strong>the</strong>min map discussions <strong>and</strong> case study projects. If you not familiar with station models or just need arefresher, take a look through <strong>the</strong> h<strong>and</strong>out passed out during class as well as <strong>the</strong> following websites:http://cimss.ssec.wisc.edu/wxwise/station/-- Guide on surface station modelshttp://ww2010.atmos.uiuc.edu/(Gh)/guides/maps/sfcobs/home.rxml-- Ano<strong>the</strong>r guide on surface station modelshttp://ww2010.atmos.uiuc.edu/(Gh)/guides/maps/upa/home.rxml-- Guide on upper air station models454039-13-2554250-40
5Surface Station ModelUpper Air Station ModelDECODING NWP MODEL OUTPUTIn addition to surface observations, <strong>the</strong> wea<strong>the</strong>r <strong>program</strong> is a useful way to accessnumerical wea<strong>the</strong>r prediction (NWP) model output. Many of you likely are familiar with someof <strong>the</strong> operational models such as <strong>the</strong> North American Mesoscale (NAM, formerly <strong>the</strong> Eta), <strong>the</strong>Global Forecast System (GFS; a combination of <strong>the</strong> old Aviation [AVN] <strong>and</strong> Medium RangeForecast [MRF] models).The output from <strong>the</strong>se models can be useful in providing guidance while preparing aforecast. However, one must be extremely careful not to follow model guidance blindly, asthat could certainly lead to poor forecasts. (Keep this in mind for <strong>the</strong> forecast contest!)There are three types of model output you will learn to decode:– FOUS (raw model output data)– EXT (extended model output data)– MOS (model output statistics)H<strong>and</strong>outs have been provided to help you in decoding each type of data. Most model data areavailable in 12-hour increments (at 0000 UTC <strong>and</strong> 1200 UTC), <strong>and</strong> some of <strong>the</strong> model data arenow available in more frequent time increments (such as six hours for <strong>the</strong> GFS model <strong>and</strong> hourlyfor <strong>the</strong> RUC [Rapid Update Cycle] model).FOUSOne form of coded model data is FOUS (Forecast Output United States). This product takesforecast information directly from <strong>the</strong> model output <strong>and</strong> displays <strong>the</strong> information in a compactmanner. The forecasts are provided in six-hourly intervals from 6 to 48 hours after ei<strong>the</strong>r 0000or 1200 UTC. Information given includes six-hour accumulated precipitation, relative humidity,vertical velocity, lifted index, sea level pressure, direction <strong>and</strong> speed of <strong>the</strong> mean wind in <strong>the</strong>boundary layer, 1000 to 500 hPa thickness, <strong>and</strong> three model-layer temperatures. FOUS isgenerally found to be most useful in precipitation forecasting. The general format for <strong>the</strong> rawdata can be found below, <strong>and</strong> a sample can be found in a separate h<strong>and</strong>out.The general format:------------------FOXXII KWBC DDTTTTTTPTT R1R2R3 VVVLI PSDDFF HHT1T3T5----------------------------------NNN// R1R2R3 VVVLI PSDDFF HHT1T3T506PTT R1R2R3 VVVLI PSDDFF HHT1T3T512PTT R1R2R3 VVVLI PSDDFF HHT1T3T518PTT R1R2R3 VVVLI PSDDFF HHT1T3T5
624PTT R1R2R3 VVVLI PSDDFF HHT1T3T530PTT R1R2R3 VVVLI PSDDFF HHT1T3T536PTT R1R2R3 VVVLI PSDDFF HHT1T3T542PTT R1R2R3 VVVLI PSDDFF HHT1T3T5CODE EXPLANATION===== ==================XX Region identifier.II Station group number.DD Day of <strong>the</strong> month forecast was issued.TTTT Greenwich time of forecast cycle on which <strong>the</strong> data is based.NNN Forecast station three letter identifier.PTT 6 hour accumulated precipitation in hundredths of inches.R1 Mean relative humidity of <strong>the</strong> lowest model layer (lowest 35mb), in percent.R2 Mean relative humidity of model layers 2 through 9 (up to 500mb), in percent.R3 Mean relative humidity of model layers 10 through 13 (500 to200 mb), in percent.VVV Vertical velocity at 700 mb, in tenths of a microbar persecond, weighted average of three hourly values at forecasttime, one hour before, <strong>and</strong> one hour after (double weightedat forecast time). Minus sign represents downward motion.LI Lifted index in degrees Celsius. Negative values are designatedby subtracting from 100; e.g. -4= 96. Taken from <strong>the</strong> lowest(most unstable) of four possible values. The values derivedfrom lifting parcels from <strong>the</strong> four lowest model layers upto 500 mb.PS Sea level pressure calculated from lowest sigma level (based on<strong>the</strong> contour base map).DD Direction in tens of degrees of <strong>the</strong> mean wind in <strong>the</strong> lowest modellayer (35 mb).FF Wind speed in knots of <strong>the</strong> lowest model layer (lowest 35 mb).HH 1000-500 mb thickness in decameters with <strong>the</strong> first digit omitted.T1 Temperature in model layer 1 (lowest 35 mb) in degrees Celsius.T3 Temperature in model layer 3 (approximately 900 mb).T5 Temperature in model layer 5 (approximately 800 mb).FOUS data are available from <strong>the</strong> Eta for a select number of cities in <strong>the</strong> United States. The subcomm<strong>and</strong>sin <strong>the</strong> wea<strong>the</strong>r <strong>program</strong> for <strong>the</strong>se products is /eta.EXTThe extended model data (EXT) format is similar to FOUS data, but is shown in an easy to read,tabular format. Here is a sample (for Madison, WI at 1200 UTC 8 September 2008):EXTETA> msn lStation: MSN Lat: 43.13 Lon: -89.35 Elev: 261 Closest grid pt: 18.7 km.Initialization Time: 08-09-08 1200 UTCPARAMETER/TIME 000 006 012 018 024 030 036 042 048------------------- ------ ------ ------ ------ ------ ------ ------ ------ ------DAY / HOUR 08/12 08/18 09/00 09/06 09/12 09/18 10/00 10/06 10/12------------------- ------ ------ ------ ------ ------ ------ ------ ------ ------TEMPS2 M (F) 49 59 57 45 40 67 64 50 46850 MB (C) 7 4 5 5 4 5 7 7 6700 MB (C) -2 -3 -3 -6 -5 -2 -1 1 2500 MB (C) -15 -13 -16 -20 -14 -14 -11 -12 -11
1000-500 THCK 554 553 552 547 549 554 557 557 5587MOISTURE2 M DEW POINT (F) 48 49 49 42 37 40 40 38 38850 MB DP(C)/RH -3/50 1/79 1/74 -1/65 -2/63 0/68 0/62 -2/55 -5/45700 MB DP(C)/RH -9/59 -3/94 -5/84 -15/52 -18/37 -23/18 -24/15 -23/16 -23/14500 MB DP(C)/RH -19/72 -13/98 -19/76 -51/04 -42/08 -23/47 -26/27 -27/27 -33/15PRCPABLE WTR (IN)CONV PRECIP (IN) 0.00 0.00 0.00 0.00 0.00 0.00 0.00 0.00TOTAL PRECIP (IN) 0.10 0.11 0.00 0.00 0.00 0.00 0.00 0.00WIND DD/FFF (Kts)10 M 29/006 29/005 27/006 27/008 29/005 33/007 18/003 16/005 15/004850 MB 28/014 30/010 32/016 32/020 32/017 33/008 25/002 16/006 15/014700 MB 27/033 25/030 27/027 30/018 30/022 31/023 33/017 25/008 27/016500 MB 26/051 25/066 25/073 27/049 30/068 29/054 28/048 29/034 28/027250 MB 27/106 24/096 24/100 26/083 30/083 29/077 29/060 28/040 27/035PRESS/HEIGHTSMSL PRESSURE 1020.7 1020.5 1017.1 1019.2 1020.9 1021.1 1020.0 1022.2 1024.1850 MB HGT 152 152 150 151 152 154 154 155 155700 MB HGT 309 308 305 306 307 309 310 312 313500 MB HGT 571 570 566 563 566 571 574 576 578250 MB HGT 1060 1062 1054 1048 1055 1062 1066 1068 1069VERTICAL VEL (uB/S)850 MB -21 -52 -44 -12 -8 -10 28 -23 4700 MB -10 -17 -37 -18 -20 -38 -14 -5 3500 MB -3 117 56 -3 -49 -21 -25 8 -4CONVECTION PARAMSLIFT INX SFCLIFT INX 4LYRCAPE SFC 0 31 44 12 0 0 0 0 0CAPE 4LYRCIN SFC 2 -6 -5 -40 -1 0 0 1 -1CIN 4LYRHELICITY (0-3 KM) 135 17 -65 23 49 27 17 46 82As you can see, <strong>the</strong> extended data are easy to decode. Note that <strong>the</strong> precipitation numbers willinclude only <strong>the</strong> precipitation that is forecast to fall in <strong>the</strong> forecast increment (for this example,<strong>the</strong> 6 hour period) just like FOUS. Also note that for <strong>the</strong> wind forecast, <strong>the</strong> direction is givenfirst (simply add a zero to get <strong>the</strong> direction from which <strong>the</strong> wind is forecast to come), <strong>and</strong> <strong>the</strong>speed is given second in knots. If you should have any more questions regarding <strong>the</strong> extendedmodel output, feel free to ask.MOSExample sub-comm<strong>and</strong>s in <strong>the</strong> wea<strong>the</strong>r <strong>program</strong> for <strong>the</strong>se products include/extavn, /extngm, <strong>and</strong> /exteta.Ano<strong>the</strong>r form of coded meteorological data found in <strong>the</strong> wea<strong>the</strong>r <strong>program</strong> is model outputstatistics, or MOS. The MOS products are a bit different than <strong>the</strong> aforementioned modelproducts, as <strong>the</strong>y take into account past model performance, model biases, <strong>and</strong> o<strong>the</strong>r modelstatistics. The MOS output includes forecasts for three- <strong>and</strong>/or six-hourly temperature <strong>and</strong> dewpoint temperature, maximum <strong>and</strong> minimum temperature, cloud cover, surface wind, precipitationprobability, visibility, <strong>and</strong> sometimes a variety of o<strong>the</strong>r products. The MRF MOS numbers areavailable once daily (0000 UTC), <strong>the</strong> NGM <strong>and</strong> Eta MOS numbers are available twice daily
(0000 <strong>and</strong> 1200 UTC), <strong>and</strong> <strong>the</strong> AVN MOS numbers are available four times daily (0000, 0600,1200, <strong>and</strong> 1800 UTC).A sample MOS product from <strong>the</strong> Eta is given below:KMSN ETA MOS GUIDANCE 9/08/2008 1200 UTCDT /SEPT 8/SEPT 9 /SEPT 10 /SEPT 11HR 18 21 00 03 06 09 12 15 18 21 00 03 06 09 12 15 18 21 00 06 12N/X 41 67 44 71 55TMP 56 56 53 49 44 43 43 57 64 65 61 53 48 46 47 61 67 69 65 59 58DPT 48 47 47 45 41 40 40 44 43 43 45 46 45 44 45 50 50 50 52 53 54CLD OV OV OV SC CL CL CL CL SC SC CL CL CL CL CL SC SC SC BK SC OVWDR 25 24 29 28 27 28 29 30 31 28 14 16 16 13 12 14 16 16 15 15 17WSP 05 04 03 03 03 02 02 05 06 05 03 02 02 02 03 08 10 11 07 09 06P06 86 22 5 1 1 3 2 5 7 14 20P12 28 1 6 7 28Q06 3 0 0 0 0 0 0 0 0 0 0Q12 0 0 0 0 0T06 21/ 0 2/ 0 2/ 0 0/ 0 0/ 0 0/ 0 0/ 0 0/ 0 0/ 0999/99T12 21/ 0 2/ 0 0/ 0 0/ 0 999/99SNW 0 0 0CIG 6 5 6 8 8 8 8 8 8 8 8 8 8 8 8 8 8 8 8 8 6VIS 7 7 7 7 7 7 7 7 7 7 7 7 7 7 7 7 7 7 7 7 5OBV N N N N N N N N N N N N N N N N N N N N HZA h<strong>and</strong>out has been provided with information to decode <strong>the</strong> MOS product. Much of <strong>the</strong>information is self-explanatory (e.g., temperature, dew point, etc.). The values in a certaincolumn represent <strong>the</strong> statistically derived forecast values at that time for a specific variable.The sub-comm<strong>and</strong>s in <strong>the</strong> wea<strong>the</strong>r <strong>program</strong> for <strong>the</strong>se products are/ngmmos, /newavnmos, /mrfmos, <strong>and</strong> /etamos.8Blindly following what <strong>the</strong> model statistics show will lead to large forecast errors, so do not getin <strong>the</strong> habit of “MOScasting”. If you have thoroughly analyzed <strong>the</strong> wea<strong>the</strong>r situation <strong>and</strong> cameup with temperatures <strong>and</strong> precipitation values similar to <strong>the</strong> model output, you may have a higherdegree of confidence in your forecast.Note that getting each type of output for a particular station is <strong>the</strong> same as for getting surfaceobservations. First you type <strong>the</strong> subcomm<strong>and</strong> for <strong>the</strong> product that you wish to view, <strong>the</strong>n get <strong>the</strong>data using <strong>the</strong> same format as before:msn 12z -- get <strong>the</strong> most current 1200 UTC product for Madison, WImke l -- get <strong>the</strong> latest product for Milwaukee, WINational Wea<strong>the</strong>r Service data is also available through <strong>the</strong> wea<strong>the</strong>r <strong>program</strong>. Forecastdiscussions (/FOREDISS), as well as quick forecasts are readily available (/FP4).Forecast Discussions
9To read <strong>the</strong> NWS forecast discussions from a state, such as Wisconsin, go to <strong>the</strong> /FOREDISSsubcomm<strong>and</strong> <strong>and</strong> type @wi l. This is probably <strong>the</strong> easiest way to see a forecast discussion for aregion since <strong>the</strong> discussions are only made by local NWS offices.FP4In addition to model guidance, <strong>the</strong> National Wea<strong>the</strong>r Service issues numerical forecasts forspecific stations twice daily. Included are <strong>the</strong> day one to three temperature forecasts <strong>and</strong>precipitation probabilities.The sub-comm<strong>and</strong> in <strong>the</strong> wea<strong>the</strong>r <strong>program</strong> for this product is /fp4.The fp4 product appears as follows from <strong>the</strong> wea<strong>the</strong>r <strong>program</strong>:dd/hhmm ppp wW tt1/tt2 tt3/tt4 tt5 ffPPPdd = dayhhmm = hour <strong>and</strong> minute issuedppp = placewW = day1 <strong>and</strong> day2 wea<strong>the</strong>r typettn = temperature (day1 maximum, day1 minimum, etc...)ff = forecaster id numberPPP = 12 hour period probability of precipitation in tens of percentThe following is an actual sample:06/0926 FTW BT 077/058 082/064 077 10137Here is <strong>the</strong> fp4 forecast decoded:Forecast station:Fort Worth, TexasDate/Time:6th of <strong>the</strong> month at 0926 UTC.Today's Wea<strong>the</strong>r: Partly cloudy (B).Tomorrow's Wea<strong>the</strong>r: Thundershowers (T).Today: forecast hight: 77 F forecast low: 58FTomorrow: forecast high: 82F forecast low: 64 FDay 2: forecast high: 77FForecaster 10 prepared this FP4.Precipitation probabilities are: 10% for today, 30% tonight <strong>and</strong> 70% tomorrow.Forecast Discussions can be found using <strong>the</strong> /forediss subcomm<strong>and</strong>. NWS forecastdiscussion are issued by local NWS offices. The easiest find <strong>the</strong> discussion for a region is tosearch by state or if you know <strong>the</strong> three-letter station office code you can enter that as well.@wi lmkx lThis will give you <strong>the</strong> latest discussion for any region of Wisconsin.This will give you <strong>the</strong> latest discussion from MKX, <strong>the</strong> forecast office inMilwaukee, WI