AOS 452 Lab 1: UNIX and the WEATHER program - Marrella
AOS 452 Lab 1: UNIX and the WEATHER program - Marrella
AOS 452 Lab 1: UNIX and the WEATHER program - Marrella

You also want an ePaper? Increase the reach of your titles
YUMPU automatically turns print PDFs into web optimized ePapers that Google loves.
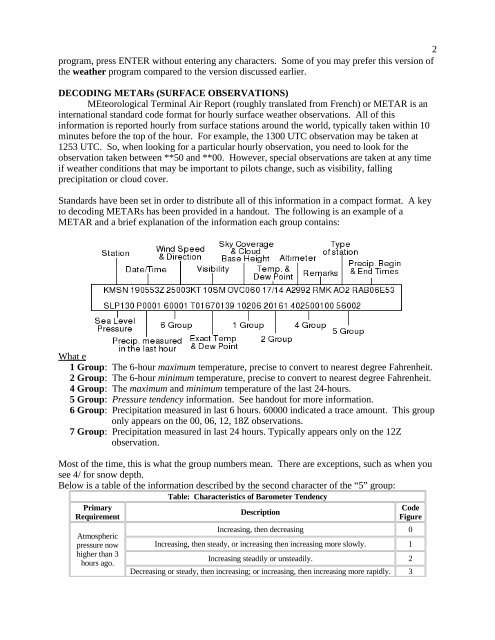
2<strong>program</strong>, press ENTER without entering any characters. Some of you may prefer this version of<strong>the</strong> wea<strong>the</strong>r <strong>program</strong> compared to <strong>the</strong> version discussed earlier.DECODING METARs (SURFACE OBSERVATIONS)MEteorological Terminal Air Report (roughly translated from French) or METAR is aninternational st<strong>and</strong>ard code format for hourly surface wea<strong>the</strong>r observations. All of thisinformation is reported hourly from surface stations around <strong>the</strong> world, typically taken within 10minutes before <strong>the</strong> top of <strong>the</strong> hour. For example, <strong>the</strong> 1300 UTC observation may be taken at1253 UTC. So, when looking for a particular hourly observation, you need to look for <strong>the</strong>observation taken between **50 <strong>and</strong> **00. However, special observations are taken at any timeif wea<strong>the</strong>r conditions that may be important to pilots change, such as visibility, fallingprecipitation or cloud cover.St<strong>and</strong>ards have been set in order to distribute all of this information in a compact format. A keyto decoding METARs has been provided in a h<strong>and</strong>out. The following is an example of aMETAR <strong>and</strong> a brief explanation of <strong>the</strong> information each group contains:What exactly do <strong>the</strong> group numbers mean:1 Group: The 6-hour maximum temperature, precise to convert to nearest degree Fahrenheit.2 Group: The 6-hour minimum temperature, precise to convert to nearest degree Fahrenheit.4 Group: The maximum <strong>and</strong> minimum temperature of <strong>the</strong> last 24-hours.5 Group: Pressure tendency information. See h<strong>and</strong>out for more information.6 Group: Precipitation measured in last 6 hours. 60000 indicated a trace amount. This grouponly appears on <strong>the</strong> 00, 06, 12, 18Z observations.7 Group: Precipitation measured in last 24 hours. Typically appears only on <strong>the</strong> 12Zobservation.Most of <strong>the</strong> time, this is what <strong>the</strong> group numbers mean. There are exceptions, such as when yousee 4/ for snow depth.Below is a table of <strong>the</strong> information described by <strong>the</strong> second character of <strong>the</strong> “5” group:Table: Characteristics of Barometer TendencyPrimaryRequirementAtmosphericpressure nowhigher than 3hours ago.DescriptionCodeFigureIncreasing, <strong>the</strong>n decreasing 0Increasing, <strong>the</strong>n steady, or increasing <strong>the</strong>n increasing more slowly. 1Increasing steadily or unsteadily. 2Decreasing or steady, <strong>the</strong>n increasing; or increasing, <strong>the</strong>n increasing more rapidly. 3