AOS 452 Lab 1: UNIX and the WEATHER program - Marrella
AOS 452 Lab 1: UNIX and the WEATHER program - Marrella
AOS 452 Lab 1: UNIX and the WEATHER program - Marrella

Create successful ePaper yourself
Turn your PDF publications into a flip-book with our unique Google optimized e-Paper software.
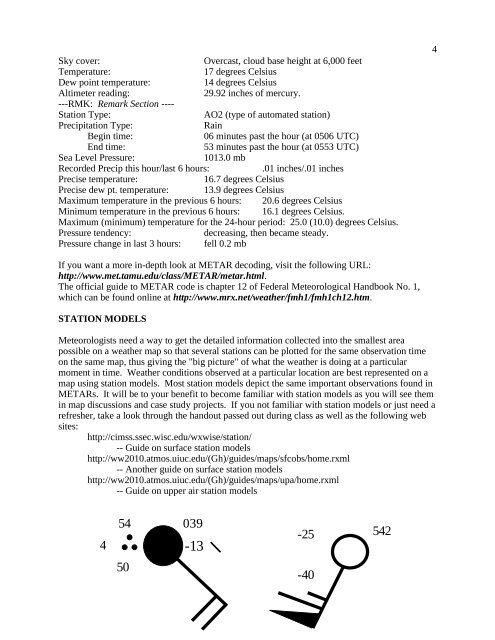
Sky cover:Overcast, cloud base height at 6,000 feetTemperature:17 degrees CelsiusDew point temperature:14 degrees CelsiusAltimeter reading:29.92 inches of mercury.---RMK: Remark Section ----Station Type:AO2 (type of automated station)Precipitation Type:RainBegin time:06 minutes past <strong>the</strong> hour (at 0506 UTC)End time:53 minutes past <strong>the</strong> hour (at 0553 UTC)Sea Level Pressure:1013.0 mbRecorded Precip this hour/last 6 hours:.01 inches/.01 inchesPrecise temperature: 16.7 degrees CelsiusPrecise dew pt. temperature: 13.9 degrees CelsiusMaximum temperature in <strong>the</strong> previous 6 hours: 20.6 degrees CelsiusMinimum temperature in <strong>the</strong> previous 6 hours: 16.1 degrees Celsius.Maximum (minimum) temperature for <strong>the</strong> 24-hour period: 25.0 (10.0) degrees Celsius.Pressure tendency:decreasing, <strong>the</strong>n became steady.Pressure change in last 3 hours: fell 0.2 mb4If you want a more in-depth look at METAR decoding, visit <strong>the</strong> following URL:http://www.met.tamu.edu/class/METAR/metar.html.The official guide to METAR code is chapter 12 of Federal Meteorological H<strong>and</strong>book No. 1,which can be found online at http://www.mrx.net/wea<strong>the</strong>r/fmh1/fmh1ch12.htm.STATION MODELSMeteorologists need a way to get <strong>the</strong> detailed information collected into <strong>the</strong> smallest areapossible on a wea<strong>the</strong>r map so that several stations can be plotted for <strong>the</strong> same observation timeon <strong>the</strong> same map, thus giving <strong>the</strong> "big picture" of what <strong>the</strong> wea<strong>the</strong>r is doing at a particularmoment in time. Wea<strong>the</strong>r conditions observed at a particular location are best represented on amap using station models. Most station models depict <strong>the</strong> same important observations found inMETARs. It will be to your benefit to become familiar with station models as you will see <strong>the</strong>min map discussions <strong>and</strong> case study projects. If you not familiar with station models or just need arefresher, take a look through <strong>the</strong> h<strong>and</strong>out passed out during class as well as <strong>the</strong> following websites:http://cimss.ssec.wisc.edu/wxwise/station/-- Guide on surface station modelshttp://ww2010.atmos.uiuc.edu/(Gh)/guides/maps/sfcobs/home.rxml-- Ano<strong>the</strong>r guide on surface station modelshttp://ww2010.atmos.uiuc.edu/(Gh)/guides/maps/upa/home.rxml-- Guide on upper air station models454039-13-2554250-40