AOS 452 Lab 1: UNIX and the WEATHER program - Marrella
AOS 452 Lab 1: UNIX and the WEATHER program - Marrella
AOS 452 Lab 1: UNIX and the WEATHER program - Marrella

You also want an ePaper? Increase the reach of your titles
YUMPU automatically turns print PDFs into web optimized ePapers that Google loves.
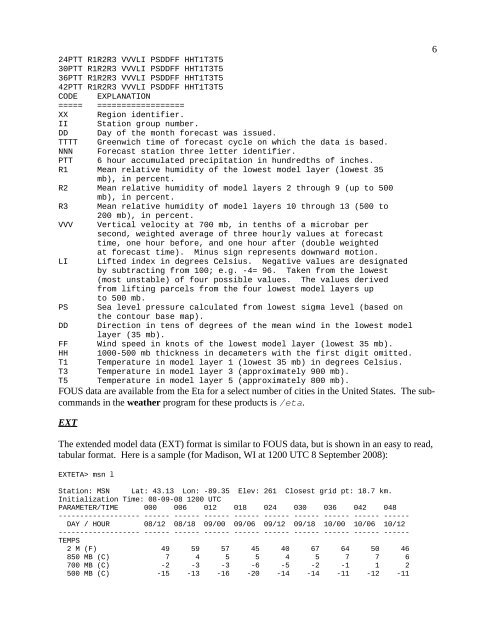
624PTT R1R2R3 VVVLI PSDDFF HHT1T3T530PTT R1R2R3 VVVLI PSDDFF HHT1T3T536PTT R1R2R3 VVVLI PSDDFF HHT1T3T542PTT R1R2R3 VVVLI PSDDFF HHT1T3T5CODE EXPLANATION===== ==================XX Region identifier.II Station group number.DD Day of <strong>the</strong> month forecast was issued.TTTT Greenwich time of forecast cycle on which <strong>the</strong> data is based.NNN Forecast station three letter identifier.PTT 6 hour accumulated precipitation in hundredths of inches.R1 Mean relative humidity of <strong>the</strong> lowest model layer (lowest 35mb), in percent.R2 Mean relative humidity of model layers 2 through 9 (up to 500mb), in percent.R3 Mean relative humidity of model layers 10 through 13 (500 to200 mb), in percent.VVV Vertical velocity at 700 mb, in tenths of a microbar persecond, weighted average of three hourly values at forecasttime, one hour before, <strong>and</strong> one hour after (double weightedat forecast time). Minus sign represents downward motion.LI Lifted index in degrees Celsius. Negative values are designatedby subtracting from 100; e.g. -4= 96. Taken from <strong>the</strong> lowest(most unstable) of four possible values. The values derivedfrom lifting parcels from <strong>the</strong> four lowest model layers upto 500 mb.PS Sea level pressure calculated from lowest sigma level (based on<strong>the</strong> contour base map).DD Direction in tens of degrees of <strong>the</strong> mean wind in <strong>the</strong> lowest modellayer (35 mb).FF Wind speed in knots of <strong>the</strong> lowest model layer (lowest 35 mb).HH 1000-500 mb thickness in decameters with <strong>the</strong> first digit omitted.T1 Temperature in model layer 1 (lowest 35 mb) in degrees Celsius.T3 Temperature in model layer 3 (approximately 900 mb).T5 Temperature in model layer 5 (approximately 800 mb).FOUS data are available from <strong>the</strong> Eta for a select number of cities in <strong>the</strong> United States. The subcomm<strong>and</strong>sin <strong>the</strong> wea<strong>the</strong>r <strong>program</strong> for <strong>the</strong>se products is /eta.EXTThe extended model data (EXT) format is similar to FOUS data, but is shown in an easy to read,tabular format. Here is a sample (for Madison, WI at 1200 UTC 8 September 2008):EXTETA> msn lStation: MSN Lat: 43.13 Lon: -89.35 Elev: 261 Closest grid pt: 18.7 km.Initialization Time: 08-09-08 1200 UTCPARAMETER/TIME 000 006 012 018 024 030 036 042 048------------------- ------ ------ ------ ------ ------ ------ ------ ------ ------DAY / HOUR 08/12 08/18 09/00 09/06 09/12 09/18 10/00 10/06 10/12------------------- ------ ------ ------ ------ ------ ------ ------ ------ ------TEMPS2 M (F) 49 59 57 45 40 67 64 50 46850 MB (C) 7 4 5 5 4 5 7 7 6700 MB (C) -2 -3 -3 -6 -5 -2 -1 1 2500 MB (C) -15 -13 -16 -20 -14 -14 -11 -12 -11