Emmett/Gem County Community Review Report Summary
Emmett/Gem County Community Review Report Summary
Emmett/Gem County Community Review Report Summary

Create successful ePaper yourself
Turn your PDF publications into a flip-book with our unique Google optimized e-Paper software.
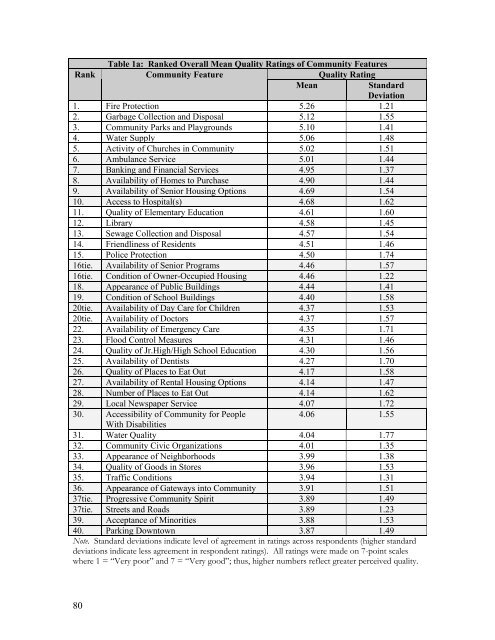
Rank<br />
Table 1a: Ranked Overall Mean Quality Ratings of <strong>Community</strong> Features<br />
<strong>Community</strong> Feature<br />
Quality Rating<br />
Mean<br />
Standard<br />
Deviation<br />
1. Fire Protection 5.26 1.21<br />
2. Garbage Collection and Disposal 5.12 1.55<br />
3. <strong>Community</strong> Parks and Playgrounds 5.10 1.41<br />
4. Water Supply 5.06 1.48<br />
5. Activity of Churches in <strong>Community</strong> 5.02 1.51<br />
6. Ambulance Service 5.01 1.44<br />
7. Banking and Financial Services 4.95 1.37<br />
8. Availability of Homes to Purchase 4.90 1.44<br />
9. Availability of Senior Housing Options 4.69 1.54<br />
10. Access to Hospital(s) 4.68 1.62<br />
11. Quality of Elementary Education 4.61 1.60<br />
12. Library 4.58 1.45<br />
13. Sewage Collection and Disposal 4.57 1.54<br />
14. Friendliness of Residents 4.51 1.46<br />
15. Police Protection 4.50 1.74<br />
16tie. Availability of Senior Programs 4.46 1.57<br />
16tie. Condition of Owner-Occupied Housing 4.46 1.22<br />
18. Appearance of Public Buildings 4.44 1.41<br />
19. Condition of School Buildings 4.40 1.58<br />
20tie. Availability of Day Care for Children 4.37 1.53<br />
20tie. Availability of Doctors 4.37 1.57<br />
22. Availability of Emergency Care 4.35 1.71<br />
23. Flood Control Measures 4.31 1.46<br />
24. Quality of Jr.High/High School Education 4.30 1.56<br />
25. Availability of Dentists 4.27 1.70<br />
26. Quality of Places to Eat Out 4.17 1.58<br />
27. Availability of Rental Housing Options 4.14 1.47<br />
28. Number of Places to Eat Out 4.14 1.62<br />
29. Local Newspaper Service 4.07 1.72<br />
30. Accessibility of <strong>Community</strong> for People<br />
4.06 1.55<br />
With Disabilities<br />
31. Water Quality 4.04 1.77<br />
32. <strong>Community</strong> Civic Organizations 4.01 1.35<br />
33. Appearance of Neighborhoods 3.99 1.38<br />
34. Quality of Goods in Stores 3.96 1.53<br />
35. Traffic Conditions 3.94 1.31<br />
36. Appearance of Gateways into <strong>Community</strong> 3.91 1.51<br />
37tie. Progressive <strong>Community</strong> Spirit 3.89 1.49<br />
37tie. Streets and Roads 3.89 1.23<br />
39. Acceptance of Minorities 3.88 1.53<br />
40. Parking Downtown 3.87 1.49<br />
Note. Standard deviations indicate level of agreement in ratings across respondents (higher standard<br />
deviations indicate less agreement in respondent ratings). All ratings were made on 7-point scales<br />
where 1 = “Very poor” and 7 = “Very good”; thus, higher numbers reflect greater perceived quality.<br />
80