Emmett/Gem County Community Review Report Summary
Emmett/Gem County Community Review Report Summary
Emmett/Gem County Community Review Report Summary

You also want an ePaper? Increase the reach of your titles
YUMPU automatically turns print PDFs into web optimized ePapers that Google loves.
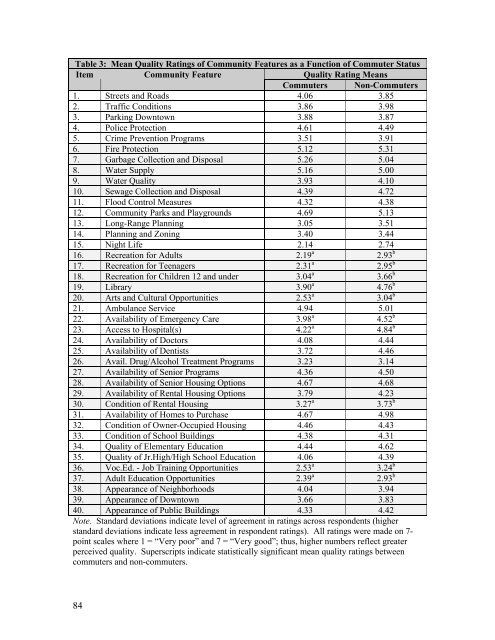
Table 3: Mean Quality Ratings of <strong>Community</strong> Features as a Function of Commuter Status<br />
Item<br />
<strong>Community</strong> Feature<br />
Quality Rating Means<br />
Commuters Non-Commuters<br />
1. Streets and Roads 4.06 3.85<br />
2. Traffic Conditions 3.86 3.98<br />
3. Parking Downtown 3.88 3.87<br />
4. Police Protection 4.61 4.49<br />
5. Crime Prevention Programs 3.51 3.91<br />
6. Fire Protection 5.12 5.31<br />
7. Garbage Collection and Disposal 5.26 5.04<br />
8. Water Supply 5.16 5.00<br />
9. Water Quality 3.93 4.10<br />
10. Sewage Collection and Disposal 4.39 4.72<br />
11. Flood Control Measures 4.32 4.38<br />
12. <strong>Community</strong> Parks and Playgrounds 4.69 5.13<br />
13. Long-Range Planning 3.05 3.51<br />
14. Planning and Zoning 3.40 3.44<br />
15. Night Life 2.14 2.74<br />
16. Recreation for Adults 2.19 a 2.93 b<br />
17. Recreation for Teenagers 2.31 a 2.95 b<br />
18. Recreation for Children 12 and under 3.04 a 3.66 b<br />
19. Library 3.90 a 4.76 b<br />
20. Arts and Cultural Opportunities 2.53 a 3.04 b<br />
21. Ambulance Service 4.94 5.01<br />
22. Availability of Emergency Care 3.98 a 4.52 b<br />
23. Access to Hospital(s) 4.22 a 4.84 b<br />
24. Availability of Doctors 4.08 4.44<br />
25. Availability of Dentists 3.72 4.46<br />
26. Avail. Drug/Alcohol Treatment Programs 3.23 3.14<br />
27. Availability of Senior Programs 4.36 4.50<br />
28. Availability of Senior Housing Options 4.67 4.68<br />
29. Availability of Rental Housing Options 3.79 4.23<br />
30. Condition of Rental Housing 3.27 a 3.73 b<br />
31. Availability of Homes to Purchase 4.67 4.98<br />
32. Condition of Owner-Occupied Housing 4.46 4.43<br />
33. Condition of School Buildings 4.38 4.31<br />
34. Quality of Elementary Education 4.44 4.62<br />
35. Quality of Jr.High/High School Education 4.06 4.39<br />
36. Voc.Ed. - Job Training Opportunities 2.53 a 3.24 b<br />
37. Adult Education Opportunities 2.39 a 2.93 b<br />
38. Appearance of Neighborhoods 4.04 3.94<br />
39. Appearance of Downtown 3.66 3.83<br />
40. Appearance of Public Buildings 4.33 4.42<br />
Note. Standard deviations indicate level of agreement in ratings across respondents (higher<br />
standard deviations indicate less agreement in respondent ratings). All ratings were made on 7-<br />
point scales where 1 = “Very poor” and 7 = “Very good”; thus, higher numbers reflect greater<br />
perceived quality. Superscripts indicate statistically significant mean quality ratings between<br />
commuters and non-commuters.<br />
84