Performance of Flagship Programmes in Tamil Nadu
Performance of Flagship Programmes in Tamil Nadu
Performance of Flagship Programmes in Tamil Nadu

Create successful ePaper yourself
Turn your PDF publications into a flip-book with our unique Google optimized e-Paper software.
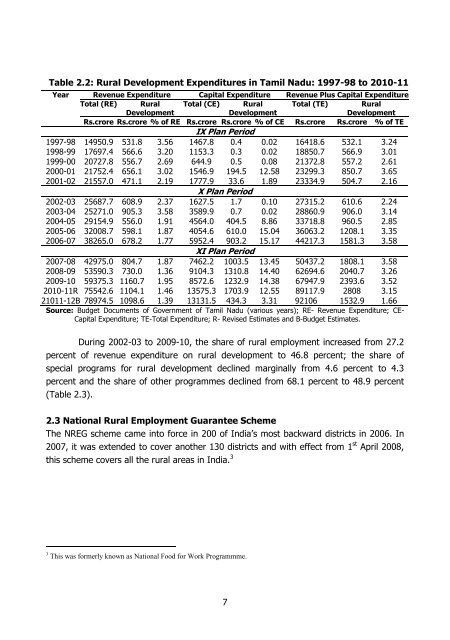
Table 2.2: Rural Development Expenditures <strong>in</strong> <strong>Tamil</strong> <strong>Nadu</strong>: 1997-98 to 2010-11<br />
Year Revenue Expenditure Capital Expenditure Revenue Plus Capital Expenditure<br />
Total (RE) Rural<br />
Development<br />
Total (CE) Rural<br />
Development<br />
Total (TE) Rural<br />
Development<br />
Rs.crore Rs.crore % <strong>of</strong> RE Rs.crore Rs.crore % <strong>of</strong> CE Rs.crore Rs.crore % <strong>of</strong> TE<br />
IX Plan Period<br />
1997-98 14950.9 531.8 3.56 1467.8 0.4 0.02 16418.6 532.1 3.24<br />
1998-99 17697.4 566.6 3.20 1153.3 0.3 0.02 18850.7 566.9 3.01<br />
1999-00 20727.8 556.7 2.69 644.9 0.5 0.08 21372.8 557.2 2.61<br />
2000-01 21752.4 656.1 3.02 1546.9 194.5 12.58 23299.3 850.7 3.65<br />
2001-02 21557.0 471.1 2.19 1777.9 33.6 1.89 23334.9 504.7 2.16<br />
X Plan Period<br />
2002-03 25687.7 608.9 2.37 1627.5 1.7 0.10 27315.2 610.6 2.24<br />
2003-04 25271.0 905.3 3.58 3589.9 0.7 0.02 28860.9 906.0 3.14<br />
2004-05 29154.9 556.0 1.91 4564.0 404.5 8.86 33718.8 960.5 2.85<br />
2005-06 32008.7 598.1 1.87 4054.6 610.0 15.04 36063.2 1208.1 3.35<br />
2006-07 38265.0 678.2 1.77 5952.4 903.2 15.17 44217.3 1581.3 3.58<br />
XI Plan Period<br />
2007-08 42975.0 804.7 1.87 7462.2 1003.5 13.45 50437.2 1808.1 3.58<br />
2008-09 53590.3 730.0 1.36 9104.3 1310.8 14.40 62694.6 2040.7 3.26<br />
2009-10 59375.3 1160.7 1.95 8572.6 1232.9 14.38 67947.9 2393.6 3.52<br />
2010-11R 75542.6 1104.1 1.46 13575.3 1703.9 12.55 89117.9 2808 3.15<br />
21011-12B 78974.5 1098.6 1.39 13131.5 434.3 3.31 92106 1532.9 1.66<br />
Source: Budget Documents <strong>of</strong> Government <strong>of</strong> <strong>Tamil</strong> <strong>Nadu</strong> (various years); RE- Revenue Expenditure; CE-<br />
Capital Expenditure; TE-Total Expenditure; R- Revised Estimates and B-Budget Estimates.<br />
Dur<strong>in</strong>g 2002-03 to 2009-10, the share <strong>of</strong> rural employment <strong>in</strong>creased from 27.2<br />
percent <strong>of</strong> revenue expenditure on rural development to 46.8 percent; the share <strong>of</strong><br />
special programs for rural development decl<strong>in</strong>ed marg<strong>in</strong>ally from 4.6 percent to 4.3<br />
percent and the share <strong>of</strong> other programmes decl<strong>in</strong>ed from 68.1 percent to 48.9 percent<br />
(Table 2.3).<br />
2.3 National Rural Employment Guarantee Scheme<br />
The NREG scheme came <strong>in</strong>to force <strong>in</strong> 200 <strong>of</strong> India’s most backward districts <strong>in</strong> 2006. In<br />
2007, it was extended to cover another 130 districts and with effect from 1 st April 2008,<br />
this scheme covers all the rural areas <strong>in</strong> India. 3<br />
3 This was formerly known as National Food for Work Programmme.<br />
7
![Curriculum Vitae [pdf] - Madras School of Economics](https://img.yumpu.com/49878970/1/190x245/curriculum-vitae-pdf-madras-school-of-economics.jpg?quality=85)
![Curriculum Vitae [pdf] - Madras School of Economics](https://img.yumpu.com/48715201/1/184x260/curriculum-vitae-pdf-madras-school-of-economics.jpg?quality=85)