Performance of Flagship Programmes in Tamil Nadu
Performance of Flagship Programmes in Tamil Nadu
Performance of Flagship Programmes in Tamil Nadu

You also want an ePaper? Increase the reach of your titles
YUMPU automatically turns print PDFs into web optimized ePapers that Google loves.
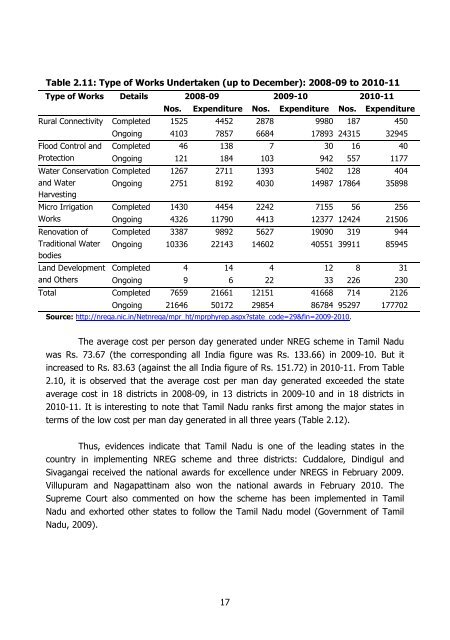
Table 2.11: Type <strong>of</strong> Works Undertaken (up to December): 2008-09 to 2010-11<br />
Type <strong>of</strong> Works Details 2008-09 2009-10 2010-11<br />
Nos. Expenditure Nos. Expenditure Nos. Expenditure<br />
Rural Connectivity Completed 1525 4452 2878 9980 187 450<br />
Ongo<strong>in</strong>g 4103 7857 6684 17893 24315 32945<br />
Flood Control and Completed 46 138 7 30 16 40<br />
Protection Ongo<strong>in</strong>g 121 184 103 942 557 1177<br />
Water Conservation Completed 1267 2711 1393 5402 128 404<br />
and Water Ongo<strong>in</strong>g 2751 8192 4030 14987 17864 35898<br />
Harvest<strong>in</strong>g<br />
Micro Irrigation Completed 1430 4454 2242 7155 56 256<br />
Works<br />
Ongo<strong>in</strong>g 4326 11790 4413 12377 12424 21506<br />
Renovation <strong>of</strong> Completed 3387 9892 5627 19090 319 944<br />
Traditional Water Ongo<strong>in</strong>g 10336 22143 14602 40551 39911 85945<br />
bodies<br />
Land Development Completed 4 14 4 12 8 31<br />
and Others Ongo<strong>in</strong>g 9 6 22 33 226 230<br />
Total Completed 7659 21661 12151 41668 714 2126<br />
Ongo<strong>in</strong>g 21646 50172 29854 86784 95297 177702<br />
Source: http://nrega.nic.<strong>in</strong>/Netnrega/mpr_ht/mprphyrep.aspxstate_code=29&f<strong>in</strong>=2009-2010.<br />
The average cost per person day generated under NREG scheme <strong>in</strong> <strong>Tamil</strong> <strong>Nadu</strong><br />
was Rs. 73.67 (the correspond<strong>in</strong>g all India figure was Rs. 133.66) <strong>in</strong> 2009-10. But it<br />
<strong>in</strong>creased to Rs. 83.63 (aga<strong>in</strong>st the all India figure <strong>of</strong> Rs. 151.72) <strong>in</strong> 2010-11. From Table<br />
2.10, it is observed that the average cost per man day generated exceeded the state<br />
average cost <strong>in</strong> 18 districts <strong>in</strong> 2008-09, <strong>in</strong> 13 districts <strong>in</strong> 2009-10 and <strong>in</strong> 18 districts <strong>in</strong><br />
2010-11. It is <strong>in</strong>terest<strong>in</strong>g to note that <strong>Tamil</strong> <strong>Nadu</strong> ranks first among the major states <strong>in</strong><br />
terms <strong>of</strong> the low cost per man day generated <strong>in</strong> all three years (Table 2.12).<br />
Thus, evidences <strong>in</strong>dicate that <strong>Tamil</strong> <strong>Nadu</strong> is one <strong>of</strong> the lead<strong>in</strong>g states <strong>in</strong> the<br />
country <strong>in</strong> implement<strong>in</strong>g NREG scheme and three districts: Cuddalore, D<strong>in</strong>digul and<br />
Sivagangai received the national awards for excellence under NREGS <strong>in</strong> February 2009.<br />
Villupuram and Nagapatt<strong>in</strong>am also won the national awards <strong>in</strong> February 2010. The<br />
Supreme Court also commented on how the scheme has been implemented <strong>in</strong> <strong>Tamil</strong><br />
<strong>Nadu</strong> and exhorted other states to follow the <strong>Tamil</strong> <strong>Nadu</strong> model (Government <strong>of</strong> <strong>Tamil</strong><br />
<strong>Nadu</strong>, 2009).<br />
17
![Curriculum Vitae [pdf] - Madras School of Economics](https://img.yumpu.com/49878970/1/190x245/curriculum-vitae-pdf-madras-school-of-economics.jpg?quality=85)
![Curriculum Vitae [pdf] - Madras School of Economics](https://img.yumpu.com/48715201/1/184x260/curriculum-vitae-pdf-madras-school-of-economics.jpg?quality=85)