2010-11_ANNUAL_REPORTS_-_FINAL_VERSION_(3)
2010-11_ANNUAL_REPORTS_-_FINAL_VERSION_(3)
2010-11_ANNUAL_REPORTS_-_FINAL_VERSION_(3)

Create successful ePaper yourself
Turn your PDF publications into a flip-book with our unique Google optimized e-Paper software.
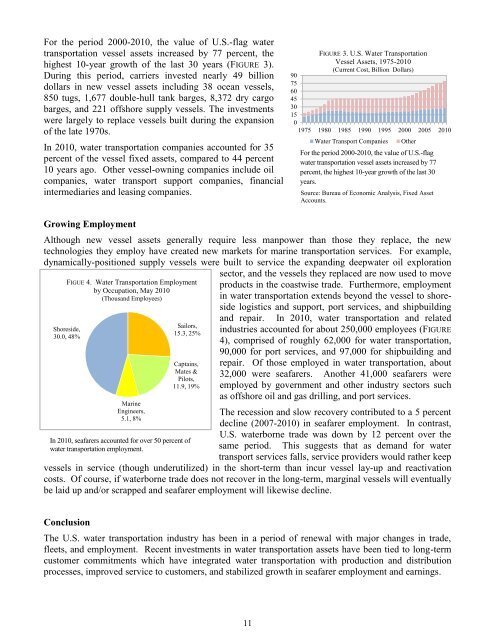
For the period 2000-<strong>2010</strong>, the value of U.S.-flag water<br />
transportation vessel assets increased by 77 percent, the<br />
highest 10-year growth of the last 30 years (FIGURE 3).<br />
During this period, carriers invested nearly 49 billion<br />
dollars in new vessel assets including 38 ocean vessels,<br />
850 tugs, 1,677 double-hull tank barges, 8,372 dry cargo<br />
barges, and 221 offshore supply vessels. The investments<br />
were largely to replace vessels built during the expansion<br />
of the late 1970s.<br />
In <strong>2010</strong>, water transportation companies accounted for 35<br />
percent of the vessel fixed assets, compared to 44 percent<br />
10 years ago. Other vessel-owning companies include oil<br />
companies, water transport support companies, financial<br />
intermediaries and leasing companies.<br />
FIGURE 3. U.S. Water Transportation<br />
Vessel Assets, 1975-<strong>2010</strong><br />
(Current Cost, Billion Dollars)<br />
90<br />
75<br />
60<br />
45<br />
30<br />
15<br />
0<br />
1975 1980 1985 1990 1995 2000 2005 <strong>2010</strong><br />
Water Transport Companies<br />
Other<br />
For the period 2000-<strong>2010</strong>, the value of U.S.-flag<br />
water transportation vessel assets increased by 77<br />
percent, the highest 10-year growth of the last 30<br />
years.<br />
Source: Bureau of Economic Analysis, Fixed Asset<br />
Accounts.<br />
Growing Employment<br />
Although new vessel assets generally require less manpower than those they replace, the new<br />
technologies they employ have created new markets for marine transportation services. For example,<br />
dynamically-positioned supply vessels were built to service the expanding deepwater oil exploration<br />
FIGUE 4. Water Transportation Employment<br />
by Occupation, May <strong>2010</strong><br />
(Thousand Employees)<br />
Shoreside,<br />
30.0, 48%<br />
Marine<br />
Engineers,<br />
5.1, 8%<br />
Sailors,<br />
15.3, 25%<br />
Captains,<br />
Mates &<br />
Pilots,<br />
<strong>11</strong>.9, 19%<br />
In <strong>2010</strong>, seafarers accounted for over 50 percent of<br />
water transportation employment.<br />
sector, and the vessels they replaced are now used to move<br />
products in the coastwise trade. Furthermore, employment<br />
in water transportation extends beyond the vessel to shoreside<br />
logistics and support, port services, and shipbuilding<br />
and repair. In <strong>2010</strong>, water transportation and related<br />
industries accounted for about 250,000 employees (FIGURE<br />
4), comprised of roughly 62,000 for water transportation,<br />
90,000 for port services, and 97,000 for shipbuilding and<br />
repair. Of those employed in water transportation, about<br />
32,000 were seafarers. Another 41,000 seafarers were<br />
employed by government and other industry sectors such<br />
as offshore oil and gas drilling, and port services.<br />
The recession and slow recovery contributed to a 5 percent<br />
decline (2007-<strong>2010</strong>) in seafarer employment. In contrast,<br />
U.S. waterborne trade was down by 12 percent over the<br />
same period. This suggests that as demand for water<br />
transport services falls, service providers would rather keep<br />
vessels in service (though underutilized) in the short-term than incur vessel lay-up and reactivation<br />
costs. Of course, if waterborne trade does not recover in the long-term, marginal vessels will eventually<br />
be laid up and/or scrapped and seafarer employment will likewise decline.<br />
Conclusion<br />
The U.S. water transportation industry has been in a period of renewal with major changes in trade,<br />
fleets, and employment. Recent investments in water transportation assets have been tied to long-term<br />
customer commitments which have integrated water transportation with production and distribution<br />
processes, improved service to customers, and stabilized growth in seafarer employment and earnings.<br />
<strong>11</strong>