2010-11_ANNUAL_REPORTS_-_FINAL_VERSION_(3)
2010-11_ANNUAL_REPORTS_-_FINAL_VERSION_(3)
2010-11_ANNUAL_REPORTS_-_FINAL_VERSION_(3)

Create successful ePaper yourself
Turn your PDF publications into a flip-book with our unique Google optimized e-Paper software.
Industry Overview<br />
HELPING AMERICAN COMMERCE<br />
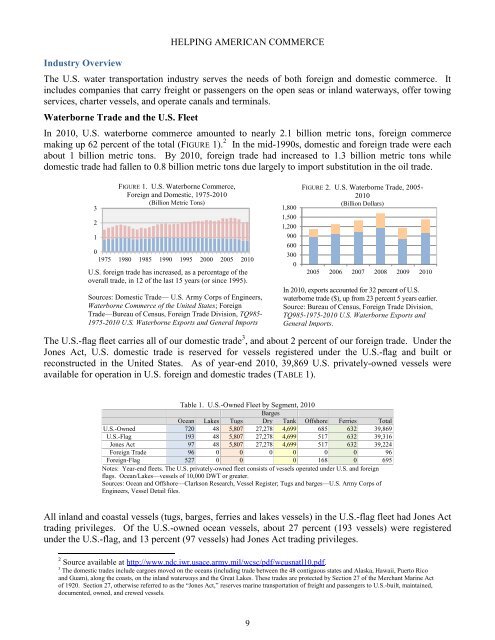
The U.S. water transportation industry serves the needs of both foreign and domestic commerce. It<br />
includes companies that carry freight or passengers on the open seas or inland waterways, offer towing<br />
services, charter vessels, and operate canals and terminals.<br />
Waterborne Trade and the U.S. Fleet<br />
In <strong>2010</strong>, U.S. waterborne commerce amounted to nearly 2.1 billion metric tons, foreign commerce<br />
making up 62 percent of the total (FIGURE 1). 2 In the mid-1990s, domestic and foreign trade were each<br />
about 1 billion metric tons. By <strong>2010</strong>, foreign trade had increased to 1.3 billion metric tons while<br />
domestic trade had fallen to 0.8 billion metric tons due largely to import substitution in the oil trade.<br />
3<br />
2<br />
1<br />
FIGURE 1. U.S. Waterborne Commerce,<br />
Foreign and Domestic, 1975-<strong>2010</strong><br />
(Billion Metric Tons)<br />
0<br />
1975 1980 1985 1990 1995 2000 2005 <strong>2010</strong><br />
U.S. foreign trade has Foreign increased, Domestic as a percentage of the<br />
overall trade, in 12 of the last 15 years (or since 1995).<br />
Sources: Domestic Trade— U.S. Army Corps of Engineers,<br />
Waterborne Commerce of the United States; Foreign<br />
Trade—Bureau of Census, Foreign Trade Division, TQ985-<br />
1975-<strong>2010</strong> U.S. Waterborne Exports and General Imports<br />
1,800<br />
1,500<br />
1,200<br />
900<br />
600<br />
300<br />
0<br />
FIGURE 2. U.S. Waterborne Trade, 2005-<br />
<strong>2010</strong><br />
(Billion Dollars)<br />
2005 2006 2007 2008 2009 <strong>2010</strong><br />
In <strong>2010</strong>, exports accounted<br />
Imports<br />
for 32<br />
Exports<br />
percent of U.S.<br />
waterborne trade ($), up from 23 percent 5 years earlier.<br />
Source: Bureau of Census, Foreign Trade Division,<br />
TQ985-1975-<strong>2010</strong> U.S. Waterborne Exports and<br />
General Imports.<br />
The U.S.-flag fleet carries all of our domestic trade 3 , and about 2 percent of our foreign trade. Under the<br />
Jones Act, U.S. domestic trade is reserved for vessels registered under the U.S.-flag and built or<br />
reconstructed in the United States. As of year-end <strong>2010</strong>, 39,869 U.S. privately-owned vessels were<br />
available for operation in U.S. foreign and domestic trades (TABLE 1).<br />
Table 1. U.S.-Owned Fleet by Segment, <strong>2010</strong><br />
Barges<br />
Ocean Lakes Tugs Dry Tank Offshore Ferries Total<br />
U.S.-Owned 720 48 5,807 27,278 4,699 685 632 39,869<br />
U.S.-Flag 193 48 5,807 27,278 4,699 517 632 39,316<br />
Jones Act 97 48 5,807 27,278 4,699 517 632 39,224<br />
Foreign Trade 96 0 0 0 0 0 0 96<br />
Foreign-Flag 527 0 0 0 168 0 695<br />
Notes: Year-end fleets. The U.S. privately-owned fleet consists of vessels operated under U.S. and foreign<br />
flags. Ocean/Lakes—vessels of 10,000 DWT or greater.<br />
Sources: Ocean and Offshore—Clarkson Research, Vessel Register; Tugs and barges—U.S. Army Corps of<br />
Engineers, Vessel Detail files.<br />
All inland and coastal vessels (tugs, barges, ferries and lakes vessels) in the U.S.-flag fleet had Jones Act<br />
trading privileges. Of the U.S.-owned ocean vessels, about 27 percent (193 vessels) were registered<br />
under the U.S.-flag, and 13 percent (97 vessels) had Jones Act trading privileges.<br />
2 Source available at http://www.ndc.iwr.usace.army.mil/wcsc/pdf/wcusnatl10.pdf.<br />
3 The domestic trades include cargoes moved on the oceans (including trade between the 48 contiguous states and Alaska, Hawaii, Puerto Rico<br />
and Guam), along the coasts, on the inland waterways and the Great Lakes. These trades are protected by Section 27 of the Merchant Marine Act<br />
of 1920. Section 27, otherwise referred to as the “Jones Act,” reserves marine transportation of freight and passengers to U.S.-built, maintained,<br />
documented, owned, and crewed vessels.<br />
9