ASTER User Handbook
ASTER User Handbook
ASTER User Handbook

Create successful ePaper yourself
Turn your PDF publications into a flip-book with our unique Google optimized e-Paper software.
<strong>ASTER</strong> <strong>User</strong><br />
<strong>Handbook</strong><br />
Version 2<br />
Michael Abrams<br />
Simon Hook<br />
Jet Propulsion Laboratory<br />
4800 Oak Grove Dr.<br />
Pasadena, CA 91109<br />
Bhaskar Ramachandran<br />
EROS Data Center<br />
Sioux Falls, SD 57198
<strong>ASTER</strong> <strong>User</strong>s <strong>Handbook</strong><br />
Acknowledgments<br />
This document was prepared at the Jet Propulsion Laboratory/California Institute of Technology.<br />
Work was performed under contract to the National Aeronautics and Space Administration.<br />
2
<strong>ASTER</strong> <strong>User</strong>s <strong>Handbook</strong><br />
Table of Contents<br />
1.0 Introduction to <strong>ASTER</strong>............................................................................................................. 6<br />
2.0 The <strong>ASTER</strong> Instrument ............................................................................................................ 6<br />
2.1 The VNIR Instrument ........................................................................................................... 9<br />
2.2 The SWIR Instrument......................................................................................................... 10<br />
2.3 The TIR Instrument............................................................................................................. 11<br />
3.0 <strong>ASTER</strong> Level-1 Data.............................................................................................................. 14<br />
3.1 <strong>ASTER</strong> Level-1A Data....................................................................................................... 17<br />
3.1.1 <strong>ASTER</strong> Level-1A Browse ........................................................................................... 17<br />
3.2 <strong>ASTER</strong> Level-1B Data ....................................................................................................... 19<br />
3.2.1 <strong>ASTER</strong> Level-1B Browse............................................................................................ 19<br />
4.0 <strong>ASTER</strong> Higher-Level Products .............................................................................................. 22<br />
5.0 <strong>ASTER</strong> Radiometry................................................................................................................ 23<br />
6.0 <strong>ASTER</strong> Geometry................................................................................................................... 25<br />
7.0 Data Acquisition Strategy....................................................................................................... 27<br />
8.0 <strong>ASTER</strong> Data Search and Order of Archived Data and Products............................................ 29<br />
9.0 <strong>ASTER</strong> Higher-Level Data Products Ordering Mechanism................................................... 29<br />
10.0 Data Acquisition Requests.................................................................................................... 30<br />
3
<strong>ASTER</strong> <strong>User</strong>s <strong>Handbook</strong><br />
Table of Figures<br />
Figure 1: The <strong>ASTER</strong> Instrument before Launch........................................................................... 7<br />
Figure 2: Comparison of Spectral Bands between <strong>ASTER</strong> and Landsat-7 Thematic Mapper....... 8<br />
Figure 3: VNIR Subsystem Design............................................................................................... 10<br />
Figure 4: SWIR Subsystem Design. ............................................................................................. 11<br />
Figure 5: TIR Subsystem Design.................................................................................................. 13<br />
Figure 6: End-to-End Processing Flow of <strong>ASTER</strong> data between US and Japan.......................... 16<br />
Figure 9: Opening Page of the EOS Data Gateway........................Erro! Indicador não definido.<br />
Figure 10: Choosing Search Keyword “DATASET.” ....................Erro! Indicador não definido.<br />
Figure 11: Choosing Search Area...................................................Erro! Indicador não definido.<br />
Figure 12: Choosing a Date/Time Range........................................Erro! Indicador não definido.<br />
Figure 13: Data Set Listing Result..................................................Erro! Indicador não definido.<br />
Figure 14: Data Granules Listing Result. .......................................Erro! Indicador não definido.<br />
Figure 15: Choosing Ordering Options...........................................Erro! Indicador não definido.<br />
Figure 16: Order Form....................................................................Erro! Indicador não definido.<br />
Figure 17: Cuprite Mining District, displayed with SWIR bands 4-6-8 as RGB composite...Erro!<br />
Indicador não definido.<br />
Figure 18: Spectral Angle Mapper Classification of Cuprite SWIR data.Erro! Indicador não<br />
definido.<br />
Figure 19: <strong>ASTER</strong> image spectra (left) and library spectra (right) for mineralsErro! Indicador<br />
não definido.<br />
mapped at Cuprite...........................................................................Erro! Indicador não definido.<br />
Figure 20: Outline map of Lake Tahoe, CA/NV. ...........................Erro! Indicador não definido.<br />
Figure 21: Raft Measurements........................................................Erro! Indicador não definido.<br />
Figure 22: Field measurements at the US Coast Guard..................Erro! Indicador não definido.<br />
Figure 23: Color Infrared Composite of <strong>ASTER</strong> bands 3, 2, 1 as R, G, B respectively. ........Erro!<br />
Indicador não definido.<br />
Figure 24: <strong>ASTER</strong> band 1 (0.52-0.60 µm) color-coded to show variations in the intensity of the<br />
near-shore bottom reflectance.................................................Erro! Indicador não definido.<br />
Figure 25: Bathymetric map of Lake Tahoe CA/NV......................Erro! Indicador não definido.<br />
Figure 26: Near-shore clarity map derived from <strong>ASTER</strong> data and a bathymetric map. .........Erro!<br />
Indicador não definido.<br />
Figure 27: <strong>ASTER</strong> Band-13 Brightness Temperature Image of Lake Tahoe from Thermal Data<br />
Acquired June 3, 2001. ...........................................................Erro! Indicador não definido.<br />
Figure 28: Upper-left pixel of VNIR, SWIR and TIR bands in an <strong>ASTER</strong> Level-1B data set.<br />
.................................................................................................Erro! Indicador não definido.<br />
Figure 29: <strong>ASTER</strong> L1B Footprint in the Context of the SCENEFOURCORNERS Alignment.<br />
.................................................................................................Erro! Indicador não definido.<br />
Figure 30: Ascending and Descending Orbital Paths. ....................Erro! Indicador não definido.<br />
Figure 31: G-Ring and G-Polygon..................................................Erro! Indicador não definido.<br />
4
<strong>ASTER</strong> <strong>User</strong>s <strong>Handbook</strong><br />
List of Tables<br />
Table 1: Characteristics of the 3 <strong>ASTER</strong> Sensor Systems. ............................................................ 8<br />
Table 2: Specifications of the <strong>ASTER</strong> Level-1A Browse Product............................................... 17<br />
Table 2: Resampling Methods and Projections Available for Producing Level-1B products..... 21<br />
Table 3: <strong>ASTER</strong> Higher-Level Standard Data Products. ............................................................. 22<br />
Table 4: Maximum Radiance Values for all <strong>ASTER</strong> Bands and all Gains. ................................. 23<br />
Table 5: Calculated Unit Conversion Coefficients. ...................................................................... 24<br />
Table 6: Geometric Performance of <strong>ASTER</strong> Level-1 Data (Based on V2.1 of the Geometric<br />
Correction Database). ........................................................................................................... 26<br />
Table 7: Specific Metadata Attributes Required for Geo-Referencing <strong>ASTER</strong> Level-1B Data.<br />
.................................................................................................Erro! Indicador não definido.<br />
5
<strong>ASTER</strong> <strong>User</strong>s <strong>Handbook</strong><br />
1.0 Introduction to <strong>ASTER</strong><br />
The Advanced Spaceborne Thermal Emission and Reflection Radiometer (<strong>ASTER</strong>) is an<br />
advanced multispectral imager that was launched on board NASA’s Terra spacecraft in<br />
December, 1999. <strong>ASTER</strong> covers a wide spectral region with 14 bands from the visible to the<br />
thermal infrared with high spatial, spectral and radiometric resolution. An additional backwardlooking<br />
near-infrared band provides stereo coverage. The spatial resolution varies with<br />
wavelength: 15 m in the visible and near-infrared (VNIR), 30 m in the short wave infrared<br />
(SWIR), and 90 m in the thermal infrared (TIR). Each <strong>ASTER</strong> scene covers an area of 60 x 60<br />
km.<br />
Terra is the first of a series of multi-instrument spacecraft forming NASA’s Earth Observing<br />
System (EOS). EOS consists of a science component and a data information system (EOSDIS)<br />
supporting a coordinated series of polar-orbiting and low inclination satellites for long-term<br />
global observations of the land surface, biosphere, solid Earth, atmosphere, and oceans. By<br />
enabling improved understanding of the Earth as an integrated system, the EOS program has<br />
benefits for us all. In addition to <strong>ASTER</strong>, the other instruments on Terra are the Moderate-<br />
Resolution Imaging Spectroradiometer (MODIS), Multi-angle Imaging Spectro-Radiometer<br />
(MISR), Clouds and the Earth’s Radiant Energy System (CERES), and Measurements of<br />
Pollution in the Troposphere (MOPITT). As the only high spatial resolution instrument on Terra,<br />
<strong>ASTER</strong> is the “zoom lens” for the other instruments. Terra is in a sun-synchronous orbit, 30<br />
minutes behind Landsat ETM+; it crosses the equator at about 10:30 am local solar time.<br />
<strong>ASTER</strong> can acquire data over the entire globe with an average duty cycle of 8% per orbit. This<br />
translates to acquisition of about 650 scenes per day, that are processed to Level-1A; of these,<br />
about 150 are processed to Level-1B. All 1A and 1B scenes are transferred to the EOSDIS<br />
archive at the EROS Data Center’s (EDC) Land Processes Distributed Active Archive Center<br />
(LP-DAAC), for storage, distribution, and processing to higher-level data products. All <strong>ASTER</strong><br />
data products are stored in a specific implementation of Hierarchical Data Format called HDF-<br />
EOS.<br />
2.0 The <strong>ASTER</strong> Instrument<br />
<strong>ASTER</strong> is a cooperative effort between NASA and Japan's Ministry of Economy Trade and<br />
Industry (METI) formerly known as Ministry of International Trade and Industry (MITI), with<br />
the collaboration of scientific and industry organizations in both countries. The <strong>ASTER</strong><br />
instrument consists of three separate instrument subsystems (Figure 1).<br />
6
<strong>ASTER</strong> <strong>User</strong>s <strong>Handbook</strong><br />
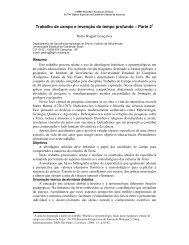
Figure 1: The <strong>ASTER</strong> Instrument before Launch.<br />
<strong>ASTER</strong> consists of three different subsystems (Figure 2): the Visible and Near-infrared (VNIR)<br />
has three bands with a spatial resolution of 15 m, and an additional backward telescope for<br />
stereo; the Shortwave Infrared (SWIR) has 6 bands with a spatial resolution of 30 m; and the<br />
Thermal Infrared (TIR) has 5 bands with a spatial resolution of 90 m. Each subsystem operates<br />
in a different spectral region, with its own telescope(s), and is built by a different Japanese<br />
company. The spectral bandpasses are shown in Table 1, and a comparison of bandpasses with<br />
Landsat Thematic Mapper is shown in Figure 3. In addition, one more telescope is used to view<br />
backward in the near-infrared spectral band (band 3B) for stereoscopic capability.<br />
7
<strong>ASTER</strong> <strong>User</strong>s <strong>Handbook</strong><br />
Subsystem<br />
VNIR<br />
SWIR<br />
TIR<br />
Band Spectral Range (µm)<br />
No.<br />
1 0.52-0.60<br />
2 0.63-0.69<br />
3N 0.78-0.86<br />
3B 0.78-0.86<br />
4 1.60-1.70<br />
5 2.145-2.185<br />
6 2.185-2.225<br />
7 2.235-2.285<br />
8 2.295-2.365<br />
9 2.360-2.430<br />
10 8.125-8.475<br />
11 8.475-8.825<br />
12 8.925-9.275<br />
13 10.25-10.95<br />
14 10.95-11.65<br />
Spatial<br />
Resolution, m<br />
Quantization<br />
Levels<br />
15 8 bits<br />
30 8 bits<br />
90 12 bits<br />
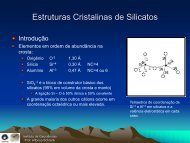
Table 1: Characteristics of the 3 <strong>ASTER</strong> Sensor Systems.<br />
Figure 2: Comparison of Spectral Bands between <strong>ASTER</strong> and Landsat-7 Thematic<br />
Mapper.<br />
(Note: % Ref is reflectance percent).<br />
The Terra spacecraft is flying in a circular, near-polar orbit at an altitude of 705 km. The orbit is<br />
sun-synchronous with equatorial crossing at local time of 10:30 a.m., returning to the same orbit<br />
8
<strong>ASTER</strong> <strong>User</strong>s <strong>Handbook</strong><br />
every 16 days. The orbit parameters are the same as those of Landsat 7, except for the local<br />
equatorial crossing time.<br />
2.1 The VNIR Instrument<br />
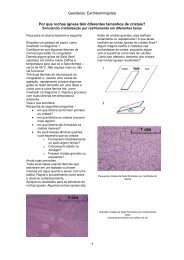
The VNIR subsystem consists of two independent telescope assemblies to minimize image<br />
distortion in the backward and nadir looking telescopes (Figure 3). The detectors for each of the<br />
bands consist of 5000 element silicon charge-coupled detectors (CCD's). Only 4000 of these<br />
detectors are used at any one time. A time lag occurs between the acquisition of the backward<br />
image and the nadir image. During this time earth rotation displaces the image center. The VNIR<br />
subsystem automatically extracts the correct 4000 pixels based on orbit position information<br />
supplied by the EOS platform.<br />
The VNIR optical system is a reflecting-refracting improved Schmidt design. The backward<br />
looking telescope focal plane contains only a single detector array and uses an interference filter<br />
for wavelength discrimination. The focal plane of the nadir telescope contains 3 line arrays and<br />
uses a dichroic prism and interference filters for spectral separation allowing all three bands to<br />
view the same area simultaneously. The telescope and detectors are maintained at 296 ± 3K<br />
using thermal control and cooling from a platform-provided cold plate. On-board calibration of<br />
the two VNIR telescopes is accomplished with either of two independent calibration devices for<br />
each telescope. The radiation source is a halogen lamp. A diverging beam from the lamp<br />
filament is input to the first optical element (Schmidt corrector) of the telescope subsystem<br />
filling part of the aperture. The detector elements are uniformly irradiated by this beam. In each<br />
calibration device, two silicon photo-diodes are used to monitor the radiance of the lamp. One<br />
photo-diode monitors the filament directly and the second monitors the calibration beam just in<br />
front of the first optical element of the telescope. The temperatures of the lamp base and the<br />
photo-diodes are also monitored. Provision for electrical calibration of the electronic components<br />
is also provided.<br />
The system signal-to-noise is controlled by specifying the NE delta rho (ρ) to be < 0.5%<br />
referenced to a diffuse target with a 70% albedo at the equator during equinox. The absolute<br />
radiometric accuracy is ± 4% or better.<br />
The VNIR subsystem produces by far the highest data rate of the three <strong>ASTER</strong> imaging<br />
subsystems. With all four bands operating (3 nadir and 1 backward) the data rate including image<br />
data, supplemental information and subsystem engineering data is 62 Mbps.<br />
9
<strong>ASTER</strong> <strong>User</strong>s <strong>Handbook</strong><br />
Figure 3: VNIR Subsystem Design.<br />
2.2 The SWIR Instrument<br />
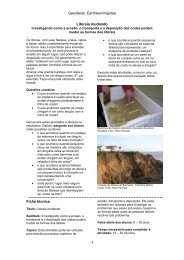
The SWIR subsystem uses a single aspheric refracting telescope (Figure 4). The detector in each<br />
of the six bands is a Platinum Silicide-Silicon (PtSi-Si) Schottky barrier linear array cooled to<br />
80K. A split Stirling cycle cryocooler with opposed compressors and an active balancer to<br />
compensate for the expander displacer provide cooling. The on-orbit design life of this cooler is<br />
50,000 hours. Although <strong>ASTER</strong> operates with a low duty cycle (8% average data collection<br />
time), the cryocooler operates continuously because the cool-down and stabilization time is long.<br />
No cyrocooler has yet demonstrated this length of performance, and the development of this<br />
long-life cooler was one of several major technical challenges faced by the <strong>ASTER</strong> team.<br />
The cryocooler is a major source of heat. Because the cooler is attached to the SWIR telescope,<br />
which must be free to move to provide cross-track pointing, this heat cannot be removed using a<br />
platform provided cold plate. This heat is transferred to a local radiator attached to the cooler<br />
compressor and radiated into space.<br />
Six optical bandpass filters are used to provide spectral separation. No prisms or dichroic<br />
elements are used for this purpose. A calibration device similar to that used for the VNIR<br />
subsystem is used for in-flight calibration. The exception is that the SWIR subsystem has only<br />
one such device.<br />
10
<strong>ASTER</strong> <strong>User</strong>s <strong>Handbook</strong><br />
The NE delta rho will vary from 0.5 to 1.3% across the bands from short to long wavelength.<br />
The absolute radiometric accuracy is +4% or better. The combined data rate for all six SWIR<br />
bands, including supplementary telemetry and engineering telemetry, is 23 Mbps.<br />
Figure 4: SWIR Subsystem Design.<br />
2.3 The TIR Instrument<br />
The TIR subsystem uses a Newtonian catadioptric system with an aspheric primary mirror and<br />
lenses for aberration correction (Figure 5). Unlike the VNIR and SWIR telescopes, the telescope<br />
of the TIR subsystem is fixed with pointing and scanning done by a mirror. Each band uses 10<br />
Mercury-Cadmium-Telluride (HgCdTe) detectors in a staggered array with optical band-pass<br />
filters over each detector element. Each detector has its own pre- and post-amplifier for a total of<br />
50.<br />
As with the SWIR subsystem, the TIR subsystem uses a mechanical split Stirling cycle cooler for<br />
maintaining the detectors at 80K. In this case, since the cooler is fixed, the waste heat it<br />
generates is removed using a platform supplied cold plate.<br />
11
<strong>ASTER</strong> <strong>User</strong>s <strong>Handbook</strong><br />
The scanning mirror functions both for scanning and pointing. In the scanning mode the mirror<br />
oscillates at about 7 Hz. For calibration, the scanning mirror rotates 180 degrees from the nadir<br />
position to view an internal black body which can be heated or cooled. The scanning/pointing<br />
mirror design precludes a view of cold space, so at any one time only a single point temperature<br />
calibration can be effected. The system does contain a temperature controlled and monitored<br />
chopper to remove low frequency drift. In flight, a single point calibration can be done<br />
frequently (e.g., every observation) if necessary. On a less frequent interval, the black body may<br />
be cooled or heated (to a maximum temperature of 340K) to provide a multipoint thermal<br />
calibration. Facility for electrical calibration of the post-amplifiers is also provided.<br />
For the TIR subsystem, the signal-to-noise can be expressed in terms of an NE delta T. The<br />
requirement is that the NE delta T be less than 0.3K for all bands with a design goal of less than<br />
0.2K. The signal reference for NE delta T is a blackbody emitter at 300K. The accuracy<br />
requirements on the TIR subsystem are given for each of several brightness temperature ranges<br />
as follows: 200 - 240K, 3K; 240 - 270K, 2K; 270 - 340K, 1K; and 340 - 370K, 2K.<br />
The total data rate for the TIR subsystem, including supplementary telemetry and engineering<br />
telemetry, is 4.2 Mbps. Because the TIR subsystem can return useful data both day and night, the<br />
duty cycle for this subsystem is set at 16%. The cryocooler, like that of the SWIR subsystem,<br />
operates with a 100% duty cycle.<br />
12
<strong>ASTER</strong> <strong>User</strong>s <strong>Handbook</strong><br />
Figure 5: TIR Subsystem Design.<br />
13
3.0 <strong>ASTER</strong> Level-1 Data<br />
The <strong>ASTER</strong> instrument produces two types of Level-1 data: Level-1A (L1A) and Level-1B<br />
(L1B). <strong>ASTER</strong> L1A data are formally defined as reconstructed, unprocessed instrument data at<br />
full resolution. They consist of the image data, the radiometric coefficients, the geometric<br />
coefficients and other auxiliary data without applying the coefficients to the image data, thus<br />
maintaining original data values. The L1B data are generated by applying these coefficients for<br />
radiometric calibration and geometric resampling.<br />
All acquired image data are processed to L1A. On-board storage limitations on the spacecraft<br />
limit <strong>ASTER</strong>’s acquisition to about 650 L1A scenes per day. A maximum of 310 scenes per day<br />
are processed to L1B based on cloud coverage. The end-to-end flow of data, from upload of<br />
daily acquisition schedules to archiving at the LP-DAAC, is shown in Figure 6. The major steps<br />
involved in the processing of Level-1 data can be summarized thus:<br />
• The one-day acquisition schedule is generated in Japan at <strong>ASTER</strong> GDS with inputs from<br />
both US and Japan, and is sent to the EOS Operations Center (EOC) at the Goddard<br />
Spaceflight Center (GSFC).<br />
• The one-day acquisition schedule is uplinked to Terra, and data are accordingly acquired.<br />
• Terra transmits the Level-0 data via the Tracking and Data Relay Satellite System<br />
(TDRSS), to ground receiving stations at White Sands, New Mexico in the US.<br />
• These data are shipped on tape to the EOS Data Operations System (EDOS) at GSFC.<br />
• EDOS, following some minimal pre-processing, ships the data on tapes (by air) to<br />
<strong>ASTER</strong> GDS in Tokyo, Japan<br />
• GDS processes Level-0 to Level-0A in the Front-End Processing Module which includes:<br />
o Depacketizing Level-0 Data: a depacketizing function to recover the instrument<br />
source data. The packets for each group are depacketized and aligned to recover<br />
the instrument source data using a sequential counter, flags in the primary header,<br />
and time tags in the secondary header. The spectral band information in the<br />
instrument source data is multiplexed with the image in Band Interleaved by Pixel<br />
(BIP) format.<br />
o Demultiplexing Instrument Source Data: a demultiplexing function to separate<br />
image data into spectral bands in BSQ format. The instrument source data are<br />
demultiplexed to separate image data for every spectral band in BSQ format.<br />
Each (Level-0A) data group (VNIR, SWIR, & TIR) contains image data,<br />
instrument supplementary data, & spacecraft ancillary data.<br />
o SWIR and TIR Image Data Stagger Realignment: SWIR and TIR image data are<br />
re-aligned to compensate for a staggered configuration. The SWIR parallax error<br />
is caused by the offset in the detector alignment in the along-track direction. The<br />
parallax correction is done with a combination of image matching correlation and<br />
DEM methods.<br />
o Geometric system correction: Coordinate transformation of the line of sight vector<br />
using the ancillary information from the instrument supplementary data and<br />
spacecraft ancillary data to identify the observation points in latitude/longitude<br />
coordinates on the Earth’s surface defined by the WGS84 Earth model.
<strong>ASTER</strong> <strong>User</strong>s <strong>Handbook</strong><br />
o Radiometric coefficients are generated using real temperature values in the<br />
instrument supplementary data.<br />
• <strong>ASTER</strong> GDS ships the final <strong>ASTER</strong> L1A and L1B data on tapes (by air) to the<br />
LP-DAAC for archiving, distribution, and processing to higher level data products.<br />
15
Figure 6: End-to-End Processing Flow of <strong>ASTER</strong> data between US and Japan.
<strong>ASTER</strong> <strong>User</strong>s <strong>Handbook</strong><br />
3.1 <strong>ASTER</strong> Level-1A Data<br />
The <strong>ASTER</strong> Level-1A raw data are reconstructed from Level-0, and are unprocessed instrument<br />
digital counts. This product contains depacketized, demultiplexed and realigned instrument<br />
image data with geometric correction coefficients and radiometric calibration coefficients<br />
appended but not applied. These coefficients include correcting for SWIR parallax as well as<br />
inter- and intra-telescope registration. (The SWIR parallax error is caused by the offset in<br />
detector alignment in the along-track direction and depends on the distance between the<br />
spacecraft and the observed earth surface. For SWIR bands the parallax corrections are carried<br />
out with the image matching technique or the coarse DEM data base, depending on cloud cover).<br />
The spacecraft ancillary and instrument engineering data are also included. The radiometric<br />
calibration coefficients, consisting of offset and sensitivity information, are generated from a<br />
database for all detectors, and are updated periodically. The geometric correction is the<br />
coordinate transformation for band-to-band co-registration. The VNIR and SWIR data are 8-bit<br />
and have variable gain settings. The TIR data are 12-bit with a single gain. The structure of the<br />
data inside a Level-1A product is illustrated in Figure 7. This is in HDF-EOS format.<br />
3.1.1 <strong>ASTER</strong> Level-1A Browse<br />
The <strong>ASTER</strong> Level-1A also contains browse images for each of the three sensors. The browse<br />
product contains 1-scene of image data generated based on the Level-1A data with similar<br />
radiometric corrections and mis-registration corrections applied to Level-1B data. All image<br />
data (VNIR, SWIR, TIR) are 24-bit JPEG compressed images stored in an HDF file in RIS24<br />
objects. The following table (Table 2) provides the main characteristics of the Level-1A browse<br />
images:<br />
Telescope Dimensions Compression Quality Blue Green Red<br />
(pixel x line) Method Factor<br />
VNIR 224x208 JPEG 50 Band 1 Band 2 Band 3N<br />
SWIR 224x208 JPEG 50 Band 4 Band 5 Band 9<br />
TIR 224x208 JPEG 50 Band 10 Band 12 Band 14<br />
Table 2: Specifications of the <strong>ASTER</strong> Level-1A Browse Product.<br />
17
<strong>ASTER</strong> Level-1A <strong>User</strong>s <strong>Handbook</strong> Data Granule<br />
Data Directory<br />
Generic Header<br />
Cloud Coverage Table<br />
Ancillary Data<br />
VNIR Data<br />
VNIR-Specific Header<br />
VNIR Band 1<br />
VNIR Band 2<br />
VNIR Band 3N<br />
VNIR Band 3B<br />
VNIR Supplementary Data<br />
VNIR Image Data<br />
Radiometric Correction Table<br />
Geometric Correction Table<br />
SWIR Data<br />
VNIR-Specific Header<br />
SWIR Band 4<br />
SWIR Band 5<br />
SWIR Band 6<br />
SWIR Band 7<br />
SWIR Band 8<br />
SWIR Band 9<br />
SWIR Image Data<br />
Radiometric Correction Table<br />
Geometric Correction Table<br />
SWIR Supplementary Data<br />
TIR Data<br />
TIR-Specific Header<br />
TIR Band 10<br />
TIR Band 11<br />
TIR Band 12<br />
TIR Band 13<br />
TIR Band 14<br />
TIR Image Data<br />
Radiometric Correction Table<br />
Geometric Correction Table<br />
TIR Supplementary Data<br />
Figure 7: Data Structure of an <strong>ASTER</strong> Level-1A Data Granule.<br />
18
<strong>ASTER</strong> <strong>User</strong>s <strong>Handbook</strong><br />
3.2 <strong>ASTER</strong> Level-1B Data<br />
The <strong>ASTER</strong> Level-1B data are L1A data with the radiometric and geometric coefficients<br />
applied. All of these data are stored together with metadata in one HDF file. The L1B image is<br />
projected onto a rotated map (rotated to “path oriented” coordinate) at full instrument<br />
resolutions. The Level-1B data generation also includes registration of the SWIR and TIR data to<br />
the VNIR data. And in addition, for SWIR in particular, the parallax errors due to the spatial<br />
locations of all of its bands are corrected. Level-1B data define a scene center as the geodetic<br />
center of the scene obtained from the L1A attribute named “SceneCenter” in the HDF-EOS<br />
attribute “productmetadata.0”. The definition of scene center in L1B is the actual center on the<br />
rotated coordinates (L1B coordinates) not the same as in L1A.<br />
The structure of the L1B data file is shown schematically in Figure 8. This illustration is for the<br />
product generated when the instrument is operated in full mode (all systems are on and acquiring<br />
data). In other restricted modes, e.g. just SWIR and TIR, not all the items listed in Figure 8 are<br />
included in the product.<br />
3.2.1 <strong>ASTER</strong> Level-1B Browse<br />
The <strong>ASTER</strong> Level-1B data sets do not have dedicated browse images of their own. Their<br />
browse link maps back to their <strong>ASTER</strong> Level-1A parent’s browse images. Occasionally, there<br />
are instances when an L1B browse link is grayed out or inactive. This happens under two<br />
circumstances: one, the L1B data set was sent from GDS to LP-DAAC ahead of the L1A parent,<br />
or two, the LP-DAAC archive has not yet received the corresponding L1A parents.<br />
19
<strong>ASTER</strong> <strong>User</strong>s <strong>Handbook</strong><br />
<strong>ASTER</strong> Level-1B Data Granule<br />
Data Directory<br />
Generic Header<br />
Cloud Coverage Table<br />
Ancillary Data<br />
VNIR Data<br />
VNIR-Specific Header<br />
VNIR Band 1<br />
VNIR Band 2<br />
VNIR Band 3N<br />
VNIR Band 3B<br />
VNIR Image Data<br />
VNIR Supplementary Data<br />
VNIR-Specific Header<br />
SWIR Data<br />
SWIR Band 4<br />
SWIR Band 5<br />
SWIR Band 6<br />
SWIR Band 7<br />
SWIR Band 8<br />
SWIR Band 9<br />
SWIR Image Data<br />
SWIR Supplementary Data<br />
TIR-Specific Header<br />
TIR Data<br />
TIR Band 10<br />
TIR Band 11<br />
TIR Band 12<br />
TIR Band 13<br />
TIR Band 14<br />
TIR Image Data<br />
Geolocation Field Data<br />
TIR Supplementary Data<br />
Figure 8: Data Structure of an <strong>ASTER</strong> Level-1B Data Granule.<br />
20
<strong>ASTER</strong> <strong>User</strong>s <strong>Handbook</strong><br />
The L1B data product is generated, by default, in UTM projection in swath orientation, and<br />
Cubic Convolution resampling. An L1B in a different projection and/or resampling method can<br />
be produced on request from GDS in Japan (Table 2).<br />
Table 2: Resampling Methods and Projections Available for Producing Level-1B<br />
products.<br />
Resampling methods<br />
Nearest Neighbor (NN)<br />
Cubic Convolution (CC)<br />
Bi-Linear (BL)<br />
Map Projections<br />
Geographic (EQRECT)<br />
Lambert Conformal Conic (LAMCC)<br />
Space Oblique Mercator (SOM)<br />
Polar Stereographic (PS)<br />
Universal Transverse Mercator (UTM)<br />
Each image contains geolocation information stored as a series of arrays. There is one set of<br />
geolocation information (array) per nadir telescope (3 sets total). Each geolocation array is 11 x<br />
11 elements size, with the top left element (0,0) in the image for the nadir views. For the<br />
backward view the image is offset with respect to the geolocation array. The nadir VNIR and<br />
backward-viewing VNIR images use the same latitude/longitude array, except the backwardviewing<br />
image is offset with respect to the nadir image.<br />
The L1B latitude and longitude geolocation arrays are two 11 x 11 matrices of geocentric<br />
latitude and geodetic longitude in units of degrees. The block size of the geolocation array is 420<br />
lines by 498 samples for the VNIR bands; 210 lines by 249 samples for the SWIR bands; and 70<br />
lines by 83 samples for the TIR bands.<br />
Appendix I provides a dump of the metadata contained in a L1B data product. There are five<br />
metadata groups:<br />
Productmetadata.0<br />
Productmetadata.1<br />
Productmetadata.V<br />
Productmetadata.S<br />
Productmetadata.T<br />
…………….<br />
21
<strong>ASTER</strong> <strong>User</strong>s <strong>Handbook</strong><br />
4.0 <strong>ASTER</strong> Higher-Level Products<br />
Table 3 lists each of the <strong>ASTER</strong> higher-level Standard Data Products and some of their basic<br />
characteristics. More detailed descriptions of these data products are given in Appendix II.<br />
Short Name Level Parameter<br />
Name<br />
Production<br />
Mode<br />
Units<br />
Absolute<br />
Accuracy<br />
Relative<br />
Accuracy<br />
Horizontal<br />
Resolution<br />
(m)<br />
AST_06V<br />
AST_06S<br />
AST_06T<br />
AST_04<br />
AST_07<br />
AST_09<br />
2 Decorrelation<br />
stretch -VNIR<br />
2 Decorrelation<br />
stretch -SWIR<br />
2 Decorrelation<br />
stretch -TIR<br />
2 Brightness<br />
temperature<br />
2 Surface<br />
reflectance<br />
VNIR,SWIR<br />
2 Surface radiance<br />
-VNIR, SWIR<br />
routine none N/A N/A 15<br />
routine none N/A N/A 30<br />
routine none N/A N/A 90<br />
ondemand<br />
ondemand<br />
ondemand<br />
degrees C 1-2 C 0.3 C 90<br />
none 4% 1% 15, 30<br />
W/m 2 /sr/<br />
µm<br />
2% 1% 15, 30<br />
AST_09T<br />
AST_05<br />
AST_08<br />
AST13POL<br />
2 Surface radiance<br />
-TIR<br />
2 Surface<br />
emissivity<br />
2 Surface kinetic<br />
temperature<br />
2 Polar surface and<br />
cloud classification<br />
ondemand<br />
ondemand<br />
ondemand<br />
ondemand<br />
W/m 2 /sr/ 2% 1% 90<br />
µm<br />
none 0.05-0.1 0.005 90<br />
degrees K 1-4 K 0.3 K 90<br />
none 3% 3% 15, 30,<br />
90<br />
AST14DEM<br />
3 Digital elevation<br />
model (DEM)<br />
ondemand<br />
m >= 7 m >= 10 m 30<br />
Table 3: <strong>ASTER</strong> Higher-Level Standard Data Products.<br />
22
<strong>ASTER</strong> <strong>User</strong>s <strong>Handbook</strong><br />
5.0 <strong>ASTER</strong> Radiometry<br />
The <strong>ASTER</strong> Level-1B data are offered in terms of scaled radiance. To convert from DN to<br />
radiance at the sensor, the unit conversion coefficients (defined as radiance per 1 DN) are used.<br />
Radiance (spectral radiance) is expressed in unit of W/(m 2 *sr*µm). The relation between DN<br />
values and radiances is shown below:<br />
(i)<br />
(ii)<br />
(iii)<br />
(iv)<br />
(v)<br />
(vi)<br />
a DN value of zero is allocated to dummy pixels<br />
a DN value of 1 is allocated to zero radiance<br />
a DN value of 254 is allocated to the maximum radiance for VNIR and SWIR<br />
bands<br />
a DN value of 4094 is allocated to the maximum radiance for TIR bands<br />
a DN value of 255 is allocated to saturated pixels for VNIR and SWIR bands<br />
a DN value of 4095 is allocated to saturated pixels for TIR bands<br />
The maximum radiances depend on both the spectral bands and the gain settings and are<br />
shown in Table 4.<br />
Band No.<br />
1<br />
2<br />
3N<br />
3B<br />
4<br />
5<br />
6<br />
7<br />
8<br />
9<br />
10<br />
11<br />
12<br />
13<br />
14<br />
Maximum radiance (W/(m 2 *sr*µm)<br />
High gain Normal Low Gain 1 Low gain 2<br />
Gain<br />
170.8<br />
427<br />
569<br />
N/A<br />
179.0<br />
358<br />
477<br />
106.8<br />
218<br />
290<br />
106.8<br />
218<br />
290<br />
27.5<br />
8.8<br />
7.9<br />
7.55<br />
5.27<br />
4.02<br />
55.0<br />
17.6<br />
15.8<br />
15.1<br />
10.55<br />
8.04<br />
N/A 28.17<br />
27.75<br />
26.97<br />
23.30<br />
21.38<br />
73.3<br />
23.4<br />
21.0<br />
20.1<br />
14.06<br />
10.72<br />
N/A<br />
73.3<br />
103.5<br />
98.7<br />
83.8<br />
62.0<br />
67.0<br />
N/A<br />
Table 4: Maximum Radiance Values for all <strong>ASTER</strong> Bands and all Gains.<br />
The radiance can be obtained from DN values as follows:<br />
Radiance = (DN value – 1) x Unit conversion coefficient<br />
Table 5 shows the unit conversion coefficients of each band<br />
23
<strong>ASTER</strong> <strong>User</strong>s <strong>Handbook</strong><br />
Band No.<br />
1<br />
2<br />
3N<br />
3B<br />
4<br />
5<br />
6<br />
7<br />
8<br />
9<br />
10<br />
11<br />
12<br />
13<br />
14<br />
Coefficient (W/(m 2 *sr*µm)/DN)<br />
High gain Normal<br />
Gain<br />
0.676<br />
1.688<br />
0.708<br />
1.415<br />
0.423<br />
0.862<br />
0.423<br />
0.862<br />
0.1087<br />
0.0348<br />
0.0313<br />
0.0299<br />
0.0209<br />
0.0159<br />
0.2174<br />
0.0696<br />
0.0625<br />
0.0597<br />
0.0417<br />
0.0318<br />
Low Gain 1 Low gain 2<br />
2.25<br />
1.89<br />
1.15<br />
1.15<br />
0.290<br />
0.0925<br />
0.0830<br />
0.0795<br />
0.0556<br />
0.0424<br />
N/A<br />
0.290<br />
0.409<br />
0.390<br />
0.332<br />
0.245<br />
0.265<br />
N/A N/A<br />
N/A 6.822 x 10 -3<br />
5.225 x 10 -3<br />
6.780 x 10 -3<br />
6.590 x 10 -3<br />
5.693 x 10 -3<br />
Table 5: Calculated Unit Conversion Coefficients.<br />
(Note: These values are given in the telescope-specific metadata – see Appendix I)<br />
24
<strong>ASTER</strong> <strong>User</strong>s <strong>Handbook</strong><br />
6.0 <strong>ASTER</strong> Geometry<br />
<strong>ASTER</strong>’s geometric system correction primarily involves the rotation and the coordinate<br />
transformation of the line of sight vectors of the detectors to the coordinate system of the Earth.<br />
This is done as part of <strong>ASTER</strong> Level-1 processing at GDS using engineering data from the<br />
instrument (called supplementary data) and similar data from the spacecraft platform (called<br />
ancillary data). The geometric correction of <strong>ASTER</strong> data has evolved through elaborate<br />
processes of both pre-flight and post-launch calibration.<br />
Pre-Flight Calibration<br />
This is an off-line process to generate geometric parameters such as Line of Sight (LOS) vectors<br />
of the detectors and pointing axes information evaluated toward the Navigation Base Reference<br />
(NBR) of the spacecraft deemed to reflect on the instrument accuracy & stability. These data are<br />
stored in the geometric system correction database.<br />
Post-Launch Calibration<br />
Following launch of <strong>ASTER</strong>, these parameters are being corrected through validation using<br />
Ground Control Points (GCPs) and inter-band image matching techniques. Geometric system<br />
correction in the post-launch phase entails the following processes:<br />
• Pointing correction<br />
• Coordinate transformation from spacecraft coordinates to the orbital coordinates<br />
• Coordinate transformation from orbital coordinates to the earth’s inertial coordinates<br />
• Coordinate transformation from earth’s inertial coordinates to Greenwich coordinates<br />
• Improving Band-to-Band registration accuracy through image-matching involves 2<br />
processes:<br />
o SWIR parallax correction<br />
o Inter-telescope registration process<br />
Based on current knowledge, the geometric performance parameters of <strong>ASTER</strong> are summarized<br />
in Table 6.<br />
25
<strong>ASTER</strong> <strong>User</strong>s <strong>Handbook</strong><br />
Parameter<br />
Version 2.1 Geometric Db<br />
Intra-Telescope Registration VNIR < 0.1 pixel<br />
SWIR<br />
< 0.1 pixel<br />
TIR<br />
< 0.1 pixel<br />
Inter-Telescope Registration SWIR/VNIR < 0.2 pixel<br />
TIR/VNIR<br />
< 0.2 pixel<br />
Stereo Pair System Error Band 3B/3N < 10 m<br />
Pixel Geolocation Knowledge* Relative < 15 m<br />
Absolute<br />
< 50 m<br />
* Not Terrain-Corrected<br />
Table 6: Geometric Performance of <strong>ASTER</strong> Level-1 Data (Based on V2.1 of the Geometric<br />
Correction Database).<br />
Geometric System Correction Database<br />
There is an evolving geometric system correction database that is maintained at GDS. This<br />
database provides the geometric correction coefficients that are applied to produce the Level-1B<br />
data. The geometric correction reference in an <strong>ASTER</strong> Level-1 data set is provided in both the<br />
HDF and ECS metadata. In the HDF file, this is present as the GeometricDBVersion value in<br />
the ProductMetadata.0 block. In the ECS .met file, the same attribute name and value are present<br />
as part of the granule-level metadata. The evolving versions of the GeometricDBVersions till<br />
date have been 01.00, 01.01, 01.02, 02.00 and 02.05.<br />
26
<strong>ASTER</strong> <strong>User</strong>s <strong>Handbook</strong><br />
7.0 Data Acquisition Strategy<br />
<strong>ASTER</strong> was not designed to continuously acquire data, and hence each day’s data acquisitions<br />
must be scheduled and prioritized. The <strong>ASTER</strong> Science Team has developed a data acquisition<br />
strategy to make use of the available resources. Acquisition requests are divided into three<br />
categories: local observations, regional monitoring, and global map.<br />
Local Observations<br />
Local Observations are made in response to data acquisition requests from authorized <strong>ASTER</strong><br />
<strong>User</strong>s. Local Observations might include, for example, scenes for analyzing land use, surface<br />
energy balance, or local geologic features.<br />
One subset of Local Observations consists of images of such ephemeral events as volcanoes,<br />
floods, or fires. Requests for "urgent observations" of such phenomena must be fulfilled in short<br />
time periods (of a few days). These requests receive special handling.<br />
Regional Monitoring Data<br />
Regional data sets contain the data necessary for analysis of a large region (often many regions<br />
scattered around the Earth) or a region requiring multi-temporal analysis. A "Local Observation"<br />
data set and a "Regional Monitoring" data set are distinguished by the amount of viewing<br />
resources required to satisfy the request, where smaller requirements are defined as Local<br />
Observations and larger requirements are defined as Regional Monitoring. The <strong>ASTER</strong> Science<br />
Team has already selected a number of Regional Monitoring tasks. Among the most significant<br />
are three that involve repetitive imaging of a class of surface targets:<br />
1. The world's mountain glaciers,<br />
2. The world's active and dormant volcanoes, and<br />
3. The Long-Term Ecological Research (LTER) field sites.<br />
Global Map<br />
The Global data set will be used by investigators of every discipline to support their research.<br />
The high spatial resolution of the <strong>ASTER</strong> Global Map will complement lower resolution data<br />
acquired more frequently by other EOS instruments. This data set will include images of the<br />
entire Earth’s land surface, in all <strong>ASTER</strong> spectral bands and stereo.<br />
Each region of the Earth has been prioritized by the <strong>ASTER</strong> Science Team for observation as<br />
part of the Global Map. Currently the following characteristics have been identified for images<br />
in the Global Map data set:<br />
27
<strong>ASTER</strong> <strong>User</strong>s <strong>Handbook</strong><br />
• One-time coverage<br />
• High sun angle<br />
• Optimum gain for the local land surface<br />
• Minimum snow and ice cover<br />
• Minimum vegetation cover, and<br />
• No more than 20% cloud cover (perhaps more for special sub-regions).<br />
Allocation of Science Data<br />
At the present time, it is expected that approximately 25% of <strong>ASTER</strong> resources will be allocated<br />
to Local Observations, 50% to Regional Monitoring, and 25% to the Global Map.<br />
Global Map data has been further sub-divided among high priority areas which are currently<br />
allocated 25%, medium priority areas which are currently allocated 50%, and low priority areas<br />
which are currently allocated 25%.<br />
Regional Monitoring data sets and the Global Map will be acquired by <strong>ASTER</strong> in response to<br />
acquisition requests submitted by the <strong>ASTER</strong> Science Team acting on behalf of the science<br />
community. These Science Team Acquisition Requests (STARs) are submitted directly to the<br />
<strong>ASTER</strong> Ground Data System in Japan. Under limited circumstances, STARs for Local<br />
Observations may also be submitted by the Science Team.<br />
STARs for Regional Monitoring data are submitted by the <strong>ASTER</strong> Science Team only after a<br />
proposal for the Regional Monitoring task has been submitted and accepted. These "STAR<br />
Proposals" will be evaluated by <strong>ASTER</strong>'s science working groups before being formally<br />
submitted to the Science Team.<br />
An already-authorized <strong>ASTER</strong> <strong>User</strong>, who wants <strong>ASTER</strong> to acquire far more data than he or she<br />
is allocated, may submit a STAR Proposal to the Science Team. Please note that the process for<br />
evaluating STAR proposals is cumbersome and time-consuming. Far fewer STAR Proposals<br />
will be approved than <strong>ASTER</strong> <strong>User</strong> Authorization Proposals.<br />
28
<strong>ASTER</strong> <strong>User</strong>s <strong>Handbook</strong><br />
8.0 <strong>ASTER</strong> Data Search and Order of Archived Data and Products<br />
The EOSDIS at the LP-DAAC archives and distributes <strong>ASTER</strong> Level-1A, Level-1B,<br />
Decorrelation Stretch and DEM products. All other products are produced on demand. The<br />
steps to access the EOS Data Gateway (EDG) web site for archived products, and a tutorial on<br />
how to use it are described below. See the following sections for higher level, on-demand<br />
products. There is also another on-line tutorial that is available on the EOS Data Gateway for<br />
beginning users: http://edcdaac.usgs.gov/tutorial/<br />
1: Begin Search and Order Session<br />
Log on to the EOS Data Gateway to begin your search and order session.<br />
(http://edcimswww.cr.usgs.gov/pub/imswelcome/)<br />
New users may click the 'Enter as guest' link (Figure 9). If you are a registered user, you may<br />
continue to use your account by clicking the 'Enter as a registered user' link and login as before.<br />
Should you wish to register, click the 'Become a registered user' link and follow the registration<br />
prompts. This will take you to the 'Primary Data Search' screen. Registering will allow the<br />
system to remember your shipping information. It is absolutely not necessary to register in order<br />
to search and order.<br />
9.0 <strong>ASTER</strong> Higher-Level Data Products Ordering Mechanism<br />
All the higher-level (Level-2) <strong>ASTER</strong> geophysical products (except absolute and relative DEMs)<br />
are produced using an <strong>ASTER</strong>-L1B as its input. The routinely-produced on-demand products<br />
including their Long and Short names are:<br />
Routinely-Produced Level-2 Products<br />
1. <strong>ASTER</strong> L2 Decorrelation Stretch (VNIR) AST_06V<br />
2. <strong>ASTER</strong> L2 Decorrelation Stretch (SWIR) AST_06S<br />
3. <strong>ASTER</strong> L2 Decorrelation Stretch (TIR) AST_06T<br />
You can search, browse and order these products from the EOS Data Gateway.<br />
On-Demand Level-2 Products<br />
1. <strong>ASTER</strong> On-Demand L2 Decorrelation Stretch (VNIR) AST_06VD<br />
2. <strong>ASTER</strong> On-Demand L2 Decorrelation Stretch (SWIR) AST_06SD<br />
3. <strong>ASTER</strong> On-Demand L2 Decorrelation Stretch (TIR) AST_06TD<br />
4. <strong>ASTER</strong> On-Demand L2 Brightness Temperature at the Sensor AST_04<br />
5. <strong>ASTER</strong> On-Demand L2 Emissivity AST_05<br />
6. <strong>ASTER</strong> On-Demand L2 Surface Reflectance (VNIR & SWIR) AST_07<br />
7. <strong>ASTER</strong> On-Demand L2 Surface Kinetic Temperature AST_08<br />
29
<strong>ASTER</strong> <strong>User</strong>s <strong>Handbook</strong><br />
8. <strong>ASTER</strong> On-Demand L2 Surface Radiance (VNIR & SWIR) AST_09<br />
9. <strong>ASTER</strong> On-Demand L2 Surface Radiance (TIR) AST_09T<br />
10. <strong>ASTER</strong> On-Demand L2 Polar Surface & Cloud Classification AST13POL<br />
You can order these on-demand products using the <strong>ASTER</strong> On-Demand Gateway. You will be<br />
led there through a link (Order higher-level product) on the EDG’s Level-1B granules search<br />
page next to the granule-listing column. This site allows you to select a product (such as<br />
reflectance), and either accept the default parameters, or customize by selecting appropriate<br />
alternative options. There is a brief on-line tutorial for beginning users on how to place an order<br />
for <strong>ASTER</strong> on-demand products: http://edcdaac.usgs.gov/asterondemand/aod_tutorial.html<br />
On-Demand Level-3 Products<br />
1. <strong>ASTER</strong> Digital Elevation Model (DEM) AST14DEM<br />
The only Level-3 products generated from an <strong>ASTER</strong> L1A data set are:<br />
• An Absolute Digital Elevation Model (DEM). This product requires you to submit<br />
Ground Control Points (GCPs) for your area of interest. To accomplish this, you must<br />
first order the L1A data, locate your GCP’s on both the 3N and 3B images, and supply<br />
these pixel coordinates along with the GCP coordinate locations.<br />
• A Relative DEM. This does not require a requestor to provide GCPs. You only have to<br />
copy and paste the L1A Granule ID in the appropriate place on the on-demand product<br />
order page, and submit the order.<br />
You can order on-demand DEMs using the <strong>ASTER</strong> On-Demand Gateway. You will be led<br />
there through a link (Order custom DEM.) on the EDG’s Level-1A granules search page next to<br />
the granule-listing column. Follow the instructions there to order a relative or absolute DEM.<br />
Archived Level-3 DEM Products<br />
You can search for and order archived DEMs from the EOS Data Gateway by selecting the<br />
<strong>ASTER</strong> Digital Elevation Model data set.<br />
10.0 Data Acquisition Requests<br />
Data Acquisition Requests (DARs) are user requests to have <strong>ASTER</strong> acquire new data over a<br />
particular site at specified times. If the desired <strong>ASTER</strong> observations have not yet been acquired<br />
or even requested, a requestor can become an authorized <strong>ASTER</strong> <strong>User</strong>, and can submit a data<br />
acquisition request (DAR) via the DAR Tool. To register as an authorized <strong>ASTER</strong> <strong>User</strong>, use the<br />
link below which will take you to the web site for registering, and explains the procedure:<br />
http://asterweb.jpl.nasa.gov/gettingdata/authorization/default.htm<br />
Once you are registered, you can go to the on-line <strong>ASTER</strong> DAR Tool web site to enter your<br />
request:<br />
30
<strong>ASTER</strong> <strong>User</strong>s <strong>Handbook</strong><br />
http://e0ins02u.ecs.nasa.gov:10400/<br />
Be sure to read the “Getting Started” information for help on using the tool, and getting any<br />
plug-ins if necessary.<br />
31