Track Record 1, August to December 1999 - Public Transport Victoria
Track Record 1, August to December 1999 - Public Transport Victoria
Track Record 1, August to December 1999 - Public Transport Victoria
You also want an ePaper? Increase the reach of your titles
YUMPU automatically turns print PDFs into web optimized ePapers that Google loves.
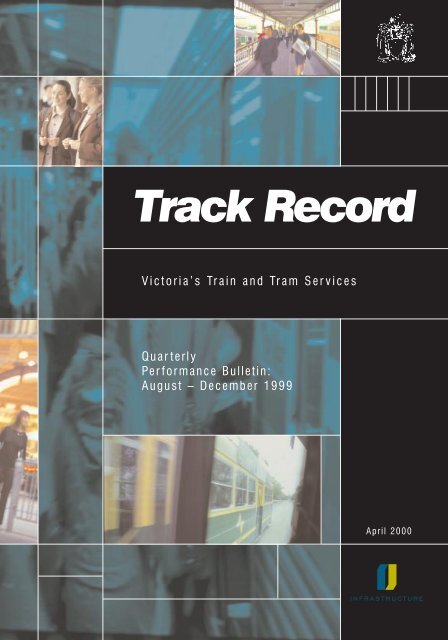
<strong>Track</strong> <strong>Record</strong><br />
Vic<strong>to</strong>ria’s Train and Tram Services<br />
Quarterly<br />
Performance Bulletin:<br />
<strong>August</strong> – <strong>December</strong> <strong>1999</strong><br />
April 2000
CONTENTS<br />
Page<br />
SECTION 1.<br />
INTRODUCTION AND SUMMARY<br />
1.1 Introduction by the Minister for <strong>Transport</strong> 1<br />
1.2 Background 2<br />
1.3 Results 2<br />
SECTION 2.<br />
PUNCTUALITY AND RELIABILITY<br />
2.1 Operational performance regime 3<br />
2.2 Punctuality 3<br />
2.3 Reliability 4<br />
SECTION 3.<br />
PAYMENTS TO AND FROM FRANCHISEES<br />
3.1 Performance incentives and penalties 7<br />
3.2 Other payments <strong>to</strong> franchisees 7<br />
3.3 Total payments 8<br />
SECTION 4.<br />
CUSTOMER SATISFACTION<br />
4.1 Cus<strong>to</strong>mer satisfaction surveys 9<br />
4.2 Overall satisfaction 9<br />
4.3 Key aspects of service quality 10<br />
OBTAINING COPIES OF TRACK RECORD 12<br />
FEEDBACK 13
<strong>Track</strong> <strong>Record</strong><br />
Vic<strong>to</strong>ria’s Train and Tram Services<br />
‘The Bracks Government is committed <strong>to</strong> making<br />
private transport opera<strong>to</strong>rs properly accountable<br />
<strong>to</strong> passengers and taxpayers.’<br />
Peter Batchelor,<br />
Minister for <strong>Transport</strong>
SECTION 1.<br />
INTRODUCTION AND SUMMARY<br />
1.1 Introduction by Peter Batchelor, Vic<strong>to</strong>rian Minister for <strong>Transport</strong><br />
This is the first <strong>Track</strong> <strong>Record</strong> bulletin, providing information about the punctuality and<br />
reliability of Vic<strong>to</strong>ria’s privatised train and tram services in <strong>1999</strong>.<br />
<strong>Track</strong> <strong>Record</strong> is a new initiative by the Bracks Government. It will be published every<br />
three months and will help drive improved performance by private transport opera<strong>to</strong>rs.<br />
The Bracks Government is committed <strong>to</strong> making private transport opera<strong>to</strong>rs properly<br />
accountable <strong>to</strong> passengers and taxpayers.<br />
<strong>Track</strong> <strong>Record</strong> will provide the community with detailed information on the individual<br />
performance of the public transport companies. It will report on:<br />
––– each opera<strong>to</strong>r’s success or failure in meeting government-set performance targets on punctuality and reliability<br />
––– penalties imposed on any opera<strong>to</strong>r for failing <strong>to</strong> meet targets<br />
––– bonuses paid <strong>to</strong> any opera<strong>to</strong>r for exceeding targets<br />
––– public opinion surveys on levels of cus<strong>to</strong>mer satisfaction with service quality.<br />
For the first time, the community will have accurate information on how punctual and reliable each opera<strong>to</strong>r’s services are.<br />
<strong>Track</strong> <strong>Record</strong> will compare their performance <strong>to</strong> previous quarters. It will also summarise key financial information about<br />
the opera<strong>to</strong>rs’ franchise contracts, including subsidies paid by the Government.<br />
In this first issue, for example, <strong>Track</strong> <strong>Record</strong> reports that Yarra Trams, Swans<strong>to</strong>n Trams and V/Line Passenger paid penalties<br />
<strong>to</strong>talling $1.5 million from <strong>August</strong> <strong>to</strong> <strong>December</strong> <strong>1999</strong>. These three private opera<strong>to</strong>rs improved performance, but still failed<br />
<strong>to</strong> meet targets. Hillside Trains and Bayside Trains received bonuses <strong>to</strong>talling $1.9 million, reflecting significant<br />
improvements in their performance (a full summary of the key results appears on p. 4).<br />
Vic<strong>to</strong>ria’s public transport system was privatised by the Kennett Government in <strong>August</strong> <strong>1999</strong>. The then Government signed<br />
franchise contracts with private companies giving them responsibility for the management and operation of Vic<strong>to</strong>ria’s rail,<br />
tram and bus services for between 10 and 15 years.<br />
Within this framework, the Bracks Government is committed <strong>to</strong> maintaining and improving Vic<strong>to</strong>ria’s public transport<br />
system, and ensuring the new private opera<strong>to</strong>rs meet the requirements of their contracts.<br />
The range of <strong>to</strong>pics covered in each <strong>Track</strong> <strong>Record</strong> bulletin is likely <strong>to</strong> vary over time. This issue particularly addresses train<br />
and tram services. Future bulletins will contain more information on bus services. <strong>Track</strong> <strong>Record</strong> will be distributed free of<br />
charge on request.<br />
The last page of this bulletin provides an opportunity for you <strong>to</strong> provide feedback <strong>to</strong> the Government on how informative<br />
you found this publication and your opinion about how it could be improved.<br />
1
<strong>Track</strong> <strong>Record</strong><br />
Vic<strong>to</strong>ria’s Train and Tram Services<br />
1.2 Background<br />
On 29 <strong>August</strong> <strong>1999</strong>, responsibility for the day-<strong>to</strong>-day running of Vic<strong>to</strong>ria’s train and tram services passed from the<br />
Government <strong>to</strong> a number of private-sec<strong>to</strong>r companies:<br />
––– Yarra Trams was franchised <strong>to</strong> the MetroLink consortium;<br />
––– Hillside Trains was franchised <strong>to</strong> Melbourne <strong>Transport</strong> Enterprises; and<br />
––– Bayside Trains, Swans<strong>to</strong>n Trams and V/Line Passenger were franchised <strong>to</strong> National Express (Australia).<br />
Each of these companies entered in<strong>to</strong> legally binding ‘franchise’ contracts with the Government for periods of 10 –15<br />
years. These franchises are managed for the Government by John Taylor, the Direc<strong>to</strong>r of <strong>Public</strong> <strong>Transport</strong>, a senior officer in<br />
the Department of Infrastructure. The franchise contracts set out the overall levels of service the companies are expected<br />
<strong>to</strong> provide, the tickets they must offer (including Metcard), the maximum fares they can charge in respect of these tickets,<br />
and other performance standards.<br />
The Bracks Government will moni<strong>to</strong>r the quality of service which franchisees are providing for the community. In particular,<br />
the Government will moni<strong>to</strong>r:<br />
––– Punctuality and reliability – comparing the performance of the train and tram franchisees with government-set<br />
punctuality and service delivery targets<br />
––– Cus<strong>to</strong>mer satisfaction – using passenger surveys <strong>to</strong> measure whether franchisees are providing the quality<br />
service their cus<strong>to</strong>mers expect.<br />
Over the next four years, the Bracks Government will introduce – in partnership with the private transport opera<strong>to</strong>rs - a<br />
range of initiatives <strong>to</strong> significantly upgrade Vic<strong>to</strong>ria’s public transport services.<br />
1.3 Results<br />
2<br />
The key results from this first edition of <strong>Track</strong> <strong>Record</strong> are summarised below:<br />
Key facts and figures<br />
Punctuality up<br />
––– In the last quarter of <strong>1999</strong>, metropolitan trains and trams achieved a level of punctuality (or ‘on-time running’)<br />
which was higher than their performance in the early half of the year.<br />
Train cancellations down<br />
––– The number of cancelled metropolitan trains declined during <strong>1999</strong>, with an average of 0.6 per cent of trains<br />
cancelled in the last quarter of <strong>1999</strong>; about half the rate recorded for the first quarter.<br />
––– V/Line passenger services recorded low average cancellations of 0.2 per cent over the last two quarters of <strong>1999</strong>.<br />
Financial bonuses and penalties<br />
––– The metropolitan train opera<strong>to</strong>rs earned bonuses for a substantial improvement in on-time running and reduced<br />
cancellations compared <strong>to</strong> the Government’s targets. For the four months since franchising, net incentive<br />
payments <strong>to</strong> the metropolitan train opera<strong>to</strong>rs have <strong>to</strong>talled $1.9 million.<br />
––– The tram opera<strong>to</strong>rs and V/Line Passenger have paid penalties <strong>to</strong>talling $1.5 million since franchising. Their<br />
service performance in this period, while generally better than the average performance during 1998, has not<br />
consistently exceeded the targets established by the Government.<br />
Cus<strong>to</strong>mer satisfaction up<br />
––– Satisfaction with public transport services in general has since shown a steadily increasing trend during <strong>1999</strong>.<br />
Satisfaction with metropolitan public transport services recorded its highest ever score of 65.2 in Oc<strong>to</strong>ber <strong>to</strong><br />
<strong>December</strong> <strong>1999</strong>.
SECTION 2.<br />
PUNCTUALITY AND RELIABILITY<br />
2.1 Operational Performance Regime<br />
Every train and tram service in the timetable, every day of the week, is moni<strong>to</strong>red. Delays, cancellations or other service<br />
failures are recorded. These delays, measured <strong>to</strong> the nearest 60 seconds, are ‘weighted’ according <strong>to</strong> the number of people<br />
estimated <strong>to</strong> be travelling on the train or tram in the time period, day of week and direction of travel. Delays <strong>to</strong> a heavily<br />
crowded peak hour train are therefore given a greater value than delays <strong>to</strong> a less occupied train running during the off-peak<br />
period. The end result is a technical measure of operational performance quality, expressed in ‘passenger weighted<br />
minutes of delay’ (PWMs).<br />
‘Passenger weighted minutes’ over each month are added up by the Government and compared <strong>to</strong> targets based on the<br />
past performance of the train and tram companies. If franchisees can beat these government targets, they will receive<br />
financial rewards. If they fail <strong>to</strong> meet the targets, they will be liable for financial penalties.<br />
The targets set by the Government are demanding: in order <strong>to</strong> avoid financial penalties, opera<strong>to</strong>rs must improve their<br />
performance in 1998 by at least 20 per cent. Swans<strong>to</strong>n Trams must improve their 1998 performance by more than 30 per<br />
cent in order <strong>to</strong> earn incentive payments.<br />
2.2 Punctuality<br />
Table 1 below shows the ‘on-time performance’ of each train/tram company for each quarter in <strong>1999</strong>. It records the<br />
proportion of train and tram services which arrived at their destination no more than 59 seconds before* and no more than<br />
5 minutes 59 seconds after the time in the timetable. This is the approach by which train punctuality has traditionally been<br />
measured.<br />
Table 1. On-time performance for trains and trams <strong>1999</strong> - % of services run<br />
Jan.–Mar. Apr.–Jun. Jul.–Sept. Oct.–Dec.<br />
Bayside Trains 93.8 94.0 96.9 97.4<br />
Hillside Trains 93.2 93.2 95.2 97.0<br />
V/Line Passenger 93.2 94.5 95.7 94.5<br />
Swans<strong>to</strong>n Trams 55.5 61.8 70.9 72.6<br />
Yarra Trams 70.7 71.2 75.5 79.8<br />
* For V/Line Passenger, early arrival at the destination has been included in the ‘on-time’ figure, without a 59 second early<br />
cut-off.<br />
These figures are represented graphically in Figures 1 and 2 below.<br />
Figure 1. On-time performance for trains <strong>1999</strong><br />
Percentage of trains running<br />
on time<br />
100<br />
98<br />
96<br />
94<br />
92<br />
90<br />
Jan.-Mar. Apr.-Jun. Jul.-Sept. Oct.-Dec.<br />
Bayside Trains<br />
Hillside Trains<br />
V/Line Passenger<br />
3
<strong>Track</strong> <strong>Record</strong><br />
Vic<strong>to</strong>ria’s Train and Tram Services<br />
Figure 2. On-time performance for trams <strong>1999</strong><br />
Percentage of trams running<br />
on time<br />
100<br />
90<br />
80<br />
70<br />
60<br />
50<br />
40<br />
Jan.-Mar. Apr.-Jun. Jul.-Sept. Oct.-Dec.<br />
Swans<strong>to</strong>n Trams<br />
Yarra Trams<br />
Tram service delivery is measured at five moni<strong>to</strong>ring points on each route. The figures contained in this graph<br />
relate <strong>to</strong> the fourth moni<strong>to</strong>ring point on each route, which is near the end of the journey. (In earlier years, tram punctuality<br />
reporting has been based on moni<strong>to</strong>ring at the start of the journey. This has given higher, but less representative, figures<br />
for service punctuality)<br />
Some of the key conclusions <strong>to</strong> be drawn from these figures are set out below:<br />
Overall punctuality<br />
––– The on-time performance of trains and trams in the last quarter of <strong>1999</strong> was significantly better than the<br />
performance in the first half of the year.<br />
Trains<br />
––– Over the last quarter of <strong>1999</strong>, 97.2 per cent of metropolitan trains ran on time. The average for metropolitan train<br />
on-time running for the first half of <strong>1999</strong> was 93.6 per cent.<br />
––– Over the last quarter of <strong>1999</strong>, 94.5 per cent of V/Line Passenger trains ran on time. This was slightly higher than<br />
the average performance during the first half of the year.<br />
Trams<br />
––– Over the last quarter of <strong>1999</strong>, 74.8 per cent of trams ran on-time (at moni<strong>to</strong>ring point four, near the end of the<br />
trip). The average performance in the first half of the year was 62.3 per cent. This is an improvement of 12.5<br />
percentage points between the two periods.<br />
2.3 Reliability<br />
This section records the proportion of scheduled train and tram services which were cancelled. Table 2 shows the<br />
percentage of services cancelled by each business during the four quarters of <strong>1999</strong>.<br />
Table 2. Cancellations of trains and trams <strong>1999</strong> - % of services scheduled<br />
Jan.–Mar. Apr.–Jun. Jul.–Sept. Oct.–Dec.<br />
Bayside Trains 1.5 0.8 0.5 0.7<br />
Hillside Trains 0.8 0.6 0.4 0.4<br />
V/Line Passenger 0.2 0.3 0.2 0.1<br />
Swans<strong>to</strong>n Trams 0.9 0.6 0.5 0.9<br />
Yarra Trams 0.8 0.4 0.4 0.4<br />
4<br />
These figures are represented graphically in Figures 3 and 4 below.
Figure 3. Cancellations of trains <strong>1999</strong><br />
Percentage of trains services<br />
cancelled<br />
1.5<br />
1.0<br />
0.5<br />
0.0<br />
Note: reduction in services cancelled<br />
represents an improvement in performance<br />
Jan.-Mar. Apr.-Jun. Jul.-Sept. Oct.-Dec.<br />
Bayside Trains<br />
Hillside Trains<br />
V/Line Passenger<br />
Figure 4. Cancellations of trams <strong>1999</strong><br />
Percentage of tram services<br />
cancelled<br />
1.5<br />
1.0<br />
0.5<br />
0.0<br />
Note: reduction in services cancelled<br />
represents an improvement in performance<br />
Jan.-Mar. Apr.-Jun. Jul.-Sept. Oct.-Dec.<br />
Swans<strong>to</strong>n Trams<br />
Yarra Trams<br />
Some of the key conclusions <strong>to</strong> be drawn from these figures are set out below:<br />
Trains<br />
––– Cancellations of metropolitan trains reduced during <strong>1999</strong>, with the performance in the last two quarters<br />
substantially better than the performance in the first quarter of <strong>1999</strong>. On average, 0.6 per cent of trains were<br />
cancelled in the last quarter of <strong>1999</strong> – about half the rate recorded for the first quarter.<br />
––– Cancellations of V/line Passenger trains over the last two quarters of <strong>1999</strong> averaged 0.2 per cent - similar <strong>to</strong> the<br />
level recorded in the first quarter.<br />
Trams<br />
––– Tram cancellations averaged 0.6 per cent in the second half of <strong>1999</strong>. This is lower than the 0.9 per cent average<br />
applying for the first quarter, however, the improvements were not uniform across both opera<strong>to</strong>rs.<br />
5
SECTION 3.<br />
PAYMENTS TO AND FROM FRANCHISEES<br />
3.1 Performance incentives and penalties<br />
Table 3 below shows the incentive/penalty payments made <strong>to</strong> franchisees by the Government under the Operational<br />
Performance Regime since it began at the end of <strong>August</strong> <strong>1999</strong>. A positive figure indicates an incentive payment from the<br />
Government <strong>to</strong> the franchise opera<strong>to</strong>r. A negative figure indicates a penalty payment from the franchise opera<strong>to</strong>r <strong>to</strong> the<br />
Government. The figures are not final as the contracts allow for adjustment, in limited circumstances, in later periods.<br />
Table 3. Incentive and penalty payments ($’000)<br />
29 Aug.–Sept. <strong>1999</strong> Oct.–Dec. <strong>1999</strong> Total per company<br />
Bayside Trains 203 519 722<br />
Hillside Trains 317 813 1,130<br />
V/Line Passenger -45 -10 -55<br />
Swans<strong>to</strong>n Trams -268 -893 -1,161<br />
Yarra Trams -54 -195 -249<br />
Total 153 234 387<br />
Note: a negative figure represents payment by the franchisee <strong>to</strong> government.<br />
3.2 Other payments <strong>to</strong> franchisees<br />
These incentive and penalty payments need <strong>to</strong> be seen in the context of ‘base’ subsidy payments made by the Government<br />
<strong>to</strong> franchisees of over $110 million, and other concession-related payments of around $13 million, over the period <strong>August</strong>-<br />
<strong>December</strong> <strong>1999</strong>.<br />
‘Base subsidy’ is the money which the Government pays each month <strong>to</strong> the franchisees for delivering the services. This<br />
amount, which generally reduces year by year over the life of each franchise, is specified in advance in the Government’s<br />
contracts with opera<strong>to</strong>rs. The amounts paid for the <strong>August</strong>-<strong>December</strong> <strong>1999</strong> period are shown in Table 4.<br />
The Government also pays money <strong>to</strong> opera<strong>to</strong>rs <strong>to</strong> reimburse them for carrying concession cardholders at half price and<br />
certain other groups free of charge, as indicated in Table 5.<br />
Table 4. Base subsidy ($’000)<br />
29 Aug.–Sept. <strong>1999</strong> Oct.–Dec. <strong>1999</strong> Total per company<br />
Bayside Trains 6,518 18,172 24,690<br />
Hillside Trains 8,321 23,197 31,518<br />
V/Line Passenger 7,175 20,003 27,178<br />
Swans<strong>to</strong>n Trams 4,689 13,073 17,762<br />
Yarra Trams 3,120 8,699 11,819<br />
Total 29,823 83,144 112,967<br />
7
<strong>Track</strong> <strong>Record</strong><br />
Vic<strong>to</strong>ria’s Train and Tram Services<br />
Table 5. Concession fare <strong>to</strong>p-up and free travel ($’000)<br />
29 Aug.–Sept. <strong>1999</strong> Oct.–Dec. <strong>1999</strong> Total per company<br />
Bayside Trains 1,137 2,471 3,608<br />
Hillside Trains 886 1,877 2,763<br />
V/Line Passenger 954 2,567 3,521<br />
Swans<strong>to</strong>n Trams 535 1,144 1,679<br />
Yarra Trams 391 849 1,240<br />
Total 3,903 8,908 12,811<br />
3.3 Total payments<br />
Table 6. Total payments ($’000)<br />
29 Aug.–Sept. <strong>1999</strong> Oct.–Dec. <strong>1999</strong> Total<br />
Bayside Trains 7,858 21,162 29,020<br />
Hillside Trains 9,524 25,887 35,411<br />
V/Line Passenger 8,084 22,560 30,644<br />
Swans<strong>to</strong>n Trams 4,956 13,324 18,280<br />
Yarra Trams 3,457 9,353 12,810<br />
Grand Total 33,879 92,286 126,165<br />
The key points <strong>to</strong> make about these figures are:<br />
Metropolitan trains<br />
––– The metropolitan train opera<strong>to</strong>rs earned bonuses for a substantial improvement in on-time running and reduced<br />
cancellations compared <strong>to</strong> the Government’s targets. For the four months since franchising, net incentive<br />
payments <strong>to</strong> the metropolitan train opera<strong>to</strong>rs have <strong>to</strong>talled $1.9 million.<br />
V/Line Passenger and trams<br />
––– V/Line Passenger and the tram opera<strong>to</strong>rs each paid penalties <strong>to</strong> the Government since the Operational<br />
Performance Regime came in<strong>to</strong> effect at the end of <strong>August</strong> <strong>1999</strong>. While service delivery by these opera<strong>to</strong>rs has<br />
generally been better than the average performance during 1998, it has not yet consistently exceeded the<br />
targets established by government.<br />
8
SECTION 4.<br />
CUSTOMER SATISFACTION<br />
4.1 Cus<strong>to</strong>mer satisfaction surveys<br />
Every three months, the Direc<strong>to</strong>r of <strong>Public</strong> <strong>Transport</strong> commissions opinion poll surveys of public transport passengers <strong>to</strong><br />
measure whether opera<strong>to</strong>rs are providing the quality of service their cus<strong>to</strong>mers expect. These surveys look at a range of<br />
different aspects of cus<strong>to</strong>mer service – from station facilities through <strong>to</strong> ticketing, punctuality and passenger security.<br />
Cus<strong>to</strong>mer satisfaction is recorded through a ‘Cus<strong>to</strong>mer Satisfaction Index’ (CSI) which reflects passengers’ responses <strong>to</strong><br />
questions put <strong>to</strong> them in telephone-based surveys.<br />
The graphs below show some of the key findings from the latest round of cus<strong>to</strong>mer satisfaction surveys (covering the<br />
period from Oc<strong>to</strong>ber <strong>to</strong> the end of <strong>December</strong> <strong>1999</strong>.) In each case, the latest results are compared <strong>to</strong> those in previous<br />
quarters.<br />
Data is collected from a series of telephone interviews conducted at monthly intervals. The sample is randomly selected<br />
from the electronic White Pages for areas where train, tram and bus services operate. The metropolitan survey includes<br />
train, tram, bus users and non-users of public transport, while the non-metropolitan survey includes train users, coach<br />
users and non-users.<br />
Figure 5. Overall satisfaction with all public transport service provided <strong>1999</strong><br />
80<br />
70<br />
CSI<br />
60<br />
50<br />
40<br />
Jan.-Mar. Apr.-Jun. Jul.-Sept. Oct.-Dec.<br />
4.2 Overall satisfaction<br />
Satisfaction with public transport services, in general, has steadily increased during <strong>1999</strong>. Satisfaction with metropolitan<br />
public transport services recorded its highest ever score of 65.2 in Oc<strong>to</strong>ber <strong>to</strong> <strong>December</strong> <strong>1999</strong> (up from 60.3 in January <strong>to</strong><br />
March <strong>1999</strong>).<br />
Note: Bus services have been included in the overall satisfaction question from Oc<strong>to</strong>ber <strong>1999</strong>.<br />
Figure 6. Overall satisfaction with individual train opera<strong>to</strong>rs <strong>1999</strong><br />
CSI<br />
80<br />
70<br />
60<br />
50<br />
Hillside Trains<br />
Bayside Trains<br />
V/Line<br />
P/Trains<br />
40<br />
Jan.-Mar. Apr.-Jun. Jul.-Sept. Oct.-Dec.<br />
9
<strong>Track</strong> <strong>Record</strong><br />
Vic<strong>to</strong>ria’s Train and Tram Services<br />
Figure 7. Overall satisfaction with individual tram opera<strong>to</strong>rs <strong>1999</strong><br />
CSI<br />
80<br />
70<br />
60<br />
50<br />
Swans<strong>to</strong>n Trams<br />
Yarra Trams<br />
40<br />
Jan.-Mar. Apr.-Jun. Jul.-Sept. Oct.-Dec.<br />
Compared with the January <strong>to</strong> March <strong>1999</strong> quarter, there has been a slight upward trend in satisfaction for all the<br />
metropolitan train and tram opera<strong>to</strong>rs during <strong>1999</strong>. Statistically significant increases in satisfaction were recorded for both<br />
tram companies in the Oc<strong>to</strong>ber <strong>to</strong> <strong>December</strong> <strong>1999</strong> quarter. V/Line Passenger services have consistently recorded higher<br />
scores than metropolitan services.<br />
4.3 Key aspects of service quality<br />
Set out below are the key conclusions about how each transport<br />
company was rated by its passengers against specific aspects<br />
of service quality.<br />
Hillside Trains<br />
Bayside Trains<br />
V/Line P/Trains<br />
Swans<strong>to</strong>n Trams<br />
Yarra Trams<br />
Value for money<br />
In the Oc<strong>to</strong>ber <strong>to</strong> <strong>December</strong> <strong>1999</strong> quarter, there was a<br />
statistically significant increase in cus<strong>to</strong>mers’ satisfaction<br />
with the value for money provided by Yarra Trams and<br />
Bayside Trains. Satisfaction with the value for money of<br />
V/Line Passenger services has decreased in the last quarter<br />
of <strong>1999</strong> when compared <strong>to</strong> the previous quarter.<br />
CSI<br />
80<br />
75<br />
70<br />
65<br />
60<br />
55<br />
50<br />
Figure 8. Satisfaction with value for<br />
money <strong>1999</strong><br />
45<br />
40<br />
Jan.-Mar. Apr.-Jun. Jul.-Sept. Oct.-Dec.<br />
Passenger information<br />
In regard <strong>to</strong> the information provided <strong>to</strong> passengers, upward<br />
trends are evident for V/Line Passenger and for Yarra Trams.<br />
Swans<strong>to</strong>n Trams has recovered from a downward trend with<br />
a statistically significant increase in satisfaction with service<br />
information in the last quarter. However, both tram<br />
companies are performing at levels somewhat lower than<br />
the train companies. A notable increase in CSI score for<br />
Bayside Trains sees this company move in<strong>to</strong> leadership on<br />
information provision among the metropolitan companies.<br />
CSI<br />
80<br />
75<br />
70<br />
65<br />
60<br />
55<br />
50<br />
45<br />
40<br />
Figure 9. Satisfaction with train/tram<br />
service information <strong>1999</strong><br />
Jan.-Mar. Apr.-Jun. Jul.-Sept. Oct.-Dec.<br />
10
Service delivery<br />
Service delivery (which includes the timeliness of services,<br />
frequency of services and number of cancellations) is the<br />
main driver of overall satisfaction with public transport.<br />
Passenger satisfaction with service delivery is increasing<br />
gradually for most companies. V/Line Passenger is the clear<br />
leader in this area and has experienced an upward trend in<br />
satisfaction since early <strong>1999</strong>. There have been statistically<br />
significant increases in the service delivery recorded by<br />
Bayside Trains and Swans<strong>to</strong>n Trams, and now all<br />
metropolitan companies are performing at a similar level.<br />
CSI<br />
80<br />
75<br />
70<br />
65<br />
60<br />
55<br />
50<br />
45<br />
40<br />
Figure 10. Satisfaction with train/tram<br />
service delivery <strong>1999</strong><br />
Jan.-Mar. Apr.-Jun. Jul.-Sept. Oct.-Dec.<br />
Passenger comfort<br />
Yarra Trams’ rating for passenger comfort has increased over<br />
time, extending its lead over the other metropolitan<br />
companies. Swans<strong>to</strong>n Trams and Bayside Trains also<br />
improved their ratings in Oc<strong>to</strong>ber <strong>to</strong> <strong>December</strong> <strong>1999</strong>.<br />
80<br />
75<br />
70<br />
65<br />
Figure 11. Satisfaction with comfort on<br />
trains/trams <strong>1999</strong><br />
CSI<br />
60<br />
55<br />
50<br />
45<br />
40<br />
Jan.-Mar. Apr.-Jun. Jul.-Sept. Oct.-Dec.<br />
Stations/tram s<strong>to</strong>ps<br />
Previous results have shown Hillside Trains <strong>to</strong> be the leader<br />
of the metropolitan companies in terms of satisfaction with<br />
station facilities. However, Bayside Trains, Swans<strong>to</strong>n Trams<br />
and Yarra Trams have recently improved their ratings in this<br />
area and are now performing at levels similar <strong>to</strong> Hillside.<br />
CSI<br />
80<br />
75<br />
70<br />
65<br />
60<br />
55<br />
50<br />
45<br />
Figure 12. Satisfaction with train<br />
stations/tram s<strong>to</strong>ps <strong>1999</strong><br />
40<br />
Jan.-Mar. Apr.-Jun. Jul.-Sept. Oct.-Dec.<br />
Ticketing<br />
Figure 13. Satisfaction with ticketing <strong>1999</strong><br />
January <strong>to</strong> March <strong>1999</strong> was a low point for satisfaction<br />
with ticketing across all of the metropolitan companies and<br />
for the tram companies in particular. While satisfaction with<br />
ticketing remains at a lower level than other aspects of<br />
service quality, it has increased over the past three quarters<br />
for each of the companies, with the train companies<br />
remaining ahead of the tram companies. Statistically<br />
significant increases in satisfaction with ticketing were<br />
recorded for V/Line Passenger and Yarra Trams in the latest<br />
quarter.<br />
CSI<br />
80<br />
75<br />
70<br />
65<br />
60<br />
55<br />
50<br />
45<br />
40<br />
Jan.-Mar. Apr.-Jun. Jul.-Sept. Oct.-Dec.<br />
11
<strong>Track</strong> <strong>Record</strong><br />
Vic<strong>to</strong>ria’s Train and Tram Services<br />
Station/tram staff<br />
Figure 14. Satisfaction with staff service <strong>1999</strong><br />
While satisfaction with staff service has remained<br />
relatively stable for V/Line Passenger, there has been a<br />
notable increase in the equivalent CSI score for each of the<br />
metropolitan companies. In particular, statistically<br />
significant increases in satisfaction have been recorded for<br />
Bayside Trains and Yarra Trams during the last quarter.<br />
80<br />
75<br />
70<br />
65<br />
60<br />
55<br />
50<br />
45<br />
40<br />
Jan.-Mar. Apr.-Jun. Jul.-Sept. Oct.-Dec.<br />
Personal security/safety<br />
V/Line Passenger clearly leads the field in passenger<br />
perception of personal security and has extended this lead<br />
with a statistically significant increase this quarter. Bayside<br />
Trains also recorded a statistically significant increase in<br />
satisfaction in the last quarter, however, that was from a<br />
low base recorded during the second and third quarters of<br />
<strong>1999</strong>. Both tram companies recorded a steady increase in<br />
perception of personal security during the year. The ratings<br />
for the metropolitan train companies remain at a notably<br />
lower level than for the tram companies.<br />
CSI<br />
80<br />
75<br />
70<br />
65<br />
60<br />
55<br />
50<br />
45<br />
40<br />
Figure 15. Satisfaction with personal<br />
security <strong>1999</strong><br />
Jan.-Mar. Apr.-Jun. Jul.-Sept. Oct.-Dec.<br />
OBTAINING COPIES OF TRACK RECORD<br />
Copies of this bulletin are available free of charge from the Direc<strong>to</strong>r of <strong>Public</strong> <strong>Transport</strong>, at the following address:<br />
Direc<strong>to</strong>r of <strong>Public</strong> <strong>Transport</strong><br />
PO Box 2797Y<br />
Melbourne 3001<br />
Telephone: 1800 264 644<br />
It is also available from the Department of Infrastructure website (www.doi.vic.gov.au).<br />
12
FEEDBACK<br />
This is the first edition of <strong>Track</strong> <strong>Record</strong>. It is intended <strong>to</strong> inform the community about the performance of Vic<strong>to</strong>ria’s public<br />
transport train and tram system – and <strong>to</strong> do so in a balanced, open way.<br />
The Government is keen <strong>to</strong> get your views on the <strong>Track</strong> <strong>Record</strong> bulletin – on the document itself, its layout and scope,<br />
and how it could be improved. Does it cover the right things Is it easy <strong>to</strong> understand Should it contain more information<br />
or less<br />
How informative did you find this bulletin<br />
Please tick:<br />
Very informative Didn’t present anything new Little information of interest<br />
Was the material easy <strong>to</strong> understand<br />
Please tick:<br />
Easy <strong>to</strong> follow A bit difficult <strong>to</strong> understand Not clear at all<br />
What would you like more information on<br />
Please tick:<br />
Service performance Finances Cus<strong>to</strong>mer satisfaction Other (please specify)<br />
How could future bulletins be improved<br />
How often do you use public transport<br />
Please tick: Twice or more a day Once a day Once or twice a week Occasionally<br />
Metropolitan Trains<br />
V/Line Passenger<br />
Trams<br />
Buses<br />
If you would like <strong>to</strong> receive future copies of <strong>Track</strong> <strong>Record</strong>, please write your name and address in the box below, and send<br />
this form <strong>to</strong> the FREEPOST address on the reverse of this page or email <strong>to</strong> doi@vic.gov.au<br />
13


