You also want an ePaper? Increase the reach of your titles
YUMPU automatically turns print PDFs into web optimized ePapers that Google loves.
Table 3: Percentage of <strong>Greenbelt</strong> Permanently Protected<br />
Permanently Protected<br />
Land in Each County<br />
The proportion of permanently<br />
protected greenbelt varies greatly by<br />
county (Table 3). In land preservation<br />
leaders Marin and San Mateo<br />
Counties, the proportions of greenbelt<br />
lands that are permanently<br />
protected are an impressive 60% and<br />
49%. In these cases, ongoing protection<br />
efforts by land trusts and open<br />
space districts complement large<br />
public land holdings such as the<br />
Golden Gate National Recreation<br />
Area and the San Francisco State Fish<br />
and Game Refuge to form a relatively<br />
secure greenbelt.<br />
Contra Costa, Alameda, and Santa<br />
Clara Counties also each have large<br />
amounts of public land, especially in<br />
the hills and bayshores. Thirty-five<br />
percent of Contra Costa’s greenbelt is<br />
permanently protected, and Alameda<br />
and Santa Clara Counties are tied<br />
with 31%.<br />
Permanently protected land in Napa,<br />
Solano, and Sonoma Counties<br />
includes more high-value agriculture<br />
and less public land. Twenty-one<br />
percent of Napa County’s greenbelt<br />
is permanently protected and Solano<br />
and Sonoma Counties are tied with<br />
only 14%.<br />
One major reason for Napa and<br />
Solano’s smaller amounts of permanently<br />
protected land is the fact that<br />
they are the only counties in the Bay<br />
2000 2005<br />
Acres % of <strong>Greenbelt</strong> Acres % of <strong>Greenbelt</strong><br />
Alameda 95,100 27% 104,700 31%<br />
Contra Costa 99,100 30% 111,000 35%<br />
Marin 159,400 53% 178,000 60%<br />
Napa 76,000 16% 99,300 21%<br />
San Francisco 5,300 87% 5,100 89%<br />
San Mateo 91,400 41% 107,800 49%<br />
Santa Clara 147,800 22% 201,800 31%<br />
Solano 35,100 7% 66,000 14%<br />
Sonoma 84,800 9% 133,600 14%<br />
Total 794,000 20% 1,007,200 25%<br />
Area without open space districts.<br />
Open space districts are public<br />
agencies (like the well-known East<br />
Bay Regional Park District) that use<br />
funding from sales or property taxes<br />
to purchase and manage open space.<br />
Change Since 2000: More Land<br />
Permanently Protected Regionwide<br />
The amount of permanently protected<br />
land in the region rose by 27%<br />
since 2000, increasing by 213,100<br />
acres for a total of 1,007,200 acres<br />
(Table 2).<br />
This impressive increase shows that<br />
the Bay Area, long a national leader<br />
in regional land conservation, is not<br />
resting on its laurels. Permanently<br />
protected acreage is now more than<br />
one quarter of all non-urbanized land<br />
in the Bay Area, and more than onefifth<br />
of all land. Continued commitment<br />
to land conservation on the<br />
part of elected officials and voters,<br />
especially in the funding of open<br />
space agencies, is enabling the region<br />
to build on past successes and<br />
expand its permanent greenbelt.<br />
These permanently protected areas<br />
are the keystones of the greenbelt.<br />
Their long-range security is a critical<br />
complement to the policy-based<br />
protection tools like urban growth<br />
boundaries.<br />
Change Since 2000: More Land<br />
Permanently Protected in Each County<br />
Here again, each county in the region<br />
(excluding San Francisco) improved<br />
notably, especially Santa Clara and<br />
Sonoma. Santa Clara saw the biggest<br />
improvement, with 54,000 acres<br />
newly protected, due in part to the<br />
massive program to restore wetlands<br />
on salt ponds on the southern end of<br />
the San Francisco Bay. Sonoma’s<br />
48,800-acre increase in protected<br />
lands was helped by the passage in<br />
1990 of a sales tax to fund open<br />
space, which has allowed significant<br />
land acquisition by the Sonoma<br />
County Agricultural Parks and Open<br />
Space District, in addition to work by<br />
the Sonoma Land Trust. Even the<br />
smallest increase, of 9,600 acres in<br />
Alameda County, was significant, a<br />
10% expansion of permanently<br />
protected acreage since 2000.<br />
This result reflects the vigorous work<br />
by open space agencies and land<br />
trusts in the last 5 years to acquire<br />
and protect land, as well as the<br />
continued commitment to open space<br />
acquisition on the part of Bay Area<br />
residents.<br />
A Closer Look at <strong>Risk</strong><br />
In addition to these two major trends<br />
since 2000—the decline in overall<br />
lands at risk and the increase in<br />
permanently protected acreage—a<br />
closer look at the results also reveals<br />
a decrease in the amount of lands at<br />
high risk of development, and an<br />
increase in the amount of land at<br />
medium risk.<br />
Together, these trends mean that the<br />
region is doing well in reducing shortterm<br />
sprawl threats, but longer-term<br />
and more insidious threats remain.<br />
High-<strong>Risk</strong> Lands:<br />
Decreasing but Still Serious<br />
Since 2000, there has been a 41%<br />
drop in high-risk lands, lands likely<br />
to be developed in the next 10 years<br />
(Table 2). In other words, in the last 5<br />
years, 88,100 acres—an area roughly<br />
equivalent to three San Franciscos—<br />
has been relieved from immediate<br />
sprawl pressure. Most of this land saw<br />
<br />
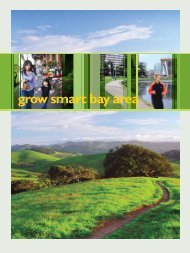
<strong>At</strong> <strong>Risk</strong>: The Bay Area <strong>Greenbelt</strong>