
You also want an ePaper? Increase the reach of your titles
YUMPU automatically turns print PDFs into web optimized ePapers that Google loves.
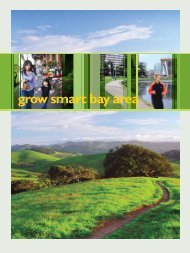
<strong>At</strong> <strong>Risk</strong>:<br />
The Bay Area <strong>Greenbelt</strong><br />
<strong>2006</strong> Edition
<strong>Greenbelt</strong> <strong>Alliance</strong> would like to thank the many<br />
individuals around the Bay Area who helped to provide<br />
the information compiled in this report, as well as our<br />
generous supporters.<br />
Funders:<br />
The Bella Vista Foundation<br />
The Richard and Rhoda Goldman Fund<br />
The Gordon and Betty Moore Foundation<br />
Resources Legacy Fund Foundation<br />
The San Francisco Foundation<br />
The Skoll Foundation<br />
The members of <strong>Greenbelt</strong> <strong>Alliance</strong><br />
<strong>Greenbelt</strong> <strong>Alliance</strong> staff and consultants:<br />
Researchers<br />
Kevin Shively<br />
Carey Knecht<br />
Authors<br />
Bill Eisenstein<br />
Elizabeth Stampe<br />
Field researchers<br />
Jeremy Madsen<br />
Michele Beasley<br />
Kelly Brown<br />
David Reid<br />
Brent Schoradt<br />
Nicole Arnold<br />
Daisy Pistey-Lyhne<br />
Editor<br />
Elizabeth Stampe<br />
Executive Director<br />
Tom Steinbach<br />
Mapping<br />
GreenInfo Network:<br />
Ryan Branciforte<br />
Louis Jaffé<br />
Larry Orman<br />
Design<br />
Karen Parry | Black Graphics<br />
© <strong>2006</strong> <strong>Greenbelt</strong> <strong>Alliance</strong>
Contents<br />
E x e c u t i v e s u m m a ry<br />
Executive Summary . . . . . . . . . 2<br />
R e p o r t<br />
Introduction . . . . . . . . . . . . 3<br />
Regional Findings . . . . . . . . . . 4<br />
The Importance of the <strong>Greenbelt</strong> . . . . . 11<br />
The Importance of Policy in Protecting<br />
the <strong>Greenbelt</strong> . . . . . . . . . . . 13<br />
Parcelization . . . . . . . . . . . . 16<br />
Alameda County 18<br />
Contra Costa County . . . . . . . . . 19<br />
Marin County 20<br />
Napa County . . . . . . . . . . . . 21<br />
San Francisco County . . . . . . . . . 22<br />
San Mateo County . . . . . . . . . . 23<br />
Santa Clara County 24<br />
Solano County . . . . . . . . . . . 25<br />
Sonoma County . . . . . . . . . . . 26<br />
Achieving the Vision . . . . . . . . . 27<br />
M e t h o d s<br />
Methods . . . . . . . . . . . . . 28<br />
F i g u r e s<br />
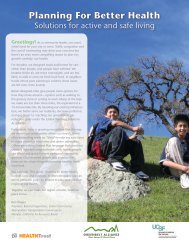
Figure 1: Bay Area Lands <strong>At</strong> <strong>Risk</strong> . . . . . . . 5<br />
Figure 2: Proportions of Lands <strong>At</strong> <strong>Risk</strong> Around the Bay Area 6<br />
Figure 3: Dominant <strong>Risk</strong> Factors on High-<strong>Risk</strong> Lands 9<br />
Figure 4: Dominant <strong>Risk</strong> Factors on Medium-<strong>Risk</strong> Lands 9<br />
Figure 5: Urban Expansion if <strong>At</strong>-<strong>Risk</strong> Land is Developed . 10<br />
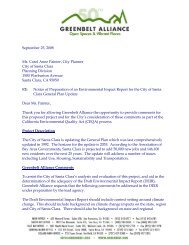
Figure 6: Land Parcelization in Sonoma County . . . 16<br />
Ta b l e s<br />
Table 1: The State of the <strong>Greenbelt</strong>, <strong>2006</strong> . . . . . 4<br />
Table 2: <strong>Greenbelt</strong> Changes Since 2000 . . . . . 6<br />
Table 3: Percentage of <strong>Greenbelt</strong> Permanently Protected . 8<br />
Table 4: Adjusted 2000 <strong>At</strong>-<strong>Risk</strong> Findings . . . . . 28
Executive Summary<br />
One in 10 Bay Area acres at risk of sprawl development<br />
The Bay Area is a great place to live.<br />
Its landscapes are spectacular, its<br />
cities diverse and vibrant, and its<br />
economy strong.<br />
The Bay Area is also facing a major<br />
challenge: how to deal with growth<br />
in a way that preserves the region’s<br />
high quality of life.<br />
This region is famous for being a<br />
major metropolitan area surrounded<br />
by a thriving greenbelt of forests,<br />
coastlines, fields, and orchards. In<br />
many ways, the Bay Area has done<br />
well at navigating the challenges of<br />
growth, keeping development off<br />
hillsides and protecting the fertile<br />
farmlands that surround our cities.<br />
But the Bay Area’s greenbelt is at risk.<br />
It is threatened by sprawl: low-density<br />
suburban development on the region’s<br />
fringe. This poorly planned development<br />
paves open space, worsens air<br />
and water quality, and exacerbates<br />
housing and transportation problems.<br />
<strong>Greenbelt</strong> <strong>Alliance</strong>, the Bay Area’s<br />
land conservation and urban planning<br />
organization, analyzed the state of<br />
the region’s landscapes in 2005. This<br />
landmark study determined that today,<br />
there are 401,500 acres of greenbelt<br />
lands at risk of sprawl development.<br />
That includes 125,200 acres at risk<br />
within the next 10 years, classified as<br />
high-risk land, and 276,200 acres at<br />
risk within the next 30 years, classified<br />
as medium-risk land.<br />
The Good News<br />
This is an improvement: the total<br />
amount of Bay Area land at risk of<br />
sprawl development has declined by<br />
13% since 2000, when it was<br />
464,100 acres. The amount of land at<br />
high risk has decreased by 41% since<br />
2000. This progress is largely a result<br />
of better planning and land-use<br />
policies, especially the widespread<br />
use of urban growth boundaries.<br />
Today, 1,007,200 acres of greenbelt<br />
lands are permanently protected<br />
from development, a 27% increase<br />
since 2000. This represents acquisitions<br />
by land trusts and state parks,<br />
as well as conservation easements<br />
(the sale of development rights for<br />
conservation purposes).<br />
The Bad News<br />
Though the Bay Area has made real<br />
progress, 401,500 acres at risk of<br />
sprawl development is still an<br />
enormous amount of land: the size of<br />
13 San Franciscos.<br />
Regionally, nearly 1 out of every<br />
10 acres of land in the entire Bay<br />
Area is at risk. In Solano and Contra<br />
Costa Counties, almost 1 out of every<br />
5 acres is at risk.<br />
If all the lands at risk were developed,<br />
Solano, Napa, and Sonoma Counties’<br />
urbanized areas would more than<br />
double. Overall, the region’s urbanized<br />
area would balloon to over one<br />
and a half times its current size of<br />
761,400 acres, with devastating effects<br />
for the Bay Area’s environment and<br />
economy.<br />
Another troubling trend is that<br />
medium-risk land—land at risk of<br />
sprawl development in 10 to 30<br />
years—is on the rise. It has increased<br />
by 10% since 2000. This is partly<br />
due to land parcelization, where land<br />
that appears whole has actually<br />
already been cut up into small lots.<br />
This could allow thousands of new<br />
houses to spring up in rural areas.<br />
Challenges for<br />
Every County<br />
Around the region, the places at<br />
highest risk—the sprawl hot spots—<br />
include the I-80 corridor in Solano<br />
County, the eastern cities in Contra<br />
Costa County, Coyote Valley in<br />
southern Santa Clara County, the<br />
Tri‐Valley area of Alameda and<br />
Contra Costa Counties, and areas<br />
along Highway 101 through Sonoma<br />
County.<br />
Solano County now has the most<br />
land at risk in the Bay Area. Sonoma,<br />
Contra Costa, and Santa Clara also<br />
have large amounts of land at risk.<br />
Land-use decisions in these four<br />
counties will have major consequences<br />
for the entire region.<br />
Counties that have less land at risk,<br />
especially Marin, San Mateo, and<br />
San Francisco, still have a crucial role<br />
to play in regional greenbelt protection.<br />
If the Bay Area is to accommodate<br />
growth sustainably, the<br />
region’s cities and counties must<br />
work together to focus development<br />
in existing urbanized areas and to<br />
improve transit access and housing<br />
affordability. Policymakers, regional<br />
and local planning agencies, organizations<br />
like <strong>Greenbelt</strong> <strong>Alliance</strong>, and<br />
Bay Area residents will play a critical<br />
role in this process.<br />
Looking Ahead<br />
The Bay Area will continue to grow,<br />
and grow rapidly. In recent years, the<br />
region has done well at adopting<br />
policies to guide better growth. As<br />
development pressures increase, so<br />
will the challenges. It will be up to<br />
Bay Area residents and elected<br />
leaders to make the right decisions<br />
to ensure a vibrant, healthy region.<br />
<br />
<strong>At</strong> <strong>Risk</strong>: The Bay Area <strong>Greenbelt</strong>
Introduction<br />
The Bay Area is growing fast. Since<br />
1980, the population of the ninecounty<br />
region has increased by almost<br />
two million people; the number of<br />
jobs has increased by almost one<br />
million. By 2030, the region is<br />
expected to grow by 1.7 million<br />
people and another 1.6 million jobs.<br />
The region also faces a housing crisis.<br />
Only 12% of families can afford the<br />
median-priced home.<br />
Since the 1950s, growth in the Bay<br />
Area has largely meant putting new<br />
jobs and homes out on the edges of<br />
the region, rather than focusing them<br />
in existing cities and towns.<br />
These factors—fast growth,<br />
unaffordable housing, and edge<br />
development—combine to put<br />
intense development pressure on<br />
the Bay Area’s working farms and<br />
natural areas.<br />
As the greenbelt of hillsides, farmland,<br />
and forests around the region’s cities<br />
is developed, the region loses the very<br />
things that make it special. When<br />
sprawl development replaces the<br />
region’s spectacular landscapes and<br />
inviting cities with subdivisions, strip<br />
malls, and freeways, the Bay Area<br />
loses the high quality of life that<br />
makes it a center of innovation.<br />
This report provides a snapshot of<br />
the greenbelt lands facing sprawl<br />
development pressure in the ninecounty<br />
Bay Area. This is <strong>Greenbelt</strong><br />
<strong>Alliance</strong>’s fourth <strong>At</strong> <strong>Risk</strong> report;<br />
previous snapshots of the region<br />
were taken in 1989, 1994, and 2000.<br />
<strong>Greenbelt</strong> <strong>Alliance</strong> collected the data<br />
for this report in 2005, assessing the<br />
development risk to all the region’s<br />
Today, over 400,000 acres of the Bay Area’s greenbelt of open space are at<br />
risk of sprawl development. Protecting this at-risk land—an expanse the<br />
size of 13 San Franciscos—will require strong land protections and a<br />
regionwide commitment to planning well for growth.<br />
open space, and classifying the land<br />
as one of the following:<br />
High <strong>Risk</strong>: <strong>Greenbelt</strong> lands that are<br />
likely to be developed in the next<br />
10 years.<br />
Medium <strong>Risk</strong>: <strong>Greenbelt</strong> lands that<br />
are likely to be developed in the next<br />
30 years.<br />
Low <strong>Risk</strong>: <strong>Greenbelt</strong> lands that are<br />
not likely to be developed in the next<br />
30 years.<br />
Secure <strong>Greenbelt</strong>: <strong>Greenbelt</strong> lands<br />
that are permanently protected from<br />
development, including most public<br />
lands, land trust properties, and<br />
conservation easements. This information<br />
is largely based on a map<br />
created by the Bay Area Open Space<br />
Council.<br />
Urban: Lands that are developed at a<br />
density of at least one residential unit<br />
per 1.5 acres, or the equivalent<br />
density for commercial or industrial<br />
development. This information is<br />
largely based on a map created by the<br />
State of California’s Farmland<br />
Mapping and Monitoring Project.<br />
The results of this <strong>At</strong> <strong>Risk</strong> report give<br />
citizens and decision-makers a way<br />
of assessing whether we’re heading in<br />
the right direction: toward a healthier<br />
environment and more vibrant<br />
communities.<br />
These results present some promising<br />
trends and underscore the significant<br />
challenges ahead.<br />
Photo: Galen Rowell/Mountain Light<br />
<strong>2006</strong> Edition
Regional Findings<br />
Hundreds of thousands of acres at risk, with some positive trends<br />
The Bay Area’s <strong>Greenbelt</strong> <strong>At</strong> <strong>Risk</strong><br />
The nine counties of the San Francisco Bay Area together<br />
comprise four and a half million acres of land (Table 1).<br />
Of that land, 761,400 acres are urbanized. The rest of the<br />
Bay Area’s land is its greenbelt of open space: its farms,<br />
rolling hills and ranchlands, wildlife habitat, watersheds,<br />
and other natural areas.<br />
Just over one-quarter of the greenbelt, 1,007,200 acres, is<br />
now permanently protected. The rest is potentially<br />
vulnerable to sprawl development.<br />
Today, there are 401,500 acres of greenbelt lands at risk<br />
of sprawl development in the Bay Area (Table 1, Figure 1).<br />
Nearly 1 out of every 10 acres of land in the entire Bay<br />
Area is at risk.<br />
The total area at risk is the size of 13 San Franciscos. This<br />
massive swath of the Bay Area is made up of fields,<br />
orchards, forests, and hillsides that share one attribute: if<br />
sprawl development proceeds at its current pace, they will<br />
be paved over.<br />
Most of the lands at risk are on the edges of the ninecounty<br />
Bay Area, where sprawl development is the<br />
dominant pattern of growth.<br />
This at-risk land includes 125,200 acres of high-risk land,<br />
or land at risk of development within the next 10 years,<br />
and 276,200 acres of medium-risk land, at risk of development<br />
within the next 10 to 30 years.<br />
The remaining 2,294,400 acres of<br />
greenbelt lands are at low risk of<br />
development; for a variety of reasons,<br />
including long-term policy protections as<br />
well as physical attributes like steepness and<br />
inaccessibility, these lands are unlikely to be<br />
developed in the next 30 years.<br />
Land <strong>At</strong> <strong>Risk</strong> in Each County<br />
Together, four counties—the “sprawlers”—contain almost<br />
85% of the Bay Area’s threatened land (Table 1). Solano<br />
County now has the most at-risk land of any county:<br />
93,300 acres. Solano County has taken this spot away<br />
from Contra Costa County, which is now in third place<br />
with 82,200 acres at risk. But in both these fast-growing<br />
counties, roughly 1 out of every 5 acres of land in the<br />
entire county is at risk. This is a much higher proportion<br />
of land at risk than in any other county. Also firmly in the<br />
“sprawler” category is the region’s largest county, Sonoma<br />
County, which has the second most land at risk, 88,300<br />
acres. Not far behind is Santa Clara County, another large<br />
county, with 75,300 acres at risk.<br />
<strong>At</strong> the other end of the spectrum, the region’s smallest<br />
counties—the “savers”—also have the least land at risk.<br />
San Mateo and especially Marin County now have very<br />
small amounts of land at risk, with only 10,200 and<br />
3,800 acres respectively. San Francisco effectively has no<br />
land at risk, as the county’s land is generally already either<br />
urbanized or permanently protected.<br />
Table 1: The State of the <strong>Greenbelt</strong>, <strong>2006</strong><br />
Total Acres <strong>At</strong> <strong>Risk</strong><br />
(High + Medium)<br />
High-<strong>Risk</strong><br />
Acres<br />
Medium-<strong>Risk</strong><br />
Acres<br />
Low-<strong>Risk</strong><br />
Acres<br />
Urban<br />
Acres<br />
Protected<br />
Acres<br />
Total<br />
Acres*<br />
Alameda 26,100 15,000 11,100 203,000 144,000 104,700 477,800<br />
Contra Costa 82,200 29,300 52,900 123,900 145,200 111,000 462,400<br />
Marin 3,800 2,600 1,100 113,200 41,400 178,000 336,300<br />
Napa 22,300 9,700 12,500 340,500 21,400 99,300 483,400<br />
San Francisco 0 0 0 600 24,900 5,100 30,600<br />
San Mateo 10,200 2,000 8,200 100,400 71,100 107,800 289,500<br />
Santa Clara 75,300 21,300 54,000 377,600 185,100 201,800 839,800<br />
Solano 93,300 31,900 61,400 315,900 55,400 66,000 530,600<br />
Sonoma 88,300 13,400 74,900 719,200 72,800 133,600 1,013,900<br />
Total 401,500 125,200 276,200 2,294,400 761,400 1,007,200 4,464,400<br />
Note: Rows and columns may not add up precisely due to rounding.<br />
*Acreage totals exceed actual land area due to slight overlap between the GIS layer of urban lands prepared by the State of California’s Farmland Mapping and Monitoring Project, the GIS layer<br />
of protected lands prepared by the Bay Area Open Space Council, and the GIS layer of water from GreenInfo Network. The total error due to overlap is approximately 0.8%. The GIS layer of lands<br />
at risk has no overlap error.<br />
<br />
<strong>At</strong> <strong>Risk</strong>: The Bay Area <strong>Greenbelt</strong>
Cloverdale<br />
101<br />
Bay Area Lands <strong>At</strong> <strong>Risk</strong><br />
S O N O M A<br />
Healdsburg<br />
Santa Rosa<br />
N A P A<br />
Dixon<br />
Rohnert<br />
Park<br />
12<br />
Sonoma<br />
29<br />
Napa<br />
80<br />
Vacaville<br />
101<br />
Petaluma<br />
Fairfield<br />
M A R I N<br />
116<br />
680<br />
S O L A N O<br />
Rio Vista<br />
Vallejo<br />
San<br />
Rafael<br />
80<br />
Concord<br />
Pittsburg<br />
4<br />
Antioch<br />
580<br />
24<br />
Walnut<br />
Creek<br />
C O N T R A C O S T A<br />
Brentwood<br />
San<br />
Francisco<br />
Oakland<br />
680<br />
San<br />
Ramon<br />
Dublin<br />
Livermore<br />
580<br />
92<br />
A L A M E D A<br />
101<br />
880<br />
1<br />
High <strong>Risk</strong><br />
Medium <strong>Risk</strong><br />
Half<br />
Moon<br />
Bay<br />
280<br />
Low <strong>Risk</strong><br />
San Jose<br />
Urban<br />
Protected<br />
S A N M A T E O<br />
85<br />
17<br />
S A N T A C L A R A<br />
101<br />
10 Miles<br />
k N<br />
Morgan<br />
Hill<br />
Figure 1: Bay Area Lands <strong>At</strong> <strong>Risk</strong><br />
Gilroy<br />
<strong>2006</strong> Edition
Alameda and Napa Counties, counties<br />
of intermediate size, are also<br />
intermediate in terms of risk, with<br />
26,100 and 22,300 greenbelt acres at<br />
risk respectively.<br />
Change Since 2000: Less Land<br />
<strong>At</strong> <strong>Risk</strong> Regionwide<br />
Although there is a great deal of<br />
greenbelt land still at risk in the Bay<br />
Area, the total acreage has dropped<br />
by a considerable amount since<br />
<strong>Greenbelt</strong> <strong>Alliance</strong>’s last survey of the<br />
region. In 2000, throughout the<br />
region there were 464,100 acres at<br />
risk (Table 2). Since then, the amount<br />
of land at risk has dropped by<br />
62,600 acres or 13%.<br />
What happened to the land that was<br />
at risk in 2000 Roughly half of that<br />
land is at the same level of risk today.<br />
About 1 in 10 acres was permanently<br />
protected, and about 1 in 20 was<br />
urbanized. The remaining land, about<br />
one-third of all land that was at risk<br />
in 2000, faces a lower level of risk<br />
today than it did then. (That is, highrisk<br />
land has become medium-risk<br />
land, and medium-risk land has<br />
become low-risk land.)<br />
Also, about 1 out of every 5 acres of<br />
land that was at medium or high risk<br />
in 2000 is now at low risk; this land<br />
has effectively gone from at-risk to<br />
not at-risk.<br />
S o n o m a<br />
High 13,440<br />
Medium 74,873<br />
M a r i n<br />
Size of Circle<br />
Represents Actual<br />
<strong>Risk</strong> Acreage<br />
High 2,629<br />
Medium 1,133<br />
This substantial improvement is<br />
largely due to better policies to guide<br />
growth toward existing cities, away<br />
from the greenbelt. This illustrates<br />
the power of policy to protect the<br />
N a p a<br />
High 9,737<br />
Medium 12,527<br />
S a n<br />
M a t e o<br />
High 1,950<br />
Medium 8,238<br />
C o n t r a<br />
C o s t a<br />
Figure 2: Proportions of Lands <strong>At</strong> <strong>Risk</strong> Around the Bay Area<br />
S o l a n o<br />
High 31,930<br />
Medium 61,377<br />
High 29,275<br />
Medium 52,950<br />
A l a m e d a<br />
High 14,969<br />
Medium 11,139<br />
S a n t a C l a r a<br />
High 21,289<br />
Medium 54,000<br />
greenbelt. Policy protections like<br />
urban growth boundaries can put<br />
large areas of the greenbelt off-limits<br />
to development, quickly and at<br />
relatively low cost. This can then give<br />
Table 2: <strong>Greenbelt</strong> Changes Since 2000<br />
Total Acres <strong>At</strong> <strong>Risk</strong> (High + Medium) High-<strong>Risk</strong> Acres Medium-<strong>Risk</strong> Acres<br />
2000 <strong>2006</strong> change % change 2000 <strong>2006</strong> change % change 2000 <strong>2006</strong> change % change<br />
Alameda 36,000 26,100 -9,900 -28% 25,000 15,000 -10,000 -40% 11,000 11,100 100 1%<br />
Contra Costa 100,400 82,200 -18,200 -18% 54,300 29,300 -25,000 -46% 46,100 52,900 6,800 15%<br />
Marin 7,800 3,800 -4,000 -51% 5,300 2,600 -2,700 -51% 2,500 1,100 -1,400 -56%<br />
Napa 19,000 22,300 3,300 17% 17,900 9,700 -8,200 -46% 1,100 12,500 11,400 1036%<br />
San Francisco 0 0 0 0% 0 0 0 0 0 0<br />
San Mateo 18,600 10,200 -8,400 -45% 7,900 2,000 -5,900 -75% 10,700 8,200 -2,500 -23%<br />
Santa Clara 95,500 75,300 -20,200 -21% 37,400 21,300 -16,100 -43% 58,100 54,000 -4,100 -7%<br />
Solano 96,400 93,300 -3,100 -3% 39,900 31,900 -8,000 -20% 56,500 61,400 4,900 9%<br />
Sonoma 90,500 88,300 -2,200 -2% 25,700 13,400 -12,300 -48% 64,800 74,900 10,100 16%<br />
Total 464,100 401,500 -62,600 -13% 213,300 125,200 -88,100 -41% 250,800 276,200 25,400 10%<br />
Note: Rows and columns may not add up precisely due to rounding.<br />
*Acreages of all categories, when totaled, exceed actual land area, due to slight overlap between the GIS layer of urban lands prepared by the State of California’s Farmland Mapping and<br />
Monitoring Project, the GIS layer of protected lands prepared by the Bay Area Open Space Council, and the GIS layer of water from GreenInfo Network. The GIS layer of 2005 lands at risk has<br />
<br />
<strong>At</strong> <strong>Risk</strong>: The Bay Area <strong>Greenbelt</strong>
land trusts and open space districts<br />
time to raise funds to buy the most<br />
important of these lands for permanent<br />
protection. Policies that encourage<br />
development within<br />
already-urbanized areas also translate<br />
into a more secure greenbelt:<br />
done correctly, development in<br />
existing cities and towns can actually<br />
save the greenbelt instead of paving it,<br />
as infill development relieves the<br />
pressure to sprawl out onto farmlands<br />
and natural areas.<br />
Change Since 2000: Less Land<br />
<strong>At</strong> <strong>Risk</strong> in Each County<br />
As the total amount of land at risk<br />
throughout the region declined since<br />
2000, generally, so did the amount in<br />
each county (Table 2). The one<br />
exception to this was Napa County,<br />
whose land at risk increased by 17%<br />
or 3,300 acres.<br />
Though Santa Clara County still has<br />
a significant amount of land at risk<br />
(75,300 acres), this county had the<br />
largest decrease in land at risk, with a<br />
decrease of 20,200 acres or 21%. A<br />
primary reason for this was San<br />
Jose’s adoption of an urban growth<br />
boundary in 2000, halting its legacy<br />
of sprawling development and<br />
committing instead to protecting<br />
hillsides and baylands. Gilroy’s<br />
General Plan, adopted in 2000, also<br />
put thousands of acres of land<br />
outside its 20-year planning boundary.<br />
However, Gilroy’s lack of an<br />
urban growth boundary means these<br />
lands are still at risk; that risk is<br />
simply less imminent than it was.<br />
Contra Costa County, like Santa<br />
Clara County, has a large amount of<br />
land at risk (82,200 acres), but it had<br />
the second-largest decrease in at-risk<br />
lands: 18,200 acres or 18%. Much of<br />
this decrease was due to the tightening<br />
of the county’s urban limit line in<br />
2001; this achievement is now being<br />
whittled away by east county cities<br />
intent on expansion. Also, some<br />
lands that were at high risk of<br />
development in 2000 were not<br />
included in expansive urban limit<br />
lines proposed by developers in 2005;<br />
this delayed (but did not eliminate)<br />
the risk of sprawl development on<br />
these areas.<br />
In Alameda County, the land at risk<br />
declined by 9,900 acres or 28%. The<br />
main reason for this significant<br />
improvement was the passage in<br />
2000 of a countywide urban growth<br />
boundary. The same initiative also<br />
established minimum parcel sizes for<br />
rural land, preventing further<br />
subdivision and supporting farming<br />
and ranching.<br />
In the other counties, the acreage<br />
decreases in land at risk were smaller.<br />
San Mateo County saw a decrease in<br />
lands at risk of 8,400 acres or 45%<br />
partly due to permanent land<br />
protection and as a result of slowing<br />
growth throughout the county, with<br />
less public support for new development<br />
of any kind. Marin’s drop of<br />
4,000 acres of lands at risk or 51%<br />
was, as in San Mateo, a result both of<br />
permanent protection for lands and<br />
decreased support for new development.<br />
Solano County’s decrease of<br />
3,100 acres or 3% was largely a<br />
result of the passage in 2003 of urban<br />
growth boundaries around Fairfield<br />
and Benicia. However, the prospect of<br />
expansions for Interstate 80 and<br />
Highways 12 and 113 still puts over<br />
18,000 acres of land in Solano<br />
County at risk. Sonoma County’s<br />
decrease of 2,200 acres or 2% was<br />
due in part to the adoption of urban<br />
growth boundaries in the cities of<br />
Sonoma and Rohnert Park, although<br />
these improvements were offset by an<br />
increase in medium-risk land due to a<br />
lack of strong policies to protect<br />
county land. San Francisco saw no<br />
real change.<br />
In Napa County, the increase of<br />
3,300 acres in land at risk was due to<br />
sprawl pressures from the city of<br />
American Canyon, potential highway<br />
expansions, and parcelization threats<br />
on agricultural land.<br />
Low-<strong>Risk</strong> Acres Urban Acres Protected Acres<br />
2000 <strong>2006</strong> change % change 2000 <strong>2006</strong> change % change 2000 <strong>2006</strong> change % change<br />
212,500 203,000 -9,500 -5% 141,400 144,000 2,600 2% 95,100 104,700 9,600 10% Alameda<br />
127,300 123,900 -3,400 -3% 142,200 145,200 3,000 2% 99,100 111,000 11,900 12% Contra Costa<br />
131,400 113,200 -18,200 -14% 40,500 41,400 900 2% 159,400 178,000 18,600 12% Marin<br />
369,300 340,500 -28,800 -8% 21,100 21,400 300 1% 76,000 99,300 23,300 31% Napa<br />
600 600 0 0% 24,400 24,900 500 2% 5,300 5,100 -200 -4% San Francisco<br />
111,200 100,400 -10,800 -10% 71,100 71,100 0 0% 91,400 107,800 16,400 18% San Mateo<br />
410,000 377,600 -32,400 -8% 184,100 185,100 1,000 1% 147,800 201,800 54,000 37% Santa Clara<br />
346,200 315,900 -30,300 -9% 53,800 55,400 1,600 3% 35,100 66,000 30,900 88% Solano<br />
770,000 719,200 -50,800 -7% 70,700 72,800 2,100 3% 84,800 133,600 48,800 58% Sonoma<br />
2,478,500 2,294,400 -184,100 -7% 749,300 761,400 12,100 2% 794,000 1,007,200 213,200 27% Total<br />
no overlap error. Because the overlap was greater in 2000 than in 2005, there are some slight differences in totals where there was no change on the ground, for example in the San Francisco<br />
acreages. The total error due to overlap is approximately 1.3%.<br />
<strong>2006</strong> Edition
Table 3: Percentage of <strong>Greenbelt</strong> Permanently Protected<br />
Permanently Protected<br />
Land in Each County<br />
The proportion of permanently<br />
protected greenbelt varies greatly by<br />
county (Table 3). In land preservation<br />
leaders Marin and San Mateo<br />
Counties, the proportions of greenbelt<br />
lands that are permanently<br />
protected are an impressive 60% and<br />
49%. In these cases, ongoing protection<br />
efforts by land trusts and open<br />
space districts complement large<br />
public land holdings such as the<br />
Golden Gate National Recreation<br />
Area and the San Francisco State Fish<br />
and Game Refuge to form a relatively<br />
secure greenbelt.<br />
Contra Costa, Alameda, and Santa<br />
Clara Counties also each have large<br />
amounts of public land, especially in<br />
the hills and bayshores. Thirty-five<br />
percent of Contra Costa’s greenbelt is<br />
permanently protected, and Alameda<br />
and Santa Clara Counties are tied<br />
with 31%.<br />
Permanently protected land in Napa,<br />
Solano, and Sonoma Counties<br />
includes more high-value agriculture<br />
and less public land. Twenty-one<br />
percent of Napa County’s greenbelt<br />
is permanently protected and Solano<br />
and Sonoma Counties are tied with<br />
only 14%.<br />
One major reason for Napa and<br />
Solano’s smaller amounts of permanently<br />
protected land is the fact that<br />
they are the only counties in the Bay<br />
2000 2005<br />
Acres % of <strong>Greenbelt</strong> Acres % of <strong>Greenbelt</strong><br />
Alameda 95,100 27% 104,700 31%<br />
Contra Costa 99,100 30% 111,000 35%<br />
Marin 159,400 53% 178,000 60%<br />
Napa 76,000 16% 99,300 21%<br />
San Francisco 5,300 87% 5,100 89%<br />
San Mateo 91,400 41% 107,800 49%<br />
Santa Clara 147,800 22% 201,800 31%<br />
Solano 35,100 7% 66,000 14%<br />
Sonoma 84,800 9% 133,600 14%<br />
Total 794,000 20% 1,007,200 25%<br />
Area without open space districts.<br />
Open space districts are public<br />
agencies (like the well-known East<br />
Bay Regional Park District) that use<br />
funding from sales or property taxes<br />
to purchase and manage open space.<br />
Change Since 2000: More Land<br />
Permanently Protected Regionwide<br />
The amount of permanently protected<br />
land in the region rose by 27%<br />
since 2000, increasing by 213,100<br />
acres for a total of 1,007,200 acres<br />
(Table 2).<br />
This impressive increase shows that<br />
the Bay Area, long a national leader<br />
in regional land conservation, is not<br />
resting on its laurels. Permanently<br />
protected acreage is now more than<br />
one quarter of all non-urbanized land<br />
in the Bay Area, and more than onefifth<br />
of all land. Continued commitment<br />
to land conservation on the<br />
part of elected officials and voters,<br />
especially in the funding of open<br />
space agencies, is enabling the region<br />
to build on past successes and<br />
expand its permanent greenbelt.<br />
These permanently protected areas<br />
are the keystones of the greenbelt.<br />
Their long-range security is a critical<br />
complement to the policy-based<br />
protection tools like urban growth<br />
boundaries.<br />
Change Since 2000: More Land<br />
Permanently Protected in Each County<br />
Here again, each county in the region<br />
(excluding San Francisco) improved<br />
notably, especially Santa Clara and<br />
Sonoma. Santa Clara saw the biggest<br />
improvement, with 54,000 acres<br />
newly protected, due in part to the<br />
massive program to restore wetlands<br />
on salt ponds on the southern end of<br />
the San Francisco Bay. Sonoma’s<br />
48,800-acre increase in protected<br />
lands was helped by the passage in<br />
1990 of a sales tax to fund open<br />
space, which has allowed significant<br />
land acquisition by the Sonoma<br />
County Agricultural Parks and Open<br />
Space District, in addition to work by<br />
the Sonoma Land Trust. Even the<br />
smallest increase, of 9,600 acres in<br />
Alameda County, was significant, a<br />
10% expansion of permanently<br />
protected acreage since 2000.<br />
This result reflects the vigorous work<br />
by open space agencies and land<br />
trusts in the last 5 years to acquire<br />
and protect land, as well as the<br />
continued commitment to open space<br />
acquisition on the part of Bay Area<br />
residents.<br />
A Closer Look at <strong>Risk</strong><br />
In addition to these two major trends<br />
since 2000—the decline in overall<br />
lands at risk and the increase in<br />
permanently protected acreage—a<br />
closer look at the results also reveals<br />
a decrease in the amount of lands at<br />
high risk of development, and an<br />
increase in the amount of land at<br />
medium risk.<br />
Together, these trends mean that the<br />
region is doing well in reducing shortterm<br />
sprawl threats, but longer-term<br />
and more insidious threats remain.<br />
High-<strong>Risk</strong> Lands:<br />
Decreasing but Still Serious<br />
Since 2000, there has been a 41%<br />
drop in high-risk lands, lands likely<br />
to be developed in the next 10 years<br />
(Table 2). In other words, in the last 5<br />
years, 88,100 acres—an area roughly<br />
equivalent to three San Franciscos—<br />
has been relieved from immediate<br />
sprawl pressure. Most of this land saw<br />
<br />
<strong>At</strong> <strong>Risk</strong>: The Bay Area <strong>Greenbelt</strong>
Development speculation<br />
Other<br />
Parcelized<br />
Access to transportation infrastructure<br />
Adjacent to development<br />
Inside a UGB, sphere of<br />
influence, or city limit<br />
1%<br />
4%<br />
5%<br />
7%<br />
7%<br />
12%<br />
Figure 3: Dominant <strong>Risk</strong> Factors on High-<strong>Risk</strong> Lands<br />
a reduction in risk due to improved<br />
policy protections including urban<br />
growth boundaries and new efforts<br />
by cities to direct growth inward.<br />
As the <strong>At</strong> <strong>Risk</strong> map (Figure 1) shows,<br />
the remaining regional high-risk<br />
sprawl hot spots are predominantly<br />
on the outer edges of the region.<br />
These are places where land prices<br />
are lower and where growth pressures<br />
from the Bay Area overlap with<br />
those of the Sacramento, Santa Cruz,<br />
and Central Valley regions. The hot<br />
spots are also places that have few<br />
policies to guide growth. These include<br />
the northeastern portion of Contra<br />
Costa County, the I-80 corridor in<br />
Solano County, the Tri-Valley region<br />
of Alameda County, the south end of<br />
Santa Clara County along Highway<br />
101, and areas along Highway 101<br />
through Sonoma County.<br />
What are the risk factors for high-risk<br />
lands Two-thirds of these lands are<br />
at high risk because they are already<br />
zoned, planned, proposed, or<br />
approved for development (Figure 3).<br />
Other key risk factors include being<br />
inside a city limit, sphere of influence,<br />
or urban growth boundary (where<br />
good development should happen,<br />
but sprawl development could<br />
happen instead); having easy access<br />
to transportation networks (usually<br />
highways); and being immediately<br />
adjacent to existing development.<br />
The dramatic reduction in high-risk<br />
land throughout the entire region, in<br />
just 5 years, is tremendous progress.<br />
It is a testament to the effectiveness<br />
of urban growth boundaries and<br />
other rural land-use protections that<br />
protect large amounts of land quickly.<br />
It is also a testament to efforts<br />
around the region to accommodate<br />
growth in existing urban areas.<br />
On the other hand, most of the lands<br />
that are still at high risk are that way<br />
specifically because planners and<br />
elected officials have approved them<br />
for growth.<br />
In other words, sprawl is not inevitable.<br />
Policy-makers and voters hold the keys<br />
to stopping sprawl and ensuring<br />
more sustainable, equitable growth.<br />
Medium-<strong>Risk</strong> Lands:<br />
Longer-Term and Increasing<br />
Since 2000, the Bay Area experienced<br />
a 10% increase in medium-risk lands,<br />
lands likely to be developed between<br />
10 and 30 years from now (Table 2).<br />
Somewhat less concentrated than<br />
high-risk lands, the largest amounts<br />
of medium-risk lands are found in<br />
Sonoma, Solano, Contra Costa, and<br />
Santa Clara Counties, as well as in<br />
much of Napa and Alameda Counties<br />
Other<br />
Development speculation<br />
Figure 4.<br />
Dominant <strong>Risk</strong> Factor on Medium-<strong>Risk</strong> Lands<br />
(Table 1, Figure 1). Sonoma, Solano,<br />
Napa, and Contra Costa Counties all<br />
have significantly more medium-risk<br />
land now than they did in 2000.<br />
Historical threat 10%<br />
Inside a UGB, sphere of<br />
influence, or city limit<br />
3%<br />
4%<br />
13%<br />
64%<br />
Parcelized 15%<br />
Zoned, planned,<br />
proposed, or<br />
approved for<br />
development<br />
Figure 4: Dominant <strong>Risk</strong> Factors on Medium-<strong>Risk</strong> Lands<br />
What are the risk factors for mediumrisk<br />
lands Throughout the region,<br />
22% of these lands are zoned,<br />
planned, proposed, or approved for<br />
eventual development (Figure 4).<br />
Another 15% are parcelized, meaning<br />
they have already been subdivided<br />
into smaller parcels of land. This is<br />
particularly significant in Sonoma<br />
and Santa Clara Counties, where<br />
parcelization threatens tens of<br />
thousands of acres. Other key risk<br />
factors include being adjacent to<br />
existing development; having access<br />
to infrastructure (transportation,<br />
water, or sewage); being inside a city<br />
limit, sphere of influence, or urban<br />
growth boundary; or having been the<br />
object of sprawl threats in the past.<br />
These risk factors are largely the<br />
same as those facing high-risk lands,<br />
but the medium risk lands face them<br />
less immediately.<br />
The persistence of medium-risk<br />
threats illustrates the necessity of<br />
continued vigilance about the future<br />
of the greenbelt. Some of the impressive<br />
reductions in high-risk land<br />
represent only the postponement, not<br />
the elimination, of sprawl threat. If<br />
the region’s counties do not renew<br />
and expand their protections for<br />
greenbelt lands, these medium-risk<br />
lands could come under even more<br />
severe threat.<br />
22%<br />
18%<br />
Zoned, planned, proposed,<br />
or approved for development<br />
Access to infrastructure<br />
(transportation, sewage, water)<br />
15% Adjacent to development<br />
<strong>2006</strong> Edition
Figure 5: Urban Expansion if <strong>At</strong>-<strong>Risk</strong> Land is Developed<br />
S O N O M A<br />
S O N O M A<br />
N A P A<br />
N A P A<br />
M A R I N<br />
S O L A N O<br />
M A R I N<br />
S O L A N O<br />
C O N T R A C O S T A<br />
C O N T R A C O S T A<br />
A L A M E D A<br />
A L A M E D A<br />
S A N M A T E O<br />
S A N T A C L A R A<br />
S A N M A T E O<br />
S A N T A C L A R A<br />
Current Bay Area urbanization.<br />
Total land at risk plus current urbanized area.<br />
300<br />
250<br />
57%<br />
41%<br />
Land <strong>At</strong> <strong>Risk</strong><br />
Urbanized Land<br />
THOUSANDS OF ACRES<br />
200<br />
150<br />
100<br />
50<br />
0<br />
18%<br />
Alameda<br />
Contra<br />
Costa<br />
9% 104%<br />
Marin<br />
Napa<br />
14%<br />
San<br />
Mateo<br />
Santa<br />
Clara<br />
168%<br />
Solano<br />
121%<br />
Sonoma<br />
Urban expansion that would occur if all<br />
lands at risk were developed. Percentages<br />
indicate the percent by which the<br />
urbanized area in each county would<br />
expand. In Napa, Solano, and Sonoma<br />
Counties, the urbanized area would<br />
more than double.<br />
Remaining Regional Threat<br />
Regionally, nearly 1 out of every 10 acres of land in the<br />
entire Bay Area is currently still at risk from sprawl. In the<br />
most sprawl-threatened counties, Solano and Contra<br />
Costa, almost 1 out of every 5 acres is at risk.<br />
The decrease in land at risk, particularly at high risk, is a<br />
significant step forward for the region. But the work is<br />
far from over, as sprawl threats loom over more than<br />
400,000 acres of the Bay Area’s irreplaceable greenbelt.<br />
If all land currently at risk were developed in the next 30<br />
years, the urbanized land in the Bay Area would expand<br />
to over one and a half times its current size, with Solano,<br />
Napa, and Sonoma Counties’ urban areas more than<br />
doubling in size (Figure 5).<br />
10<br />
<strong>At</strong> <strong>Risk</strong>: The Bay Area <strong>Greenbelt</strong>
The Importance of<br />
the <strong>Greenbelt</strong><br />
Photo: Bob Walker, collection of the Oakland Museum of California<br />
The Bay Area’s fertile soils and mild climate yield an abundance<br />
of fruits, vegetables, meats, dairy products, and grains. But the<br />
region’s working farms are threatened by sprawl development.<br />
Sprawl threatens farming not only by directly paving<br />
farmland, but also by gradually undermining the local<br />
agricultural economy. Rising land values can trigger<br />
property tax assessments that push farmers to try to sell<br />
their land. When farmers start to disappear, the companies<br />
that support them with supplies and equipment also<br />
disappear, which in turn forces more farmers out of<br />
business. Housing developments next to farms can also<br />
lead to conflicts with new neighbors who view farming<br />
practices as nuisances.<br />
Intact Species Habitat<br />
The Bay Area is a large metropolitan area, but it is also<br />
home to an extraordinarily diverse array of plants and<br />
wildlife. Hundreds of species make the greenbelt their<br />
home, and animals like the golden eagle, bobcat, coyote,<br />
tule elk, and mountain lion need large expanses of open<br />
land to fly or roam with minimal threat or disturbance<br />
from humans.<br />
The Bay Area’s greenbelt has incalculable value for Bay<br />
Area residents. The region’s success at stopping sprawl<br />
and preserving greenbelt lands will determine whether we<br />
continue to benefit from thriving agriculture, intact<br />
species habitat, clean water, spectacular views, abundant<br />
recreation, a vibrant economy, and compact, well-defined<br />
urban areas. These values of the greenbelt all contribute<br />
to the high quality of life the Bay Area enjoys.<br />
Thriving Agriculture<br />
The Bay Area’s agricultural vitality goes far beyond the<br />
famous vineyards of Napa and Sonoma Counties, including<br />
orchards, ranches, and farms around the region. The<br />
region’s mild climate and rich soils make it possible to<br />
grow a wide array of crops, providing fresh local produce<br />
to residents year-round.<br />
This bounty is directly threatened by sprawl in many<br />
parts of the region. In eastern Contra Costa County,<br />
orchards continue to fall to the bulldozers. In southern<br />
Santa Clara County, housing developments have been<br />
proposed inside the county’s Agricultural Preserve. And<br />
across Sonoma County, parcelization and rural residential<br />
development threatens highly productive farmlands.<br />
Nationally, sprawl development is the single greatest<br />
threat to species survival. In the Bay Area (and Santa Cruz<br />
County), sprawl threatens 257 rare, threatened, and<br />
endangered species, more than any other metropolitan<br />
area in the continental United States. Sprawl directly<br />
destroys plants and soil and fragments the landscape into<br />
pieces that are too small and disconnected for animals to<br />
use. The survival of local threatened and endangered<br />
species like the California tiger salamander, San Joaquin<br />
kit fox, Alameda whipsnake, and burrowing owl depends<br />
on intact greenbelt lands.<br />
The tule elk and endangered San Joaquin kit fox rely on the<br />
Bay Area’s greenbelt for survival.<br />
Elk: Galen Rowell/Mountain Light<br />
<strong>2006</strong> Edition<br />
11
Clean Water<br />
<strong>Greenbelt</strong> lands play an essential role<br />
in purifying drinking water and<br />
protecting the San Francisco Bay. As<br />
rain falls onto greenbelt lands, plants<br />
and soil act as natural—and free—<br />
filters and sponges to keep the water<br />
clean and slow its flow, preventing<br />
flooding. When land is developed,<br />
these free filtration and flood prevention<br />
services are lost.<br />
Sprawl development puts the Bay<br />
Area at much greater risk of floods<br />
and water pollution. The short,<br />
intense rainy season already makes<br />
the region vulnerable to flooding, and<br />
sprawl makes floods more intense,<br />
frequent, and dangerous. Polluted<br />
runoff that flows into the Bay and the<br />
Delta degrades their ecosystems, and<br />
endangers valuable fish and shellfish.<br />
Pollution in the Delta also affects the<br />
drinking water of millions of<br />
Californians.<br />
Spectacular Views<br />
The sight of a distant hillside glowing<br />
in the sun, dotted with grazing cows<br />
or patches of oaks, is familiar to<br />
virtually every Bay Area resident. The<br />
preservation of these vistas through<br />
generations of growth took commitment<br />
and foresight by earlier generations.<br />
That legacy continues today, as<br />
Bay Area communities adopt hillside<br />
protection ordinances and urban<br />
growth boundaries, helping to<br />
preserve these familiar, spectacular<br />
views.<br />
Sprawl developments on the region’s<br />
hillsides mar the landscape without<br />
making any meaningful contribution<br />
to the region’s housing supply. Intact<br />
hillsides are an inspiring reminder of<br />
the Bay Area’s heritage; developed<br />
ones are a reminder of how easily<br />
that heritage can be wasted.<br />
Recreation<br />
Just as people enjoy looking to the<br />
hills, they also enjoy walking, biking,<br />
and running in them. The Bay Area’s<br />
many parks provide a wide range of<br />
Photo: Galen Rowell/Mountain Light<br />
The Bay Area’s undeveloped hillsides catch and filter water that runs into the<br />
San Francisco Bay and the San Joaquin-Sacramento River Delta, providing clean<br />
drinking water and helping to prevent floods.<br />
recreational opportunities, from<br />
strolling and picnicking to mountain<br />
biking and mushroom hunting. These<br />
recreational opportunities make a<br />
critical contribution to the culture,<br />
lifestyle, and economy of the Bay Area.<br />
Sprawl development threatens the<br />
quality of these recreational experiences;<br />
a walk in the woods is less<br />
satisfying when subdivisions loom<br />
just over the fence. Moreover, as the<br />
population of the region grows, more<br />
park space and recreational opportunities<br />
will be needed to ensure that all<br />
Bay Area residents have access to the<br />
region’s great outdoors.<br />
A Vibrant Economy<br />
The Bay Area’s economy depends on<br />
the region’s identity as an attractive<br />
place to live and work. Companies<br />
use the beauty of the region to attract<br />
highly skilled workers; the region’s<br />
innovation-based economy is rooted<br />
in the spectacular landscapes that<br />
define the Bay Area. In addition, the<br />
region’s strong agricultural sector is a<br />
significant contributor to the economy.<br />
Sprawl development threatens the<br />
scenic landscapes and compact,<br />
inviting communities that draw<br />
people to the Bay Area. In addition,<br />
the speculative pressures that accompany<br />
sprawl development threaten to<br />
squeeze farmers out of the Bay Area<br />
and undercut a major sector of the<br />
economy.<br />
Compact Development<br />
Finally, an intact Bay Area greenbelt<br />
generates value by helping to guide<br />
good development. With a protected<br />
greenbelt surrounding cities and<br />
towns, new growth can improve<br />
quality of life, instead of creating<br />
more traffic and destroying open<br />
space. High-quality infill development<br />
mixes land uses, putting homes,<br />
shops and jobs close to one another,<br />
so residents don’t have to drive for<br />
every errand. Good infill also<br />
includes housing options for people<br />
of all income levels. This is a crucial<br />
part of reducing pressure to develop<br />
the greenbelt.<br />
Ultimately, the goals of protecting<br />
open space and encouraging compact<br />
development in cities are inextricably<br />
linked. Each requires the other, and<br />
each makes the other possible. If the<br />
Bay Area can commit to both, the<br />
result will be a thriving greenbelt and<br />
a thriving region.<br />
12 <strong>At</strong> <strong>Risk</strong>: The Bay Area <strong>Greenbelt</strong>
The Importance of Policy<br />
in Protecting the <strong>Greenbelt</strong><br />
With so much of the Bay Area’s<br />
greenbelt still at risk, the Bay Area’s<br />
ability to maintain and expand its<br />
high quality of life, thriving economy,<br />
and healthy environment depends on<br />
the public policy and planning<br />
choices that are made today. The Bay<br />
Area’s greenbelt preservation experience<br />
to date has shown that there is<br />
no one solution to a problem as<br />
complex as stopping sprawl. It takes<br />
a combination of policies, and a<br />
coordinated team of agencies and<br />
organizations, to make broad and<br />
lasting change.<br />
On the public policy front, greenbelt<br />
preservation begins with good landuse<br />
planning. County and city general<br />
plans must demonstrate a political<br />
commitment both to preserving the<br />
integrity of the greenbelt and to<br />
growing smarter within developed<br />
areas. Voters also have a powerful<br />
role to play in approving policies that<br />
result in better growth and rejecting<br />
those that fuel sprawl.<br />
Preventing Sprawl with<br />
Urban Growth Boundaries<br />
Both city and county plans should<br />
include well-defined urban growth<br />
boundaries (UGBs), which draw a<br />
line beyond which development will<br />
not go. To be most useful, UGBs<br />
should have a long time horizon (at<br />
least 20 years) and should include a<br />
moderate amount of land to accommodate<br />
new high-quality growth.<br />
Most importantly, these UGBs should<br />
be stable, so that farmers, developers,<br />
and elected leaders can make wise<br />
decisions, knowing where growth<br />
will and will not occur. Voterapproved<br />
UGBs are more stable and<br />
stronger than those approved by city<br />
councils and county boards of<br />
supervisors, as they require a vote of<br />
the people for any change.<br />
Protecting Rural Land and<br />
Mitigating for Its Loss<br />
To prevent inappropriate development<br />
of rural lands, county general<br />
plans should include limits on<br />
subdivision and parcelization of rural<br />
properties, as well as minimum<br />
parcel sizes to protect farming. Cities<br />
and counties should also have<br />
policies requiring mitigation for the<br />
development of farmland and<br />
environmentally sensitive land.<br />
Permanently Protecting<br />
<strong>Greenbelt</strong> Lands<br />
Independent open space agencies are<br />
another key component of greenbelt<br />
protection funded by voter-approved<br />
sales taxes. These public agencies are<br />
critical and effective players in<br />
greenbelt conservation. They have<br />
now permanently protected tens of<br />
thousands of acres throughout the<br />
Bay Area, and the pace of their<br />
activity is still increasing. These<br />
agencies often work in concert with<br />
private non-profit land trusts, maximizing<br />
the benefit of public open<br />
space protection funds.<br />
Urban growth boundaries, like this one in Contra Costa County, draw<br />
a boundary to define where growth should and should not go.<br />
<strong>2006</strong> Edition<br />
13
Photo: Steven Price, www.urban-advantage.com<br />
Before and after: a street with infill development around transit. This<br />
computer-generated image shows how good development can create more vibrant<br />
neighborhoods while directing growth away from the greenbelt.<br />
Encouraging Better Growth<br />
in Cities<br />
City general plans should encourage<br />
good urban infill by mixing land uses,<br />
increasing heights and densities<br />
where appropriate, and focusing<br />
compact development around transit<br />
stations. Including affordable<br />
housing in cities is also critical to<br />
keeping development pressure off the<br />
greenbelt. Tools for good growth in<br />
cities include mixed-use zoning, to<br />
put homes, shops and jobs in close<br />
proximity; streets and buildings<br />
designed for pedestrians; reduced<br />
parking requirements; and affordable<br />
housing policies.<br />
Investing in Better<br />
Transportation<br />
Voter-approved sales tax increases to<br />
fund transportation have the potential<br />
to fuel sprawl or to guide better<br />
growth. They fuel sprawl if they<br />
focus on creating and expanding<br />
highways. This fuels sprawl development<br />
in remote areas, and does not<br />
lessen traffic congestion for more<br />
than a few years. To protect the<br />
greenbelt and provide lasting solutions<br />
to traffic congestion, transportation<br />
funding should be tied to land<br />
use in two ways. The first is to<br />
require cities to have urban growth<br />
boundaries before receiving transportation<br />
funds, to prevent sprawl. The<br />
second is to require cities to plan for<br />
plenty of housing around train<br />
stations and bus lines, so that transit<br />
is convenient for many people.<br />
Transportation investments should<br />
also focus on supporting public<br />
transit, bicycles, and pedestrians<br />
rather than sprawl-inducing highways.<br />
This makes already-urbanized<br />
areas more attractive and affordable,<br />
reduces auto use and traffic congestion,<br />
and protects the greenbelt.<br />
Combining Tools for<br />
Effective <strong>Greenbelt</strong><br />
Protection<br />
A key lesson to be drawn from the<br />
Bay Area’s experience is that both<br />
smart land-use policy and land<br />
acquisition are necessary strategies;<br />
neither alone will save the greenbelt<br />
and create livable communities. The<br />
purchase of lands and easements is<br />
essential to the long-term security of<br />
the greenbelt, but better land-use<br />
policies can put many more acres<br />
beyond the reach of sprawl more<br />
quickly. <strong>At</strong> the same time, policies<br />
require vigilance on the part of the<br />
region’s voters, both in their enactment<br />
and enforcement. Progress in<br />
protecting the Bay Area’s greenbelt<br />
has been best where very strong<br />
general plan policies are backed up<br />
by complementary city and county<br />
policies, sound transportation<br />
investment plans, and strong landacquisition<br />
strategies.<br />
Growing Well Within<br />
the Boundaries<br />
A key question facing the region is<br />
how to use undeveloped lands within<br />
urban growth boundaries (UGBs).<br />
These lands, which are designated for<br />
development, must be managed<br />
carefully to keep them from disappearing<br />
quickly under an avalanche<br />
of sprawl, leaving nothing for the<br />
future.<br />
Drawing a UGB is just the first part<br />
of land protection. Growing well<br />
inside the UGB is the critical second<br />
half of the equation. For this reason,<br />
lands inside UGBs are still at risk;<br />
though they are the appropriate place<br />
for good development, they are still<br />
threatened by sprawl.<br />
Sprawl inside a UGB has all the same<br />
negative effects as sprawl elsewhere:<br />
it segregates homes, jobs, and shops;<br />
requires more car trips; increases<br />
traffic congestion and auto-related<br />
pollution; and makes neighborhoods<br />
less livable. On the other hand,<br />
mixed-use developments with good<br />
design, strong transit, and a range of<br />
housing types can strengthen an<br />
entire city in the near term and be<br />
sustainable or re-usable over the long<br />
term.<br />
14 <strong>At</strong> <strong>Risk</strong>: The Bay Area <strong>Greenbelt</strong>
UGBs should be established with<br />
these realities in mind. While UGBs<br />
must include some room for future<br />
urban development, they must not be<br />
so large as to threaten the greenbelt<br />
itself and impose heavy costs on<br />
cities. In the 2005 elections, developers<br />
succeeded in establishing excessively<br />
large UGBs around Antioch<br />
and Pittsburg so that they can<br />
proceed with sprawl projects immediately.<br />
There is a great danger that<br />
others who stand to reap short-term<br />
profit from sprawl will imitate this in<br />
the future, setting up a cycle of everexpanding<br />
UGBs. To be successful,<br />
the boundaries must be set at the<br />
point where they are the most stable<br />
and sustainable for the community,<br />
while also protecting each of the<br />
values of the greenbelt.<br />
Cities starved for property tax<br />
revenue often feel the need to<br />
generate sales tax revenues by<br />
approving strip malls and big box<br />
retail developments. In many cases,<br />
they will seek to annex unincorporated<br />
county lands, in opposition to<br />
county policies, in order to obtain<br />
development sites for this purpose.<br />
Finally, permitting or planning for<br />
the parcelization, or subdivision, of<br />
large blocks of land, especially with<br />
single-use residential zoning, is often<br />
the fatal step in welcoming sprawl. In<br />
a region where housing is scarce,<br />
landowners who can subdivide their<br />
land will often do so, reaping large<br />
profits from development.<br />
The Bay Area faces significant growth<br />
over the coming years; by current<br />
predictions it will be home to one<br />
million additional people by 2020<br />
and 1.7 million by 2030. With<br />
sprawl-producing policies, that<br />
growth will translate into lost open<br />
space, unaffordable housing, longer<br />
commutes, and traffic-choked roads.<br />
Accommodating new growth without<br />
reducing the region’s quality of life<br />
will require new policies that leave<br />
behind the status quo of sprawl.<br />
The question of how to grow within<br />
urban growth boundaries is a<br />
microcosm of the key issue faced by<br />
the region as a whole: how to<br />
physically accommodate population<br />
and economic growth without<br />
destroying the Bay Area’s environment<br />
and quality of life. Planning<br />
policies that protect the greenbelt,<br />
encourage appropriate infill development,<br />
improve affordability and<br />
social equity, and retain decisionmaking<br />
flexibility for future generations<br />
are the only way forward.<br />
Current Policies That<br />
Generate Sprawl<br />
Unfortunately, many jurisdictions<br />
have policies that create sprawl, rather<br />
than controlling it. Since World War II,<br />
development has tended to sprawl<br />
outward in low-density, car-dependent<br />
growth on the outskirts of cities, and<br />
policies have supported this pattern.<br />
Infrastructure expansions, especially<br />
of highways, water supply lines and<br />
sewers, are a critical stimulus to<br />
sprawl. Not only do they make largescale<br />
residential development<br />
physically feasible, they also greatly<br />
increase the pressure to develop<br />
agricultural lands.<br />
Low-density development in remote areas is encouraged by current city and county<br />
policies that favor cars over other transportation, encourage sprawling retail<br />
development, and allow the subdivision of farmland.<br />
<strong>2006</strong> Edition<br />
15
Parcelization<br />
Land parcelization is a hidden—but critical—threat to the<br />
long-term integrity of the Bay Area’s greenbelt. Parcelization<br />
occurs when undeveloped land is divided up into<br />
smaller pieces that can be used as house lots. Parcelized<br />
areas are usually built out in a piecemeal fashion, as<br />
individual lot owners gradually put up houses. This means<br />
sprawl can occur largely outside of public view and with<br />
little planning or oversight.<br />
Most parcelized lands are near cities or existing development.<br />
Once built upon, they create all the same problems<br />
as traditional sprawling subdivisions.<br />
Parcelized lands that are farther away from cities pose<br />
significant problems of their own. Parcelization can<br />
fragment areas deep within the greenbelt, breaking up<br />
contiguous blocks of habitat essential for many wildlife<br />
species, or carving up otherwise-intact farming areas. This<br />
process also puts large demands on rural roads and other<br />
infrastructure, generally in places that are very expensive<br />
to service, creating pressure for sprawl-inducing infrastructure<br />
expansion. Ultimately, by undermining the<br />
values of an intact greenbelt, parcelization makes it more<br />
likely that a given area will be converted to full-blown<br />
suburban sprawl in the future.<br />
Parcelization is a threat in every Bay Area county except<br />
San Francisco, but is especially acute in Sonoma and Santa<br />
Clara Counties. Sonoma County has the second-most atrisk<br />
land of any county in the Bay Area, despite having<br />
urban growth boundaries around eight of its nine cities.<br />
One key reason is that parcelization threatens large areas<br />
of the county, even on extremely productive farmland<br />
(Figure 6). Of all the land at risk in Sonoma County,<br />
24%—a total of 20,810 acres—is threatened primarily by<br />
parcelization. It is the most parcelized county in California.<br />
Alameda County has been effective at stopping parcelization<br />
through the use of large minimum lot sizes on county<br />
land. Napa County and Solano County, on the other hand,<br />
have limited parcelization threats with initiatives that<br />
restrict residential development on unincorporated county<br />
or agricultural land. The latter approach may work better<br />
in areas where commercially viable farms can be small,<br />
such as in Sonoma’s vineyards. Nonetheless, because<br />
parcelization often happens under the radar, it will require<br />
continued vigilance on the part of Bay Area counties to<br />
prevent it from gradually eroding the region’s greenbelt.<br />
Pa r c e l S i z e ( A c r e s )<br />
5–9<br />
10–39<br />
40–159<br />
160–599<br />
> 600<br />
Protected Land<br />
Urban<br />
k N<br />
5 Miles<br />
Figure 6: Land Parcelization in Sonoma County<br />
16 <strong>At</strong> <strong>Risk</strong>: The Bay Area <strong>Greenbelt</strong>
Cloverdale<br />
S o n o m a<br />
Healdsburg<br />
N a p a<br />
Santa Rosa<br />
Rohnert Park<br />
Sonoma<br />
Petaluma<br />
M a r i n<br />
<strong>2006</strong> Edition
Alameda County<br />
County progress, Tri-Valley pressure<br />
General Assessment<br />
Alameda County has made significant<br />
progress in securing its greenbelt, but<br />
challenges remain. The 2000 elections<br />
in particular were a landmark<br />
in the county’s land-use history, with<br />
voters passing crucial greenbelt<br />
protection measures. Going forward,<br />
more responsible city policies will be<br />
needed, as well as continued vigilance<br />
against developer-backed attempts to<br />
roll back growth limits.<br />
Hot Spots<br />
The east county cities of Livermore,<br />
Pleasanton, and Dublin remain the<br />
focus of land-use controversies in<br />
Alameda County. Virtually all of the<br />
county’s 15,000 acres that remain at<br />
high risk are around these cities. The<br />
flat ranchlands north of Livermore<br />
remain a prime target of developers,<br />
despite an urban growth boundary<br />
protecting the area. Developer Pardee<br />
Homes placed an initiative on the<br />
2005 ballot to allow 2,450 houses on<br />
1,500 acres of the land, but failed<br />
thanks to the concerted efforts of<br />
local activists. Despite the progress<br />
made in recent years, the growth<br />
pressures in these Tri-Valley cities<br />
could still increase Alameda County’s<br />
total urbanized area by more than<br />
10% in just the next 10 years.<br />
Bright Spots<br />
The passage of Measure D by county<br />
voters in 2000 laid down a key<br />
cornerstone for long-term greenbelt<br />
protection in Alameda County. The<br />
measure established a county urban<br />
growth boundary, prohibited subdivision<br />
of ranchlands in the east county,<br />
and encouraged investment in<br />
existing urbanized areas, extending<br />
regulatory protection to as much as<br />
150,000 acres of farm, ranch and<br />
habitat lands. In the same election,<br />
Dublin voters passed Measure M to<br />
protect 4,000 acres of hill country,<br />
and county voters overwhelmingly<br />
passed the transit-friendly transportation<br />
sales tax Measure B.<br />
Progress continued in 2002, when<br />
Fremont also passed a hillside<br />
protection ordinance, and the<br />
Livermore City Council established<br />
the North Livermore Urban Growth<br />
Boundary, connecting to the existing<br />
South Livermore Urban Growth<br />
Boundary to complete the boundary<br />
around the city. In 2004, voters in the<br />
western parts of Alameda and Contra<br />
Costa County bolstered financial<br />
support for the western, more heavily<br />
used parts of the East Bay Regional<br />
Park District, by passing Measure CC<br />
in the 2004 elections.<br />
580<br />
Oakland<br />
High <strong>Risk</strong><br />
Medium <strong>Risk</strong><br />
Low <strong>Risk</strong><br />
Urban<br />
Protected<br />
10 Miles<br />
92<br />
Hayward<br />
880<br />
kN<br />
Fremont<br />
The County Board of Supervisors<br />
also has maintained its important<br />
policy of requiring large minimum<br />
lot sizes for rural parcels, helping to<br />
preserve the viability of remaining<br />
agricultural lands.<br />
Dublin<br />
Pleasanton<br />
Livermore<br />
Acres<br />
High <strong>Risk</strong> 15,000<br />
Medium <strong>Risk</strong> 11,100<br />
Low <strong>Risk</strong> 203,000<br />
Urban 144,000<br />
Protected 104,700<br />
Total 477,800<br />
580<br />
18<br />
<strong>At</strong> <strong>Risk</strong>: The Bay Area <strong>Greenbelt</strong>
Contra Costa County<br />
Defining effective urban growth boundaries<br />
General Assessment<br />
With the third largest area of land at<br />
risk (82,200 acres), Contra Costa<br />
County remains a central battleground<br />
in the fight to save the Bay<br />
Area’s greenbelt. The last 5 years<br />
have seen a mixture of progress and<br />
continuing severe threats, as voters<br />
and the County Board of Supervisors<br />
have made efforts to rein in developers<br />
and east county cities bent on<br />
sprawl.<br />
Hot Spots<br />
The east county cities of Brentwood,<br />
Antioch, and Pittsburg are still among<br />
the hottest of sprawl hot spots in the<br />
entire Bay Area. Developers in<br />
Antioch and Pittsburg gained voter<br />
approval in 2005 for expansive<br />
urban growth boundaries that allow<br />
them to develop thousands of acres<br />
of greenbelt land outside the county’s<br />
existing boundary.<br />
Bright Spots<br />
The bogus developer-backed urban<br />
growth boundaries in Antioch and<br />
Pittsburg come in response to<br />
important improvements in the<br />
county’s growth policies. The most<br />
significant occurred in 2001, when<br />
the County Board of Supervisors<br />
tightened the county’s urban limit<br />
line, saving 14,000 acres of greenbelt<br />
lands from immediate sprawl<br />
pressure. In 2004, Contra Costa<br />
voters passed Measure J, a transportation<br />
sales tax that made transportation<br />
funding to cities contingent on<br />
their either accepting the county’s<br />
urban limit line or passing their own<br />
before 2009. San Ramon voters<br />
approved an urban growth boundary<br />
in their city’s general plan in 2001. In<br />
2004, voters in Hercules placed<br />
Franklin Canyon off-limits to<br />
Acres<br />
High <strong>Risk</strong> 29,300<br />
Medium <strong>Risk</strong> 52,900<br />
Low <strong>Risk</strong> 123,900<br />
Urban 145,200<br />
Protected 111,000<br />
Total 462,400<br />
Note: Columns may not add up precisely due to rounding.<br />
development, and 2002 brought the<br />
culmination to a long campaign to<br />
make 4,400-acre Cowell Ranch into<br />
a state park.<br />
The renewal of the county’s urban<br />
limit line, which may occur in <strong>2006</strong>,<br />
offers the next opportunity to<br />
strengthen greenbelt protections in<br />
this fast-growing county.<br />
A similar proposal failed in<br />
Brentwood, but the City Council<br />
continues to plan for massive sprawl<br />
to the south and east. Antioch also<br />
continues to plan for 2,500 houses in<br />
the Sand Creek area, despite strong<br />
public opposition.<br />
Richmond<br />
580<br />
80<br />
Hercules<br />
Pittsburg<br />
Concord<br />
Walnut Creek<br />
4<br />
Antioch<br />
Oakley<br />
Brentwood<br />
Other hot spots are flaring up as well,<br />
as Oakley is considering a dangerous<br />
proposal to construct up to 4,300<br />
houses on a flood-prone island in the<br />
Sacramento-San Joaquin Delta.<br />
Concord is beginning a process to<br />
decide how to re-use the recently<br />
mothballed Concord Naval Weapons<br />
Station, considering up to 13,000<br />
new houses at the 5,100-acre site.<br />
Concord is also positioning itself to<br />
develop the rest of the base, should<br />
the military close the 1,600-acre area<br />
adjacent to Suisun Bay.<br />
High <strong>Risk</strong><br />
Medium <strong>Risk</strong><br />
Low <strong>Risk</strong><br />
Urban<br />
Protected<br />
10 Miles<br />
24<br />
k N<br />
680<br />
San Ramon<br />
Discovery<br />
Bay<br />
<strong>2006</strong> Edition<br />
19
Marin County<br />
Affordability needed to complete the vision<br />
General Assessment<br />
As it has been for many years, Marin<br />
County remains a regional and<br />
national leader in greenbelt land<br />
protection. The county and its<br />
citizens continue to employ a mix of<br />
regulation, acquisition, and easement<br />
strategies to create a strongly protected<br />
and robust greenbelt. For these<br />
land preservation victories to be truly<br />
complete, however, Marin must take<br />
more aggressive steps to improve<br />
housing affordability and stimulate<br />
infill development so that it can<br />
accommodate its fair share of the Bay<br />
Area’s future growth.<br />
Hot Spots<br />
Marin’s total of at-risk lands continues<br />
to drop toward zero, with only<br />
2,600 high-risk acres and only 1,100<br />
medium-risk acres. Nonetheless,<br />
some growth controversies remain.<br />
The St. Vincent’s-Silveira site along<br />
Highway 101 is the largest piece of<br />
developable land in Marin and<br />
remains the object of development<br />
proposals. Debate also continues<br />
about the redevelopment of the San<br />
Quentin prison site.<br />
reliable public transit would help to<br />
create new opportunities for livable<br />
infill growth in Marin. In a positive<br />
first step toward this goal, in <strong>2006</strong>,<br />
Marin County was awarded a federal<br />
grant of $25 million to create a<br />
network linking bicycle and walking<br />
paths with transportation hubs.<br />
The county has also embarked on a<br />
General Plan update that may<br />
designate portions of the Bay coast<br />
for conservation. The update may<br />
also include an affordable housing<br />
“overlay zone,” which would encourage<br />
more compact development in<br />
the county’s central urban corridor.<br />
The County Open Space District and<br />
the non-profit Marin Agricultural<br />
Acres<br />
High <strong>Risk</strong> 2,600<br />
Medium <strong>Risk</strong> 1,100<br />
Low <strong>Risk</strong> 113,200<br />
Urban 41,400<br />
Protected 178,000<br />
Total 336,300<br />
Land Trust continue to be national<br />
leaders in the purchase of agricultural<br />
and conservation easements.<br />
Easements now protect over 37,000<br />
acres of Marin countryside, especially<br />
in the central portion of the county.<br />
This complements the land protected<br />
by purchase as the Golden Gate<br />
National Recreation Area and the<br />
state park system.<br />
The primary challenge for Marin is<br />
to incorporate more compact<br />
development within cities with<br />
homes affordable to a wider range of<br />
incomes, so that people who work in<br />
the county can live there as well. This<br />
will take pressure off the lands (and<br />
the roads) in Marin and beyond.<br />
1 Novato<br />
101<br />
San Rafael<br />
Bright Spots<br />
Marin voters in 2004 passed a transitfriendly<br />
transportation sales tax<br />
called Measure A. In <strong>2006</strong>, these<br />
voters will decide on the fate of a<br />
proposed rail line connecting<br />
Sonoma and Marin’s cities in the<br />
Highway 101 corridor. Efficient and<br />
High <strong>Risk</strong><br />
Medium <strong>Risk</strong><br />
Low <strong>Risk</strong><br />
Urban<br />
Protected<br />
5 Miles<br />
k N<br />
Mill Valley<br />
20<br />
<strong>At</strong> <strong>Risk</strong>: The Bay Area <strong>Greenbelt</strong>
Napa County<br />
A crucial crossroads<br />
General Assessment<br />
Napa County, with its worldrenowned<br />
vineyards, has long been a<br />
leader in agricultural land preservation<br />
thanks to its 1990 countywide<br />
land protection ordinance, called<br />
Measure J. With the glaring exception<br />
of American Canyon, its cities<br />
have also generally embraced good<br />
growth policies. Napa voters will<br />
make another crucial land-use<br />
decision, with repercussions far<br />
beyond the county, when they vote in<br />
June <strong>2006</strong> on Measure A, an extreme<br />
private property initiative modeled<br />
after Oregon’s disastrous Measure 37.<br />
Hot Spots<br />
Passage of Measure A would cripple<br />
greenbelt protection efforts throughout<br />
Napa and give private property<br />
extremists a crucial beachhead in<br />
California. The measure would force<br />
public agencies to pay landowners<br />
for claimed reductions of their<br />
property values resulting from new<br />
land-use policies (like renewal of<br />
Measure J) that protect the public<br />
values of the greenbelt. This would<br />
place an impossible fiscal burden on<br />
the County, effectively freezing landuse<br />
regulation and allowing sprawl<br />
developers unprecedented access to<br />
greenbelt lands.<br />
Furthermore, long-considered<br />
potential expansions of Highways 12<br />
and 29 could open the door to new<br />
development pressures.<br />
Bright Spots<br />
In 2004, developers attempted to<br />
erode the mandates of Measure J—<br />
the county’s strong agricultural land<br />
protection policy—by sponsoring<br />
three ballot initiatives to create<br />
specific exemptions to it and allow<br />
new sprawl development. Napa<br />
voters rejected all three of these<br />
measures, a resounding re-affirmation<br />
of support for Measure J. In<br />
<strong>2006</strong>, a ballot measure to create an<br />
Calistoga<br />
St. Helena<br />
128<br />
Acres<br />
High <strong>Risk</strong> 9,700<br />
Medium <strong>Risk</strong> 12,500<br />
Low <strong>Risk</strong> 340,500<br />
Urban 21,400<br />
Protected 99,300<br />
Total 483,400<br />
open space district will go before<br />
voters. Passage of this measure would<br />
complement the efforts of the Napa<br />
Land Trust, and would relieve Napa<br />
of its status as one of only two<br />
counties in the Bay Area without an<br />
open space district to provide<br />
permanent greenbelt protection.<br />
High <strong>Risk</strong><br />
Medium <strong>Risk</strong><br />
Low <strong>Risk</strong><br />
Urban<br />
Protected<br />
In the county’s existing landscape,<br />
the biggest hot spot remains American<br />
Canyon, which still lacks land-use<br />
controls of any kind and permits<br />
widespread sprawl development at<br />
the southern gateway to the Valley.<br />
Although Napa generally has continued<br />
to make progress in reducing<br />
high-risk land and has good underlying<br />
greenbelt protections, it is the<br />
only county in the Bay Area in which<br />
the overall extent of threatened land<br />
has risen since 2000 (by 14%).<br />
29<br />
Napa<br />
121<br />
American<br />
Canyon<br />
5 Miles<br />
k N<br />
<strong>2006</strong> Edition<br />
21
San Francisco County<br />
Planning for infill development<br />
General Assessment<br />
The City and County of San<br />
Francisco does not possess any<br />
threatened greenbelt land, but it has<br />
an important role to play in protecting<br />
regional open space and improving<br />
the Bay Area’s overall growth<br />
patterns. To fulfill its role as a center<br />
city and a major job center, San<br />
Francisco must continue expanding<br />
its recent initiatives to encourage<br />
livable and affordable infill growth.<br />
Hot Spots<br />
There is no at-risk acreage within the<br />
City and County of San Francisco.<br />
San Francisco’s challenge is in<br />
creating homes that local workers<br />
can afford. Housing prices are out<br />
of reach for many families, who are<br />
forced to look for homes in distant<br />
areas; this contributes to sprawl<br />
development, traffic congestion, and<br />
loss of greenbelt lands throughout<br />
the Bay Area.<br />
Bright Spots<br />
Since 2000, San Francisco has<br />
pursued several important planning<br />
initiatives to encourage new construction<br />
in particular areas of the<br />
city, especially around transit.<br />
cation. The City has also embarked<br />
upon a Downtown Neighborhoods<br />
Initiative to house as many as 40,000<br />
new residents downtown. The City<br />
has finished the Rincon Hill Plan to<br />
bring high-density housing and<br />
commercial space to the area just<br />
west of the foot of the Bay Bridge,<br />
within walking distance of downtown<br />
San Francisco. This plan,<br />
endorsed by <strong>Greenbelt</strong> <strong>Alliance</strong>, is<br />
the first new neighborhood plan<br />
approved by the Planning<br />
Commission in over a decade.<br />
The Mission Bay redevelopment,<br />
whose plan was long ago endorsed by<br />
<strong>Greenbelt</strong> <strong>Alliance</strong> and has now<br />
come into fruition as a project, has<br />
completed a considerable amount of<br />
High <strong>Risk</strong><br />
Medium <strong>Risk</strong><br />
Low <strong>Risk</strong><br />
Urban<br />
Protected<br />
construction, and will ultimately<br />
create 6,000 homes, with 49 acres of<br />
open space and parks, and nearly 10<br />
million square feet of office, retail,<br />
research and educational space.<br />
Large-scale infill developments like<br />
these, near transit and jobs, will help<br />
to accommodate significant growth<br />
and add to the region’s quality of life.<br />
101<br />
Acres<br />
High <strong>Risk</strong> 0<br />
Medium <strong>Risk</strong> 0<br />
Low <strong>Risk</strong> 600<br />
Urban 24,900<br />
Protected 5,100<br />
Total 30,600<br />
Under its Better Neighborhoods<br />
2002 planning process, the Planning<br />
Department is working on area plans<br />
for Balboa Park, the Market and<br />
Octavia Street neighborhood, and the<br />
Central Waterfront to increase<br />
housing, office and retail construction<br />
in these transit-rich districts. In<br />
addition, it is undertaking an Eastern<br />
Neighborhoods Community Planning<br />
Initiative for the Mission, Visitacion<br />
Valley, Bayview, South of Market,<br />
and Showplace Square/Potrero Hill,<br />
which seeks to increase housing<br />
construction without fueling gentrifi-<br />
1 Mile<br />
kN<br />
1<br />
S a n F r a n c i s c o<br />
280<br />
22<br />
<strong>At</strong> <strong>Risk</strong>: The Bay Area <strong>Greenbelt</strong>
San Mateo County<br />
From greenbelt protection to smart infill<br />
General Assessment<br />
San Mateo County solidified its<br />
status as a leader in protecting<br />
greenbelt land over the last 5 years.<br />
With large public land holdings and<br />
active land protection activities by<br />
the Mid-Peninsula Regional Open<br />
Space District and the Peninsula<br />
Open Space Trust, San Mateo’s total<br />
acreage of land at risk is relatively<br />
small, totaling 10,200 acres.<br />
Hot Spots<br />
As with Marin County, San Mateo’s<br />
primary challenge lies in making its<br />
already urbanized areas more<br />
affordable and livable, so that it can<br />
continue to accommodate its share of<br />
future Bay Area growth and improve<br />
social equity. In general, a changing<br />
economic and political climate has<br />
contributed to a lessening of growth<br />
pressures around the coastal cities of<br />
Half Moon Bay and Pacifica,<br />
although much of the land around<br />
those cities remains at medium risk<br />
of development.<br />
been the focus of many development<br />
proposals, was permanently protected<br />
as part of the Golden Gate<br />
National Recreation Area.<br />
Since 2000, four new BART stations<br />
in the county and the connection of<br />
BART to CalTrain at Millbrae have<br />
created valuable new opportunities<br />
for regional integration and smart<br />
growth in San Mateo County. In<br />
2004, Measure A, a transit-friendly<br />
transportation sales tax, won voter<br />
approval, further enhancing San<br />
Mateo County’s infill potential. In<br />
2005, the City of San Mateo approved<br />
a good example of transit-oriented<br />
development, Bay Meadows Phase II,<br />
Pacifica<br />
101<br />
San Mateo<br />
92<br />
Acres<br />
High <strong>Risk</strong> 2,000<br />
Medium <strong>Risk</strong> 8,200<br />
Low <strong>Risk</strong> 100,400<br />
Urban 71,100<br />
Protected 107,800<br />
Total 289,500<br />
which would replace the aging Bay<br />
Meadows racetrack with a new<br />
neighborhood next to a CalTrain<br />
station. The “Grand Boulevard”<br />
effort to revitalize El Camino Real<br />
will also help accommodate new<br />
growth and better use urbanized<br />
land in both San Mateo and Santa<br />
Clara County.<br />
Bright Spots<br />
The Mid-Peninsula Regional Open<br />
Space District won authorization to<br />
expand its jurisdiction all the way to<br />
the Pacific Coast in 2004, 6 years<br />
after voters recommended the change.<br />
This move complements the<br />
Peninsula Open Space Trust’s “Saving<br />
the Endangered Coast” campaign,<br />
launched in 2001, which has protected<br />
more than 14,000 acres in<br />
western San Mateo County. A major<br />
effort to restore some of the Bay’s<br />
lost wetlands by acquiring and<br />
restoring salt ponds has also protected<br />
baylands on the edge of Menlo<br />
Park.<br />
High <strong>Risk</strong><br />
Medium <strong>Risk</strong><br />
Low <strong>Risk</strong><br />
Urban<br />
Protected<br />
Half<br />
Moon<br />
Bay<br />
1<br />
280<br />
Redwood<br />
City<br />
In 2000, Mori Point, a coastal<br />
promontory above Pacifica that had<br />
5 Miles<br />
kN<br />
<strong>2006</strong> Edition<br />
23
Santa Clara County<br />
A sprawling past and changing future<br />
General Assessment<br />
Today, Santa Clara County faces<br />
crucial decisions about its future. The<br />
proposal to develop housing for up<br />
to 80,000 people in Coyote Valley in<br />
southeast San Jose, and ongoing<br />
sprawl pressure in Morgan Hill and<br />
Gilroy, mean that planning actions<br />
made in south Santa Clara in the<br />
next few years will shape the county<br />
for decades to come.<br />
Hot Spots<br />
Ever since the City of San Jose began<br />
its latest round of planning for the<br />
development of Coyote Valley in<br />
1999, it has been one of the largest<br />
development hot spots in the Bay<br />
Area. The City’s goal is the creation<br />
of 25,000 homes and 50,000 jobs on<br />
6,800 acres of land—essentially the<br />
creation of an entire new town.<br />
Unfortunately, the City’s plans for the<br />
valley thus far have not lived up to its<br />
stated smart growth goals.<br />
Bright Spots<br />
With these threats, there have also<br />
been some important improvements<br />
in the county. In 2000, San Jose<br />
residents voted to strengthen the City<br />
Council’s urban growth boundary,<br />
protecting more than 20,000 acres.<br />
In 2001, the City Council passed 15<br />
general plan amendments encouraging<br />
infill and affordable housing, and<br />
the City now has large-scale plans to<br />
redevelop the industrial North First<br />
Street area and add thousands of new<br />
homes to the downtown. In 2002,<br />
county property owners voted to<br />
provide $80 million over 10 years to<br />
fund the Santa Clara County Open<br />
Space Authority.<br />
Acres<br />
High <strong>Risk</strong> 21,300<br />
Medium <strong>Risk</strong> 54,000<br />
Low <strong>Risk</strong> 377,600<br />
Urban 185,100<br />
Protected 201,800<br />
Total 839,800<br />
In <strong>2006</strong>, Santa Clara County voters<br />
will decide on an initiative to prevent<br />
sprawl development and parcelization<br />
on rural county land.<br />
The far southern end of the county<br />
also remains a key hot spot, as<br />
Morgan Hill and Gilroy grapple with<br />
sprawl pressures both from Silicon<br />
Valley and the south. Morgan Hill<br />
began studying an expansion of its<br />
urban growth boundary in 2003;<br />
1,250 acres of farmland outside the<br />
boundary are now at risk. Likewise,<br />
the Gilroy City Council voted in<br />
2002 to allow development on 660<br />
previously protected acres of the<br />
Santa Clara County Agricultural<br />
Preserve. In 2005, Gilroy passed up<br />
an opportunity to join the county’s<br />
open space district. South of Gilroy,<br />
Sargent Ranch, 6,500 acres of<br />
farmland and wildlife habitat,<br />
remains under threat in spite of the<br />
defeat in 2001 of a major development<br />
proposal.<br />
San Jose<br />
17<br />
85<br />
High <strong>Risk</strong><br />
Medium <strong>Risk</strong><br />
Low <strong>Risk</strong><br />
Urban<br />
Protected<br />
kN<br />
10 Miles<br />
101<br />
Morgan<br />
Hill<br />
Gilroy<br />
24<br />
<strong>At</strong> <strong>Risk</strong>: The Bay Area <strong>Greenbelt</strong>
Solano County<br />
Cities should follow county’s lead<br />
General Assessment<br />
For the first time, Solano County<br />
now has more land at risk than any<br />
other Bay Area county, a total of<br />
93,300 acres. As in Contra Costa,<br />
Solano County’s eastern cities are<br />
actively planning for large-scale<br />
sprawl development in the face of<br />
responsible county policy. Given the<br />
county’s pivotal position between the<br />
Bay Area and the Sacramento region,<br />
it is critical that these cities, especially<br />
Vacaville, embrace sound greenbelt<br />
protection principles.<br />
Hot Spots<br />
With I-80 coursing through the<br />
middle of the county and providing<br />
commute potential to both<br />
Sacramento and the Bay Area,<br />
thousands of acres in this county are<br />
subject to intense development<br />
pressure. This pressure is exacerbated<br />
by a lack of growth management<br />
policies in the east county cities of<br />
Vacaville, Dixon and Rio Vista. In<br />
2002, the city of Vacaville proposed a<br />
“vision” to annex and develop over<br />
4,000 acres of open space, but public<br />
opposition forced the city to shelve<br />
the plan.<br />
Bright Spots<br />
Cities in the southern and western<br />
portion of the county have made<br />
significant strides in greenbelt<br />
protection. In 2003, Fairfield voters<br />
passed Measure L, which both<br />
established an urban growth boundary<br />
and gave voters approval power<br />
over projects outside the boundary.<br />
This helped protect 60,000 acres in<br />
Green Valley and Suisun Valley, and<br />
around Travis Air Force Base. The<br />
same year, Benicia voters passed a<br />
measure with similar provisions that<br />
helped protect 14,000 acres, including<br />
Sky Valley. In the 2002 and 2004<br />
elections, county voters rejected<br />
highway-heavy transportation sales<br />
High <strong>Risk</strong><br />
Medium <strong>Risk</strong><br />
Low <strong>Risk</strong><br />
Urban<br />
Protected<br />
Vacaville<br />
Dixon<br />
Acres<br />
High <strong>Risk</strong> 31,900<br />
Medium <strong>Risk</strong> 61,400<br />
Low <strong>Risk</strong> 315,900<br />
Urban 55,400<br />
Protected 66,000<br />
Total 530,600<br />
tax measures, but a transportation<br />
measure on the ballot for <strong>2006</strong><br />
contains better support for public<br />
transit. The county also appears to be<br />
on its way to putting the Orderly<br />
Growth Initiative before voters for<br />
renewal.<br />
The bedrock of Solano County’s<br />
greenbelt protection, the Orderly<br />
Growth Initiative, prohibits sprawling<br />
residential development on<br />
county land. The Orderly Growth<br />
Initiative must be renewed by 2010<br />
to prevent roughly half a million<br />
acres of Solano’s greenbelt from<br />
coming under sprawl pressure. In<br />
2004, the County Board of<br />
Supervisors voted down legislation to<br />
begin establishment of a county park<br />
system. Solano remains one of only<br />
two Bay Area counties (with Napa)<br />
without an open space district.<br />
Vallejo<br />
10 Miles<br />
kN<br />
680<br />
Benicia<br />
80<br />
Fairfield<br />
Rio Vista<br />
<strong>2006</strong> Edition<br />
25
Sonoma County<br />
City boundaries in place, but challenges remain<br />
General Assessment<br />
With urban growth boundaries in<br />
place around eight of Sonoma’s nine<br />
cities, achieving a secure greenbelt in<br />
Sonoma County now depends largely<br />
on the County. Voters missed their<br />
chance to take action at the ballot<br />
box in 2000, but the County’s<br />
General Plan update process presents<br />
a new opportunity. Cities can also do<br />
their part by encouraging better infill<br />
development. Sonoma County now<br />
has the second largest area of at-risk<br />
land in the Bay Area, 88,300 acres.<br />
Hot Spots<br />
The city of Cloverdale, in the far<br />
north of the county, is the county’s<br />
only city without an urban growth<br />
boundary. Its current General Plan<br />
update process could address sprawl<br />
pressures by including an urban<br />
growth boundary and bringing it to a<br />
vote of the people.<br />
County Agricultural Preservation and<br />
Open Space District has been an<br />
active purchaser of land and easements<br />
throughout Sonoma County,<br />
conserving over 30,000 acres of land<br />
since 2000. In 2004, together with<br />
the Sonoma Land Trust, the district<br />
also permanently protected the 640-<br />
acre area of San Pablo Baylands<br />
where a casino was proposed.<br />
Sonoma County has also made<br />
important progress in supporting<br />
infill development and affordability.<br />
In 2004, Petaluma approved a jobshousing<br />
linkage fee on new development.<br />
Then in 2005, the County<br />
Board of Supervisors approved<br />
Cloverdale<br />
Acres<br />
High <strong>Risk</strong> 13,400<br />
Medium <strong>Risk</strong> 74,900<br />
Low <strong>Risk</strong> 719,200<br />
Urban 72,800<br />
Protected 133,600<br />
Total 1,013,900<br />
policies to encourage affordable<br />
housing, including an inclusionary<br />
housing ordinance and a jobshousing<br />
linkage fee. In this area, the<br />
County’s example would be a good<br />
one for other counties and for its<br />
cities to follow.<br />
However, city boundaries are only<br />
the first step; Sonoma County’s<br />
greenbelt will continue to be at risk<br />
as long as its General Plan lacks<br />
strong policies to prevent sprawl on<br />
county land. Largely for this reason,<br />
Sonoma County is the most parcelized<br />
county in California. Many<br />
development proposals have come<br />
forward in the absence of clear limits<br />
on development on county lands.<br />
One proposal would have put a<br />
casino on coastal wetlands, and then<br />
on a site outside Rohnert Park’s<br />
urban growth boundary, before the<br />
site was finally moved inside the city.<br />
Bright Spots<br />
The cities of Sonoma and Rohnert<br />
Park established their urban growth<br />
boundaries in the 2000 election,<br />
protecting almost 30,000 greenbelt<br />
acres between them. The Sonoma<br />
High <strong>Risk</strong><br />
Medium <strong>Risk</strong><br />
Low <strong>Risk</strong><br />
Urban<br />
Protected<br />
10 Miles<br />
kN<br />
101<br />
Healdsburg<br />
Santa Rosa<br />
Rohnert<br />
Park<br />
101<br />
Petaluma<br />
116<br />
12<br />
Sonoma<br />
26<br />
<strong>At</strong> <strong>Risk</strong>: The Bay Area <strong>Greenbelt</strong>
Achieving the Vision<br />
With 401,500 acres of greenbelt<br />
lands at risk, the Bay Area has a long<br />
way to go to reach the goal of a fully<br />
protected regional greenbelt.<br />
Continued speculative development<br />
pressure on the far edges of the<br />
region, disputes over urban growth<br />
boundaries, the need to renew key<br />
greenbelt protection measures, and<br />
the ongoing threat of parcelization<br />
all add up to serious risk to greenbelt<br />
lands. Contributing to this risk is the<br />
need for many parts of the region to<br />
significantly increase their commitment<br />
to infill development, affordable<br />
housing, and transit.<br />
However, the goal is closer than it has<br />
ever been. The tools are all here: the<br />
Bay Area has the institutions, the<br />
knowledge, and the public support to<br />
fully protect its greenbelt of open<br />
space.<br />
But full greenbelt protection cannot<br />
be achieved all at once; the decisions<br />
The Bay Area is a spectacular place. Will uncontrolled growth dominate the landscape<br />
and make this a worse place to live Or will the region pursue city-centered growth and<br />
greenbelt protection to make its future even better Bay Area residents and their elected<br />
leaders must decide.<br />
that protect this regional asset are<br />
local. City by city, county by county,<br />
the region’s residents and their<br />
elected leaders decide the region’s<br />
future. Those decisions become<br />
critical as the region prepares for a<br />
million more people by 2020.<br />
That is the promise that brings<br />
people to this remarkable region: that<br />
the Bay Area’s vibrant cities, productive<br />
farms, and spectacular natural<br />
landscapes will remain intact and<br />
inviting for years and generations to<br />
come.<br />
It is up to all the Bay Area’s residents<br />
to fulfill that promise.<br />
Photo: Galen Rowell/Mountain Light<br />
<strong>2006</strong> Edition<br />
27
Methods<br />
The <strong>2006</strong> <strong>At</strong> <strong>Risk</strong> report is based on the analysis<br />
of data collected in 2005.<br />
Defining <strong>Risk</strong><br />
As in previous editions, the <strong>2006</strong> <strong>At</strong> <strong>Risk</strong> report<br />
divides the Bay Area’s land into five categories:<br />
ü High risk: <strong>Greenbelt</strong> lands that, for a variety of<br />
factors cited below, are likely to be developed or<br />
taken out of greenbelt uses (such as productive<br />
agriculture, open space, wildlife habitat, and<br />
recreation areas) in the next 10 years.<br />
ü Medium risk: <strong>Greenbelt</strong> lands that are likely to be<br />
developed or taken out of greenbelt uses in the<br />
next 30 years. Rural lands that are parcelized<br />
for rural residential uses are also considered<br />
medium-risk lands, since these uses generally<br />
preclude productive farming and create<br />
conditions that favor eventual suburban sprawl.<br />
ü Low risk: <strong>Greenbelt</strong> lands that, for a variety of<br />
policy, geographic, or political reasons, are not<br />
likely to be developed in the next 30 years.<br />
ü Secure greenbelt: <strong>Greenbelt</strong> lands that are<br />
permanently protected from development,<br />
including most public lands, land trust<br />
properties, conservation easements, and private<br />
lands that are securely protected by a vote of<br />
the people. Most city parks and open spaces are<br />
not included in the secure greenbelt because<br />
data from some cities was not available at the<br />
time the maps were created.<br />
ü Urban: Lands that are developed at a density of<br />
at least one residential dwelling unit per 1.5<br />
acres, or the equivalent structure density for<br />
commercial or industrial development.<br />
<strong>Risk</strong> Factors<br />
ü Approved or proposed development: <strong>Greenbelt</strong><br />
lands that have already been approved for<br />
development or are the object of a current<br />
development proposal, are considered at-risk.<br />
A current development proposal means that a<br />
landowner has formally applied for relevant<br />
development or construction permits, applied<br />
for a zoning change, or otherwise made public<br />
the intention to develop the land (or sell it to<br />
someone who will develop it).<br />
ü Designation in a city or county General Plan or zoning<br />
code: A given land area is considered at-risk if it<br />
is zoned or otherwise designated in a General<br />
Plan for residential, commercial or industrial<br />
development at densities of more than one unit<br />
per 1.5 acres, or the equivalent structure density<br />
for commercial or industrial development.<br />
ü Historical development threat: A given land area<br />
may be considered at-risk if it has previously<br />
been the object of development proposals or<br />
applications, or is the subject of ongoing legal or<br />
political conflict about its development<br />
potential, and no policies are in place to prevent<br />
its development.<br />
ü Inside relevant urban limits: A given land area is<br />
considered at-risk if it is within city limits,<br />
within an urban growth boundary, or within a<br />
city’s sphere of influence (i.e., its planned area of<br />
future expansion). Good development on these<br />
lands is preferable to development outside city<br />
boundaries, and can help to protect the region’s<br />
greenbelt as a whole. However, these lands are<br />
still at risk of sprawl development.<br />
ü Adjacent to existing development: A given land<br />
area is considered at risk if it is directly adjacent<br />
to land that is already developed, proposed for<br />
development, or approved for development at a<br />
density of at least one unit per 1.5 acres, and<br />
there are no policies in place to prevent its<br />
development.<br />
ü Infrastructure services: given land area is<br />
considered at risk if it already has direct access<br />
to municipal water and sewer services, and no<br />
policies are in place to prevent its development.<br />
ü Regional transportation access: A given land area<br />
is considered at risk if it has access to the<br />
regional transportation network (either roads or<br />
transit), or is in an area that will be made<br />
accessible by adopted local and regional<br />
transportation plans, and no policies are in<br />
place to prevent its development.<br />
ü Parcelization: A given land area is considered at<br />
risk if parcel sizes are 5 acres or smaller, and no<br />
policies are in place to prevent its development.<br />
ü Development speculation: A given land area is<br />
considered at risk if it has been offered at prices<br />
commensurate with its development value, as<br />
opposed to its agricultural value, and there are<br />
no policies in place to prevent its development.<br />
ü Topography: A given land area’s risk appraisal<br />
may be altered (in either direction) based on the<br />
physical feasibility of development given the<br />
slopes and soil stability.<br />
ü Other risk factors: Some areas are at-risk due to<br />
proposals for development projects that are not<br />
included in adopted city, county or regional<br />
plans. Examples of such development include<br />
military bases, casinos, stadiums, educational<br />
campuses, and energy plants.<br />
In general, high-risk lands are characterized by<br />
buildable terrain, proximity to existing urban<br />
areas and transportation infrastructure,<br />
designation as developable in a county or city<br />
general plan, and/or development speculation.<br />
Medium-risk lands share many of these factors,<br />
but often to a lesser degree. Medium-risk lands<br />
are generally farther away from existing urban<br />
areas. Additionally, lands that are at risk of<br />
parcelization, but lack any other risk factor, are<br />
considered medium-risk lands. Lands that are at<br />
risk from any of the above factors, but are<br />
protected from development by a given policy, are<br />
classified as at-risk if that policy is likely to expire<br />
and open those lands to development within the<br />
next 10 years (high risk) or 30 years (medium risk).<br />
<strong>Risk</strong> Assessment<br />
<strong>Risk</strong> analysis was undertaken in 2005 by<br />
<strong>Greenbelt</strong> <strong>Alliance</strong> field staff, each of whom is<br />
familiar with development issues in two Bay Area<br />
counties. The field staff consulted all relevant city<br />
and county planning and zoning documents, as<br />
well as other maps issued by relevant government<br />
Table 4: Adjusted 2000 <strong>At</strong>-<strong>Risk</strong> Findings<br />
High-<strong>Risk</strong><br />
Acres<br />
Medium-<strong>Risk</strong><br />
Acres<br />
Low-<strong>Risk</strong><br />
Acres<br />
agencies, to precisely identify which land areas<br />
are subject to the risk factors identified above. In<br />
addition, staff consulted with city and county<br />
planners, agency officials, and <strong>Greenbelt</strong> <strong>Alliance</strong><br />
associates to gather additional information.<br />
Urban and Permanently Protected Lands<br />
The State of California’s Farmland Mapping and<br />
Monitoring Project provided the base map of<br />
urbanized areas, based on satellite images of the<br />
San Francisco Bay Area in 2001 and 2002. Secure<br />
greenbelt lands were mapped by the Bay Area<br />
Open Space Council in early 2005. <strong>Greenbelt</strong><br />
<strong>Alliance</strong> field staff made limited updates to both<br />
the urban and secure greenbelt map layers to<br />
account for notable changes that occurred before<br />
October 2005. The lands defined by these two<br />
data layers were not subjected to risk analysis.<br />
Mapping Methods<br />
For the risk assessment, <strong>Greenbelt</strong> <strong>Alliance</strong> staff<br />
evaluated and mapped individual “risk zones,”<br />
geographic units of analysis that vary in size.<br />
Some units are as small as a single individual<br />
parcel; some are clusters of parcels that are at risk<br />
for the same reason.<br />
The risk maps were digitized and tiled together<br />
using the Geographic Information System (GIS)<br />
software ArcGIS 9.1, to create a regional<br />
composite map. From this composite map,<br />
regional and county-by-county summary data<br />
were calculated. This map also formed the basis of<br />
comparison with the 2000 data. The GIS also<br />
facilitated calculation of the changes in the<br />
geographic extent of various risk categories, the<br />
fate of previously at-risk lands, and the<br />
proportion of land at risk due to a given risk<br />
factor, at both at the regional and county level.<br />
Comparing 2000 and <strong>2006</strong><br />
Significant improvements in mapping techniques<br />
over the last 5 years required that the 2000 spatial<br />
data be adjusted in order to be exactly comparable<br />
with that of <strong>2006</strong>. The datasets mapped in<br />
the 2000 report for urban land and open space<br />
were replaced with more accurate datasets for<br />
2000 issued by the Farmland Mapping and<br />
Monitoring Project and the Bay Area Open Space<br />
Council, respectively. After the changes were<br />
made, the geographic extent of various risk<br />
categories in 2000 was recalculated to allow accurate<br />
comparison with <strong>2006</strong>. Therefore, the total<br />
acreages reported in this document for 2000 differ<br />
from those of the 2000 <strong>At</strong> <strong>Risk</strong> report (Table 4).<br />
Urban<br />
Acres<br />
Protected<br />
Acres<br />
Total<br />
Acres*<br />
Alameda 25,000 11,000 212,500 141,400 95,100 485,000<br />
Contra Costa 54,300 46,100 127,300 142,200 99,100 469,100<br />
Marin 5,300 2,500 131,400 40,500 159,400 339,000<br />
Napa 17,900 1,100 369,300 21,100 76,000 485,300<br />
San Francisco 0 0 600 24,400 5,300 30,300<br />
San Mateo 7,900 10,700 111,200 71,100 91,400 292,400<br />
Santa Clara 37,400 58,100 410,000 184,100 147,800 837,300<br />
Solano 39,900 56,500 346,200 53,800 35,100 531,500<br />
Sonoma 25,700 64,800 770,000 70,700 84,800 1,016,000<br />
Total 213,300 250,800 2,478,500 749,300 794,000 4,486,000<br />
Note: Rows and columns may not add up precisely due to rounding.<br />
*Acreage totals exceed actual land area due to slight overlap between the GIS layer of urban lands prepared by the State of<br />
California’s Farmland Mapping and Monitoring Project, the GIS layer of protected lands prepared by the Bay Area Open Space<br />
Council, and the GIS layer of water from GreenInfo Network. The total error due to overlap is approximately 1.3%.<br />
28 <strong>At</strong> <strong>Risk</strong>: The Bay Area <strong>Greenbelt</strong>
Main Office • 631 Howard Street, Suite 510, San Francisco, CA 94105 • (415) 543-6771<br />
South Bay Office • 1922 The Alameda, Suite 213, San Jose, CA 95126 • (408) 983-0856<br />
East Bay Office • 1601 N. Main Street, Suite 105, Walnut Creek, CA 94596 • (925) 932-7776<br />
Sonoma-Marin Office • 555 5th Street, Suite 300 B, Santa Rosa, CA 95401 • (707) 575-3661<br />
Solano-Napa Office • 1652 West Texas Street, Suite 163, Fairfield, CA 94533 • (707) 427-2308<br />
www.greenbelt.org • info@greenbelt.org