Volumes, volumes, volumes! - Hypack
Volumes, volumes, volumes! - Hypack
Volumes, volumes, volumes! - Hypack

You also want an ePaper? Increase the reach of your titles
YUMPU automatically turns print PDFs into web optimized ePapers that Google loves.
<strong>Volumes</strong>, <strong>volumes</strong>, <strong>volumes</strong>!<br />
by Monicque Lee<br />
As we all know, there are several different ways to calculate <strong>volumes</strong>. There is no one ‘correct’<br />
method for calculating <strong>volumes</strong>, and everyone has their preferred way of going about<br />
this task, depending on individual experience and what is in the contract specifications. For<br />
every method there are both advantages and disadvantages to its use.<br />
On occasion, within the same survey, and even within the same cross section, the different<br />
methods can produce very different results. No need to panic! Let’s take a look at a few<br />
common <strong>Volumes</strong> Methods and explore some of the reasons behind this volume enigma.<br />
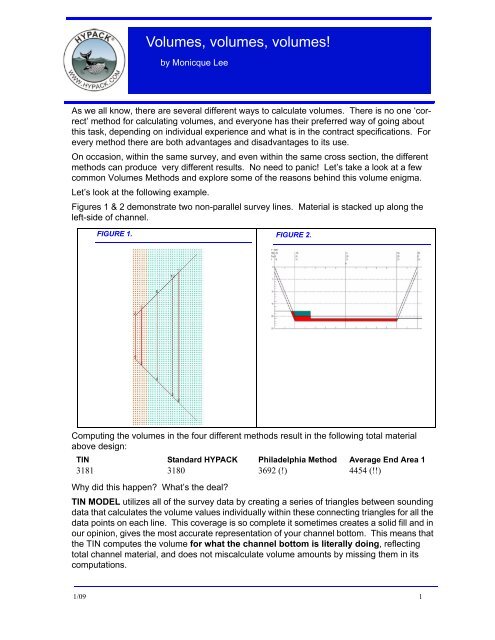
Let’s look at the following example.<br />
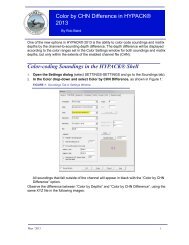
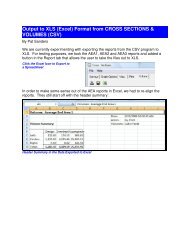
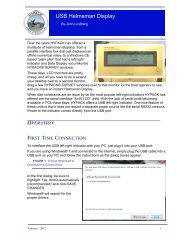
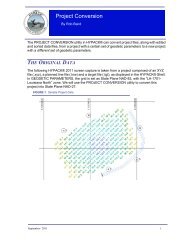
Figures 1 & 2 demonstrate two non-parallel survey lines. Material is stacked up along the<br />
left-side of channel.<br />
FIGURE 1. FIGURE 2.<br />
Computing the <strong>volumes</strong> in the four different methods result in the following total material<br />
above design:<br />
TIN Standard HYPACK Philadelphia Method Average End Area 1<br />
3181 3180 3692 (!) 4454 (!!)<br />
Why did this happen What’s the deal<br />
TIN MODEL utilizes all of the survey data by creating a series of triangles between sounding<br />
data that calculates the volume values individually within these connecting triangles for all the<br />
data points on each line. This coverage is so complete it sometimes creates a solid fill and in<br />
our opinion, gives the most accurate representation of your channel bottom. This means that<br />
the TIN computes the volume for what the channel bottom is literally doing, reflecting<br />
total channel material, and does not miscalculate volume amounts by missing them in its<br />
computations.<br />
1/09 1
<strong>Volumes</strong>, <strong>volumes</strong>, <strong>volumes</strong>!<br />
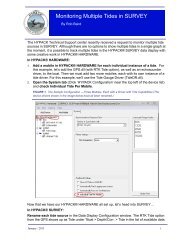
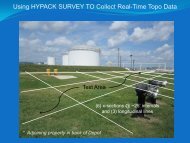
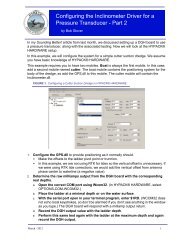
FIGURE 3. <strong>Volumes</strong> calculated in TIN Model<br />
Standard HYPACK (SH) method is not an Average End Area (AEA) method. SH utilizes a<br />
Prismatic Method to calculate <strong>volumes</strong>. This makes SH very similar to a TIN in accuracy.<br />
The Prismatic Method creates prisms between soundings and computes the volume across<br />
the lines, computing and creating a complete detail of what your design is doing and thus not<br />
missing material in these non-parallel survey areas.<br />
The Philadelphia Method is also an AEA but as demonstrated in the above example, it<br />
gives a very different result than the AEA1. Philadelphia Method is more precise than the<br />
AEA1 in non-parallel survey areas because it breaks the channel into Left of Center and<br />
Right of Center and calculates the distance between lines for each 4 zones separately. Philadelphia<br />
is more accurate than AEA1 because its required computations include measurements<br />
within Left of Center and Right of Center that break the areas into smaller zones and<br />
thus minimizing the error in comparison to an AEA1 method.<br />
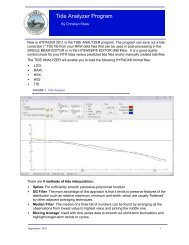
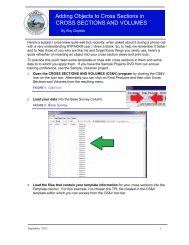
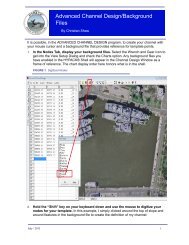
FIGURE 4. Philadelphia Predredge Cross<br />
Section<br />
FIGURE 5. Method measures line<br />
distances separately<br />
2
<strong>Volumes</strong>, <strong>volumes</strong>, <strong>volumes</strong>!<br />
Average End Area 1 (AEA1) is the most common method because of its simplicity but also<br />
the least precise method of calculating actual <strong>volumes</strong> in non-parallel areas because it does<br />
not recognize where the material is actually located. AEA1 breaks the channel into 3 areas<br />
and measures the distance between lines at the center of the channel and at the channel toe<br />
lines. This method of calculation can create errors by underestimating on the outside or overestimating<br />
on the inside material amounts on turns because it basically generates an ‘all or<br />
nothing’ value relative to where the lines fall.<br />
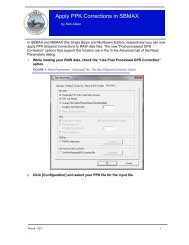
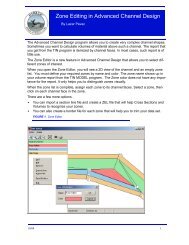
FIGURE 6. Figure 5: Average End Area 1<br />
Cross Section<br />
FIGURE 7. Figure 6: AEA does not figure<br />
Channel Geometry<br />
All AEA methods calculate their <strong>volumes</strong> by utilizing the values for their specific areas and<br />
line distances. This means that AEA methods can sometimes substantially over- or underestimate<br />
material accumulations because they do not take into consideration where the material<br />
is located, and so can create gross differences in volume data.<br />
All of these methods are correct, used daily, and not violating any mathematical rules. They<br />
all calculate exactly what they are being asked but because of the measurement methods<br />
behind the actual formulas, they can produce very different volume results, even within the<br />
same cross section.<br />
1/09 3