Notes on a composite leading indicator of inflation
Notes on a composite leading indicator of inflation
Notes on a composite leading indicator of inflation

Create successful ePaper yourself
Turn your PDF publications into a flip-book with our unique Google optimized e-Paper software.
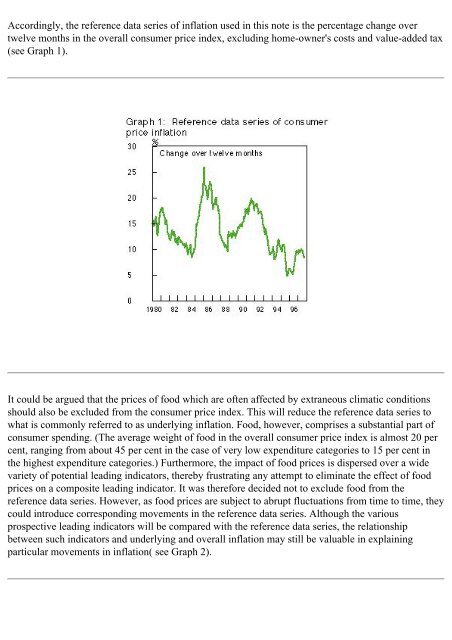
Accordingly, the reference data series <strong>of</strong> inflati<strong>on</strong> used in this note is the percentage change over<br />
twelve m<strong>on</strong>ths in the overall c<strong>on</strong>sumer price index, excluding home-owner's costs and value-added tax<br />
(see Graph 1).<br />
It could be argued that the prices <strong>of</strong> food which are <strong>of</strong>ten affected by extraneous climatic c<strong>on</strong>diti<strong>on</strong>s<br />
should also be excluded from the c<strong>on</strong>sumer price index. This will reduce the reference data series to<br />
what is comm<strong>on</strong>ly referred to as underlying inflati<strong>on</strong>. Food, however, comprises a substantial part <strong>of</strong><br />
c<strong>on</strong>sumer spending. (The average weight <strong>of</strong> food in the overall c<strong>on</strong>sumer price index is almost 20 per<br />
cent, ranging from about 45 per cent in the case <strong>of</strong> very low expenditure categories to 15 per cent in<br />
the highest expenditure categories.) Furthermore, the impact <strong>of</strong> food prices is dispersed over a wide<br />
variety <strong>of</strong> potential <strong>leading</strong> <strong>indicator</strong>s, thereby frustrating any attempt to eliminate the effect <strong>of</strong> food<br />
prices <strong>on</strong> a <strong>composite</strong> <strong>leading</strong> <strong>indicator</strong>. It was therefore decided not to exclude food from the<br />
reference data series. However, as food prices are subject to abrupt fluctuati<strong>on</strong>s from time to time, they<br />
could introduce corresp<strong>on</strong>ding movements in the reference data series. Although the various<br />
prospective <strong>leading</strong> <strong>indicator</strong>s will be compared with the reference data series, the relati<strong>on</strong>ship<br />
between such <strong>indicator</strong>s and underlying and overall inflati<strong>on</strong> may still be valuable in explaining<br />
particular movements in inflati<strong>on</strong>( see Graph 2).