Notes on a composite leading indicator of inflation
Notes on a composite leading indicator of inflation
Notes on a composite leading indicator of inflation

You also want an ePaper? Increase the reach of your titles
YUMPU automatically turns print PDFs into web optimized ePapers that Google loves.
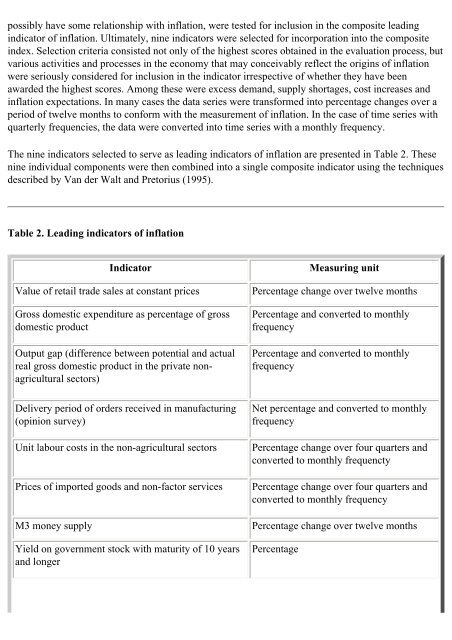
possibly have some relati<strong>on</strong>ship with inflati<strong>on</strong>, were tested for inclusi<strong>on</strong> in the <strong>composite</strong> <strong>leading</strong><br />
<strong>indicator</strong> <strong>of</strong> inflati<strong>on</strong>. Ultimately, nine <strong>indicator</strong>s were selected for incorporati<strong>on</strong> into the <strong>composite</strong><br />
index. Selecti<strong>on</strong> criteria c<strong>on</strong>sisted not <strong>on</strong>ly <strong>of</strong> the highest scores obtained in the evaluati<strong>on</strong> process, but<br />
various activities and processes in the ec<strong>on</strong>omy that may c<strong>on</strong>ceivably reflect the origins <strong>of</strong> inflati<strong>on</strong><br />
were seriously c<strong>on</strong>sidered for inclusi<strong>on</strong> in the <strong>indicator</strong> irrespective <strong>of</strong> whether they have been<br />
awarded the highest scores. Am<strong>on</strong>g these were excess demand, supply shortages, cost increases and<br />
inflati<strong>on</strong> expectati<strong>on</strong>s. In many cases the data series were transformed into percentage changes over a<br />
period <strong>of</strong> twelve m<strong>on</strong>ths to c<strong>on</strong>form with the measurement <strong>of</strong> inflati<strong>on</strong>. In the case <strong>of</strong> time series with<br />
quarterly frequencies, the data were c<strong>on</strong>verted into time series with a m<strong>on</strong>thly frequency.<br />
The nine <strong>indicator</strong>s selected to serve as <strong>leading</strong> <strong>indicator</strong>s <strong>of</strong> inflati<strong>on</strong> are presented in Table 2. These<br />
nine individual comp<strong>on</strong>ents were then combined into a single <strong>composite</strong> <strong>indicator</strong> using the techniques<br />
described by Van der Walt and Pretorius (1995).<br />
Table 2. Leading <strong>indicator</strong>s <strong>of</strong> inflati<strong>on</strong><br />
Indicator<br />
Value <strong>of</strong> retail trade sales at c<strong>on</strong>stant prices<br />
Gross domestic expenditure as percentage <strong>of</strong> gross<br />
domestic product<br />
Output gap (difference between potential and actual<br />
real gross domestic product in the private n<strong>on</strong>agricultural<br />
sectors)<br />
Delivery period <strong>of</strong> orders received in manufacturing<br />
(opini<strong>on</strong> survey)<br />
Unit labour costs in the n<strong>on</strong>-agricultural sectors<br />
Prices <strong>of</strong> imported goods and n<strong>on</strong>-factor services<br />
M3 m<strong>on</strong>ey supply<br />
Yield <strong>on</strong> government stock with maturity <strong>of</strong> 10 years<br />
and l<strong>on</strong>ger<br />
Measuring unit<br />
Percentage change over twelve m<strong>on</strong>ths<br />
Percentage and c<strong>on</strong>verted to m<strong>on</strong>thly<br />
frequency<br />
Percentage and c<strong>on</strong>verted to m<strong>on</strong>thly<br />
frequency<br />
Net percentage and c<strong>on</strong>verted to m<strong>on</strong>thly<br />
frequency<br />
Percentage change over four quarters and<br />
c<strong>on</strong>verted to m<strong>on</strong>thly frequencty<br />
Percentage change over four quarters and<br />
c<strong>on</strong>verted to m<strong>on</strong>thly frequency<br />
Percentage change over twelve m<strong>on</strong>ths<br />
Percentage