Notes on a composite leading indicator of inflation
Notes on a composite leading indicator of inflation
Notes on a composite leading indicator of inflation

Create successful ePaper yourself
Turn your PDF publications into a flip-book with our unique Google optimized e-Paper software.
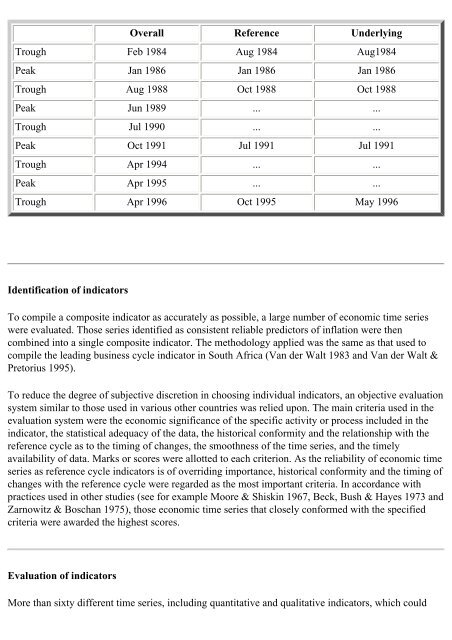
Overall Reference Underlying<br />
Trough Feb 1984 Aug 1984 Aug1984<br />
Peak Jan 1986 Jan 1986 Jan 1986<br />
Trough Aug 1988 Oct 1988 Oct 1988<br />
Peak Jun 1989 ... ...<br />
Trough Jul 1990 ... ...<br />
Peak Oct 1991 Jul 1991 Jul 1991<br />
Trough Apr 1994 ... ...<br />
Peak Apr 1995 ... ...<br />
Trough Apr 1996 Oct 1995 May 1996<br />
Identificati<strong>on</strong> <strong>of</strong> <strong>indicator</strong>s<br />
To compile a <strong>composite</strong> <strong>indicator</strong> as accurately as possible, a large number <strong>of</strong> ec<strong>on</strong>omic time series<br />
were evaluated. Those series identified as c<strong>on</strong>sistent reliable predictors <strong>of</strong> inflati<strong>on</strong> were then<br />
combined into a single <strong>composite</strong> <strong>indicator</strong>. The methodology applied was the same as that used to<br />
compile the <strong>leading</strong> business cycle <strong>indicator</strong> in South Africa (Van der Walt 1983 and Van der Walt &<br />
Pretorius 1995).<br />
To reduce the degree <strong>of</strong> subjective discreti<strong>on</strong> in choosing individual <strong>indicator</strong>s, an objective evaluati<strong>on</strong><br />
system similar to those used in various other countries was relied up<strong>on</strong>. The main criteria used in the<br />
evaluati<strong>on</strong> system were the ec<strong>on</strong>omic significance <strong>of</strong> the specific activity or process included in the<br />
<strong>indicator</strong>, the statistical adequacy <strong>of</strong> the data, the historical c<strong>on</strong>formity and the relati<strong>on</strong>ship with the<br />
reference cycle as to the timing <strong>of</strong> changes, the smoothness <strong>of</strong> the time series, and the timely<br />
availability <strong>of</strong> data. Marks or scores were allotted to each criteri<strong>on</strong>. As the reliability <strong>of</strong> ec<strong>on</strong>omic time<br />
series as reference cycle <strong>indicator</strong>s is <strong>of</strong> overriding importance, historical c<strong>on</strong>formity and the timing <strong>of</strong><br />
changes with the reference cycle were regarded as the most important criteria. In accordance with<br />
practices used in other studies (see for example Moore & Shiskin 1967, Beck, Bush & Hayes 1973 and<br />
Zarnowitz & Boschan 1975), those ec<strong>on</strong>omic time series that closely c<strong>on</strong>formed with the specified<br />
criteria were awarded the highest scores.<br />
Evaluati<strong>on</strong> <strong>of</strong> <strong>indicator</strong>s<br />
More than sixty different time series, including quantitative and qualitative <strong>indicator</strong>s, which could