Time Series Exam, 2010: Solutions - STAT
Time Series Exam, 2010: Solutions - STAT
Time Series Exam, 2010: Solutions - STAT

Create successful ePaper yourself
Turn your PDF publications into a flip-book with our unique Google optimized e-Paper software.
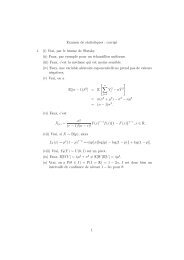
(c) We have<br />
ρ(t−1,t) =<br />
=<br />
γ(t−1,t)<br />
√<br />
γ(t−1,t−1)γ(t,t)<br />
(t−1)σ 2<br />
√<br />
(t−1)σ2 tσ 2<br />
=<br />
…<br />
t−1<br />
−→ 1, as t → ∞.<br />
t<br />
This means two observations far apart are strongly correlated.<br />
(d) We showed in (b) that µ t depends on t and γ(s,t), on min(s,t).<br />
(e) Let us consider the differenced series Ỹt = Y t −Y t−1 = ε t +δ. We have then µ t = δ, which<br />
does not depend on t and cov(Y s ,Y t ) = cov(ε s +δ,ε t +δ) = σ 2 δ(s−t), where δ(s−t) = 1 if<br />
s = t and 0 otherwise.<br />
2. (a) See Lemma 18.<br />
(b) Conditional on A = {Y t−r ,...,Y t−1 }, we find that E(Y t | A) = φy t−1 and E(Y t−r−1 | A) =<br />
φ −1 y t−r , the latter because we can write Y t−r−1 = φ −1 (Y t−r −ε t−r ). Moreover,<br />
E(Y t Y t−r−1 | A) = E{(φY t−1 +ε t )φ −1 (Y t−r −ε t−r ) | A} = y t−1 y t−r , r ≥ 1,<br />
so the conditional covariance cov(Y t ,Y t−r−1 | A) = E(Y t Y t−r−1 | A)−E(Y t | A)E(Y t−r−1 | A) = 0.<br />
If we see a series in which the partial autocorrelation function has zeros after a certain point, then<br />
we use this property to diagnose an AR model, whereas the same property for the ACF suggests<br />
an MA model. See slide 154 and previous material.<br />
(c) The plots show the correlogram (empirical ACF) and partial correlogram empirical PACF)<br />
for the data. The estimates on the left are moment-based, and those on the right are obtained<br />
from them using the Yule–Walker equations. The horizontal dashed lines show significance limits<br />
for the correlogram and partial correlogram elements, based on assumptions of white noise with<br />
finite fourth moments; the limits are at ±2/ √ n.<br />
The correlogramshows geometric decline with alternating sign, and suggests that this is an AR(1)<br />
model with φ ≈ −0.9. This is confirmed by the PACF, which has just one significant value, at<br />
h = 1, with value around −0.9.<br />
3. If {γ h } h∈Z is the ACF of a stationary random sequence, then there exists a unique function F<br />
defined on [−1/2,1/2] such that F(−1/2) = 0, F is right-continuous and non-decreasing, with<br />
symmetric increments about zero, and<br />
∫<br />
γ h = e 2πihu dF(u), h ∈ Z.<br />
(−1/2,1/2]<br />
The function F is called the spectral distribution function of γ h , and its derivative f, if it exists,<br />
is called the spectral density function. If ∑ h|γ h | < ∞, then f exists. A function f(ω) defined on<br />
[−1/2,1/2] is the spectrum of a stationary process if and only if f(ω) = f(−ω), f(ω) ≥ 0, and<br />
∫<br />
f(ω)dω < ∞.<br />
We have<br />
γ(h) = E[(Y t+h −E[Y t+h ])(Y t −E[Y t ])]<br />
[ ]<br />
∑<br />
= E ψ j ε t+h−j ·∑<br />
ψ l ε t−l<br />
j<br />
= ∑ j<br />
ψ j ψ j−h σ 2 ,<br />
l<br />
2