Time Series Exam, 2010: Solutions - STAT
Time Series Exam, 2010: Solutions - STAT
Time Series Exam, 2010: Solutions - STAT

You also want an ePaper? Increase the reach of your titles
YUMPU automatically turns print PDFs into web optimized ePapers that Google loves.
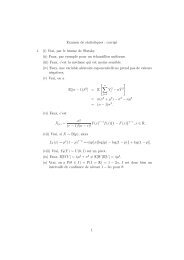
(b) Since the roots of 1 −x+0−5x 2 are (1±i)/2, this is an ARMA(2,1) process. Moreover,<br />
it is neither causal nor invertible since the two roots of φ(z) lie inside the unit disk and the<br />
root of θ(z) is 1.<br />
(c) Here, we have<br />
γ(h) = 5σ 2 δ(h)−2σ 2 (δ(h+1)+δ(h−1))<br />
and so we have the same ACF as we had in (a). The two processes are the same (provided<br />
the variance of the white noise is such that the two autocovariance functions are identical),<br />
but the model in (a) is invertible, whereas the model in (c) is not.<br />
5. See the notes.<br />
6. All linear state space models involve two equations, the state equation, which determines the<br />
evolution of an underlying unobserved state, and the observation equation, which determines how<br />
the observed data are related to the state. The local trend model (a simple special case) has<br />
State equation:<br />
Observation equation:<br />
µ t+1 = µ t +η t , η t<br />
iid<br />
∼ N(0,σ<br />
2<br />
η ),<br />
y t = µ t +ε t , ε t<br />
iid<br />
∼ N(0,σ 2 ),<br />
where the η t and ε t are mutually independent. We suppose that data y 1 ,...,y n are available.<br />
Let H t denote the information available at time t. Filtering is the estimation of µ t using H t ,<br />
smoothing is the estimation of µ t using H n and prediction is the forecasting µ t+h fot h > 0 using<br />
H t .<br />
(a) We have<br />
State equation:<br />
Observation equation:<br />
X t = −0.9X t−2 +ε t , ε t<br />
iid<br />
∼ N(0,σ<br />
2<br />
ε ),<br />
Y t = X t +η t , η t<br />
iid<br />
∼ N(0,σ<br />
2<br />
η ).<br />
(b) Since η t is an independent white noise, Y t is stationary if and only if X t is stationary.<br />
Moreover, X t is an AR(2) model, so provided the variances σ0 2 and σ2 1 are such that var(X t)<br />
does not depend on t, Y t is stationary. Since<br />
®<br />
(−0.9) t/2 X<br />
X t = 0 + ∑ t/2<br />
k=1 ε 2k(−0.9) t/2−k , t even,<br />
(−0.9) (t+1)/2 X −1 + ∑ (t−1)/2<br />
k=0<br />
ε 2k+1 (−0.9) (t−1)/2−k , t odd,<br />
the variance of X t is given by<br />
{<br />
var(X t ) =<br />
σ0 2(−0.9)t +σε<br />
2 1−(0.81) t/2<br />
1−0.81<br />
, t even,<br />
σ1 2(−0.9)t+1 +σε<br />
2 1−(0.81) (t+1)/2<br />
1−0.81<br />
, t odd,<br />
and so X t and Y t are stationary if and only if<br />
σ 2 0 = σ2 1 =<br />
σ 2 ε<br />
1−0.81 .<br />
(c) The left time plot (X t ) shows clearly the AR(2) structure, whereas on the right time plot, it<br />
is more difficult to see, because of the noise η t . The range is also more important (from -10<br />
to 5 instead of -8 to 2). The left ACF is typical from an AR(2) model with such parameters.<br />
On the right one, the added noise reduces the proportion of information in the observation<br />
and the correlation, so the values are diminished on the plot. Finally, on the left PACF, we<br />
clearly find the model structure, whereas on the right one, we also have the consequences of<br />
the added noise.<br />
4