Acoustics Bulletin Jul-Aug 2011 - Institute of Acoustics
Acoustics Bulletin Jul-Aug 2011 - Institute of Acoustics
Acoustics Bulletin Jul-Aug 2011 - Institute of Acoustics

You also want an ePaper? Increase the reach of your titles
YUMPU automatically turns print PDFs into web optimized ePapers that Google loves.
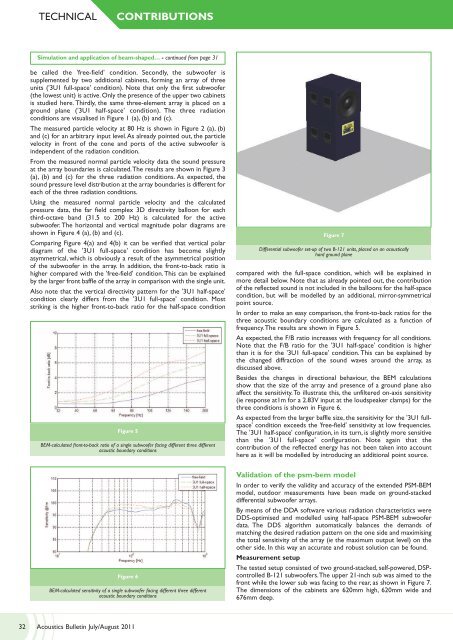
TECHNICAL<br />
CONTRIBUTIONS<br />
Simulation and application <strong>of</strong> beam-shaped… - continued from page 31<br />
be called the 'free-field' condition. Secondly, the subwo<strong>of</strong>er is<br />
supplemented by two additional cabinets, forming an array <strong>of</strong> three<br />
units ('3U1 full-space' condition). Note that only the first subwo<strong>of</strong>er<br />
(the lowest unit) is active. Only the presence <strong>of</strong> the upper two cabinets<br />
is studied here. Thirdly, the same three-element array is placed on a<br />
ground plane ('3U1 half-space' condition). The three radiation<br />
conditions are visualised in Figure 1 (a), (b) and (c).<br />
The measured particle velocity at 80 Hz is shown in Figure 2 (a), (b)<br />
and (c) for an arbitrary input level. As already pointed out, the particle<br />
velocity in front <strong>of</strong> the cone and ports <strong>of</strong> the active subwo<strong>of</strong>er is<br />
independent <strong>of</strong> the radiation condition.<br />
From the measured normal particle velocity data the sound pressure<br />
at the array boundaries is calculated. The results are shown in Figure 3<br />
(a), (b) and (c) for the three radiation conditions. As expected, the<br />
sound pressure level distribution at the array boundaries is different for<br />
each <strong>of</strong> the three radiation conditions.<br />
Using the measured normal particle velocity and the calculated<br />
pressure data, the far field complex 3D directivity balloon for each<br />
third-octave band (31.5 to 200 Hz) is calculated for the active<br />
subwo<strong>of</strong>er. The horizontal and vertical magnitude polar diagrams are<br />
shown in Figure 4 (a), (b) and (c).<br />
Comparing Figure 4(a) and 4(b) it can be verified that vertical polar<br />
diagram <strong>of</strong> the '3U1 full-space' condition has become slightly<br />
asymmetrical, which is obviously a result <strong>of</strong> the asymmetrical position<br />
<strong>of</strong> the subwo<strong>of</strong>er in the array. In addition, the front-to-back ratio is<br />
higher compared with the 'free-field' condition. This can be explained<br />
by the larger front baffle <strong>of</strong> the array in comparison with the single unit.<br />
Also note that the vertical directivity pattern for the '3U1 half-space'<br />
condition clearly differs from the '3U1 full-space' condition. Most<br />
striking is the higher front-to-back ratio for the half-space condition<br />
Figure 5<br />
BEM-calculated front-to-back ratio <strong>of</strong> a single subwo<strong>of</strong>er facing different three different<br />
acoustic boundary conditions<br />
Figure 7<br />
Differential subwo<strong>of</strong>er set-up <strong>of</strong> two B-121 units, placed on an acoustically<br />
hard ground plane<br />
compared with the full-space condition, which will be explained in<br />
more detail below. Note that as already pointed out, the contribution<br />
<strong>of</strong> the reflected sound is not included in the balloons for the half-space<br />
condition, but will be modelled by an additional, mirror-symmetrical<br />
point source.<br />
In order to make an easy comparison, the front-to-back ratios for the<br />
three acoustic boundary conditions are calculated as a function <strong>of</strong><br />
frequency. The results are shown in Figure 5.<br />
As expected, the F/B ratio increases with frequency for all conditions.<br />
Note that the F/B ratio for the '3U1 half-space' condition is higher<br />
than it is for the '3U1 full-space' condition. This can be explained by<br />
the changed diffraction <strong>of</strong> the sound waves around the array, as<br />
discussed above.<br />
Besides the changes in directional behaviour, the BEM calculations<br />
show that the size <strong>of</strong> the array and presence <strong>of</strong> a ground plane also<br />
affect the sensitivity. To illustrate this, the unfiltered on-axis sensitivity<br />
(ie response at1m for a 2.83V input at the loudspeaker clamps) for the<br />
three conditions is shown in Figure 6.<br />
As expected from the larger baffle size, the sensitivity for the '3U1 fullspace'<br />
condition exceeds the 'free-field' sensitivity at low frequencies.<br />
The '3U1 half-space' configuration, in its turn, is slightly more sensitive<br />
than the '3U1 full-space' configuration. Note again that the<br />
contribution <strong>of</strong> the reflected energy has not been taken into account<br />
here as it will be modelled by introducing an additional point source.<br />
Figure 6<br />
BEM-calculated sensitivity <strong>of</strong> a single subwo<strong>of</strong>er facing different three different<br />
acoustic boundary conditions<br />
Validation <strong>of</strong> the psm-bem model<br />
In order to verify the validity and accuracy <strong>of</strong> the extended PSM-BEM<br />
model, outdoor measurements have been made on ground-stacked<br />
differential subwo<strong>of</strong>er arrays.<br />
By means <strong>of</strong> the DDA s<strong>of</strong>tware various radiation characteristics were<br />
DDS-optimised and modelled using half-space PSM-BEM subwo<strong>of</strong>er<br />
data. The DDS algorithm automatically balances the demands <strong>of</strong><br />
matching the desired radiation pattern on the one side and maximising<br />
the total sensitivity <strong>of</strong> the array (ie the maximum output level) on the<br />
other side. In this way an accurate and robust solution can be found.<br />
Measurement setup<br />
The tested setup consisted <strong>of</strong> two ground-stacked, self-powered, DSPcontrolled<br />
B-121 subwo<strong>of</strong>ers. The upper 21-inch sub was aimed to the<br />
front while the lower sub was facing to the rear, as shown in Figure 7.<br />
The dimensions <strong>of</strong> the cabinets are 620mm high, 620mm wide and<br />
676mm deep.<br />
32 <strong>Acoustics</strong> <strong>Bulletin</strong> <strong>Jul</strong>y/<strong>Aug</strong>ust <strong>2011</strong>