Acoustics Bulletin Jul-Aug 2011 - Institute of Acoustics
Acoustics Bulletin Jul-Aug 2011 - Institute of Acoustics
Acoustics Bulletin Jul-Aug 2011 - Institute of Acoustics

Create successful ePaper yourself
Turn your PDF publications into a flip-book with our unique Google optimized e-Paper software.
TECHNICAL<br />
CONTRIBUTIONS<br />
A TV demonstration <strong>of</strong> sound absorption… - continued from page 39<br />
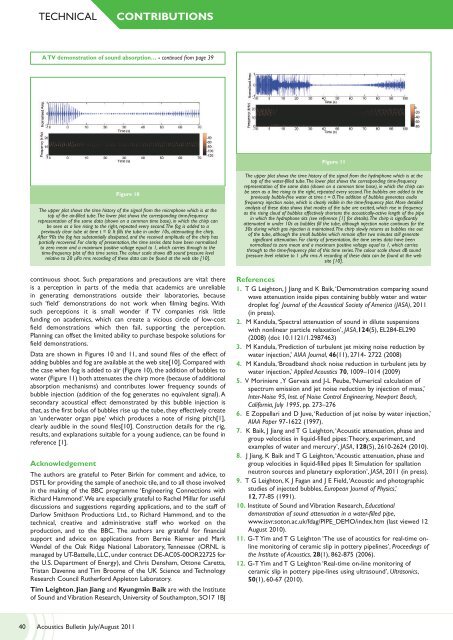
Figure 11<br />
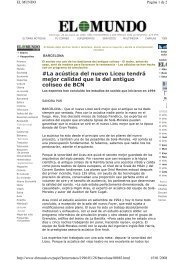
Figure 10<br />
The upper plot shows the time history <strong>of</strong> the signal from the microphone which is at the<br />
top <strong>of</strong> the air-filled tube. The lower plot shows the corresponding time-frequency<br />
representation <strong>of</strong> the same data (shown on a common time base), in which the chirp can<br />
be seen as a line rising to the right, repeated every second. The fog is added to a<br />
previously clear tube at time t = 0. It fills the tube in under 10s, attenuating the chirp.<br />
After 90s the fog has substantially dissipated, and the received amplitude <strong>of</strong> the chirp has<br />
partially recovered. For clarity <strong>of</strong> presentation, the time series data have been normalised<br />
to zero mean and a maximum positive voltage equal to 1, which carries through to the<br />
time-frequency plot <strong>of</strong> this time series. The colour scale shows dB sound pressure level<br />
relative to 20 mPa rms recording <strong>of</strong> these data can be found at the web site [10].<br />
The upper plot shows the time history <strong>of</strong> the signal from the hydrophone which is at the<br />
top <strong>of</strong> the water-filled tube. The lower plot shows the corresponding time-frequency<br />
representation <strong>of</strong> the same data (shown on a common time base), in which the chirp can<br />
be seen as a line rising to the right, repeated every second. The bubbles are added to the<br />
previously bubble-free water at time t = 0. The addition <strong>of</strong> bubbles generates audio<br />
frequency injection noise, which is clearly visible in the time-frequency plot. More detailed<br />
analysis <strong>of</strong> these data shows that modes <strong>of</strong> the tube are excited, which rise in frequency<br />
as the rising cloud <strong>of</strong> bubbles effectively shortens the acoustically-active length <strong>of</strong> the pipe<br />
in which the hydrophone sits (see reference [1] for details). The chirp is significantly<br />
attenuated in under 10s as bubbles fill the tube, although injection noise continues for the<br />
30s during which gas injection is maintained. The chirp slowly returns as bubbles rise out<br />
<strong>of</strong> the tube, although the small bubbles which remain after two minutes still generate<br />
significant attenuation. For clarity <strong>of</strong> presentation, the time series data have been<br />
normalised to zero mean and a maximum positive voltage equal to 1, which carries<br />
through to the time-frequency plot <strong>of</strong> this time series. The colour scale shows dB sound<br />
pressure level relative to 1 mPa rms. A recording <strong>of</strong> these data can be found at the web<br />
site [10].<br />
continuous shoot. Such preparations and precautions are vital: there<br />
is a perception in parts <strong>of</strong> the media that academics are unreliable<br />
in generating demonstrations outside their laboratories, because<br />
such ‘field’ demonstrations do not work when filming begins. With<br />
such perceptions it is small wonder if TV companies risk little<br />
funding on academics, which can create a vicious circle <strong>of</strong> low-cost<br />
field demonstrations which then fail, supporting the perception.<br />
Planning can <strong>of</strong>fset the limited ability to purchase bespoke solutions for<br />
field demonstrations.<br />
Data are shown in Figures 10 and 11, and sound files <strong>of</strong> the effect <strong>of</strong><br />
adding bubbles and fog are available at the web site[10]. Compared with<br />
the case when fog is added to air (Figure 10), the addition <strong>of</strong> bubbles to<br />
water (Figure 11) both attenuates the chirp more (because <strong>of</strong> additional<br />
absorption mechanisms) and contributes lower frequency sounds <strong>of</strong><br />
bubble injection (addition <strong>of</strong> the fog generates no equivalent signal). A<br />
secondary acoustical effect demonstrated by this bubble injection is<br />
that, as the first bolus <strong>of</strong> bubbles rise up the tube, they effectively create<br />
an ‘underwater organ pipe’ which produces a note <strong>of</strong> rising pitch[1],<br />
clearly audible in the sound files[10]. Construction details for the rig,<br />
results, and explanations suitable for a young audience, can be found in<br />
reference [1].<br />
Acknowledgement<br />
The authors are grateful to Peter Birkin for comment and advice, to<br />
DSTL for providing the sample <strong>of</strong> anechoic tile, and to all those involved<br />
in the making <strong>of</strong> the BBC programme ‘Engineering Connections with<br />
Richard Hammond’. We are especially grateful to Rachel Millar for useful<br />
discussions and suggestions regarding applications, and to the staff <strong>of</strong><br />
Darlow Smithson Productions Ltd., to Richard Hammond, and to the<br />
technical, creative and administrative staff who worked on the<br />
production, and to the BBC. The authors are grateful for financial<br />
support and advice on applications from Bernie Riemer and Mark<br />
Wendel <strong>of</strong> the Oak Ridge National Laboratory, Tennessee (ORNL is<br />
managed by UT-Battelle, LLC, under contract DE-AC05-00OR22725 for<br />
the U.S. Department <strong>of</strong> Energy), and Chris Densham, Ottone Caretta,<br />
Tristan Davenne and Tim Broome <strong>of</strong> the UK Science and Technology<br />
Research Council Rutherford Appleton Laboratory.<br />
Tim Leighton, Jian Jiang and Kyungmin Baik are with the <strong>Institute</strong><br />
<strong>of</strong> Sound and Vibration Research, University <strong>of</strong> Southampton, SO17 1BJ<br />
References<br />
1. T G Leighton, J Jiang and K Baik, ‘Demonstration comparing sound<br />
wave attenuation inside pipes containing bubbly water and water<br />
droplet fog’ Journal <strong>of</strong> the Acoustical Society <strong>of</strong> America (JASA), <strong>2011</strong><br />
(in press).<br />
2. M Kandula, ‘Spectral attenuation <strong>of</strong> sound in dilute suspensions<br />
with nonlinear particle relaxation’, JASA,124(5), EL284-EL290<br />
(2008) (doi: 10.1121/1.2987463)<br />
3. M Kandula, ‘Prediction <strong>of</strong> turbulent jet mixing noise reduction by<br />
water injection,’ AIAA Journal, 46(11), 2714- 2722 (2008)<br />
4. M Kandula, ‘Broadband shock noise reduction in turbulent jets by<br />
water injection,’ Applied <strong>Acoustics</strong> 70, 1009–1014 (2009)<br />
5. V Moriniere , Y Gervais and J-L Peube, ‘Numerical calculation <strong>of</strong><br />
spectrum emission and jet noise reduction by injection <strong>of</strong> mass,’<br />
Inter-Noise 95, Inst. <strong>of</strong> Noise Control Engineering, Newport Beach,<br />
California, <strong>Jul</strong>y 1995, pp. 273–276<br />
6. E Zoppellari and D Juve, ‘Reduction <strong>of</strong> jet noise by water injection,’<br />
AIAA Paper 97-1622 (1997).<br />
7. K Baik, J Jiang and T G Leighton, ‘Acoustic attenuation, phase and<br />
group velocities in liquid-filled pipes: Theory, experiment, and<br />
examples <strong>of</strong> water and mercury’, JASA, 128(5), 2610-2624 (2010).<br />
8. J Jiang, K Baik and T G Leighton, ‘Acoustic attenuation, phase and<br />
group velocities in liquid-filled pipes II: Simulation for spallation<br />
neutron sources and planetary exploration’, JASA, <strong>2011</strong> (in press).<br />
9. T G Leighton, K J Fagan and J E Field, ‘Acoustic and photographic<br />
studies <strong>of</strong> injected bubbles, European Journal <strong>of</strong> Physics,’<br />
12, 77-85 (1991).<br />
10. <strong>Institute</strong> <strong>of</strong> Sound and Vibration Research, Educational<br />
demonstration <strong>of</strong> sound attenuation in a water-filled pipe,<br />
www.isvr.soton.ac.uk/fdag/PIPE_DEMO/index.htm (last viewed 12<br />
<strong>Aug</strong>ust 2010).<br />
11. G-T Yim and T G Leighton ‘The use <strong>of</strong> acoustics for real-time online<br />
monitoring <strong>of</strong> ceramic slip in pottery pipelines’, Proceedings <strong>of</strong><br />
the <strong>Institute</strong> <strong>of</strong> <strong>Acoustics</strong>, 28(1), 862-875 (2006).<br />
12. G-T Yim and T G Leighton ‘Real-time on-line monitoring <strong>of</strong><br />
ceramic slip in pottery pipe-lines using ultrasound’, Ultrasonics,<br />
50(1), 60-67 (2010).<br />
40 <strong>Acoustics</strong> <strong>Bulletin</strong> <strong>Jul</strong>y/<strong>Aug</strong>ust <strong>2011</strong>