Andrews Air Force Base - NOAA's Ocean Service Office of ...
Andrews Air Force Base - NOAA's Ocean Service Office of ...
Andrews Air Force Base - NOAA's Ocean Service Office of ...

You also want an ePaper? Increase the reach of your titles
YUMPU automatically turns print PDFs into web optimized ePapers that Google loves.
<strong>Andrews</strong> <strong>Air</strong> <strong>Force</strong> <strong>Base</strong> 25<br />
<strong>Andrews</strong> <strong>Air</strong> <strong>Force</strong> <strong>Base</strong><br />
Camp Springs, Maryland<br />
EPA Facility ID: MD0570024000<br />
Basin: Middle Potomac-Anacostia-Occoquan<br />
HUC: 02070010<br />
Executive Summary<br />
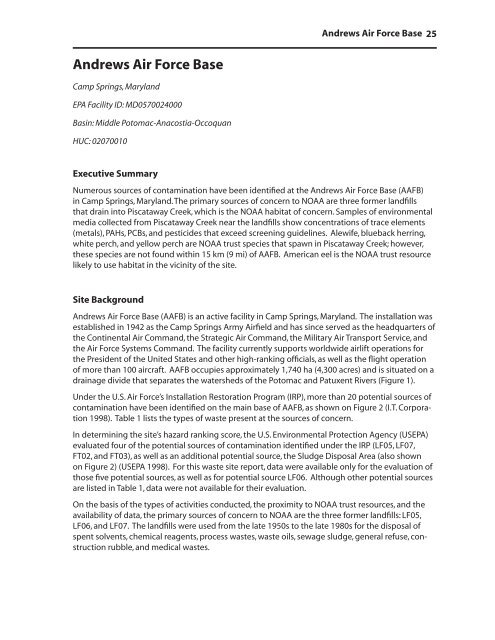
Numerous sources <strong>of</strong> contamination have been identified at the <strong>Andrews</strong> <strong>Air</strong> <strong>Force</strong> <strong>Base</strong> (AAFB)<br />
in Camp Springs, Maryland. The primary sources <strong>of</strong> concern to NOAA are three former landfills<br />
that drain into Piscataway Creek, which is the NOAA habitat <strong>of</strong> concern. Samples <strong>of</strong> environmental<br />
media collected from Piscataway Creek near the landfills show concentrations <strong>of</strong> trace elements<br />
(metals), PAHs, PCBs, and pesticides that exceed screening guidelines. Alewife, blueback herring,<br />
white perch, and yellow perch are NOAA trust species that spawn in Piscataway Creek; however,<br />
these species are not found within 15 km (9 mi) <strong>of</strong> AAFB. American eel is the NOAA trust resource<br />
likely to use habitat in the vicinity <strong>of</strong> the site.<br />
Site Background<br />
<strong>Andrews</strong> <strong>Air</strong> <strong>Force</strong> <strong>Base</strong> (AAFB) is an active facility in Camp Springs, Maryland. The installation was<br />
established in 1942 as the Camp Springs Army <strong>Air</strong>field and has since served as the headquarters <strong>of</strong><br />
the Continental <strong>Air</strong> Command, the Strategic <strong>Air</strong> Command, the Military <strong>Air</strong> Transport <strong>Service</strong>, and<br />
the <strong>Air</strong> <strong>Force</strong> Systems Command. The facility currently supports worldwide airlift operations for<br />
the President <strong>of</strong> the United States and other high-ranking <strong>of</strong>ficials, as well as the flight operation<br />
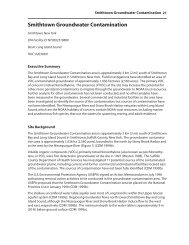
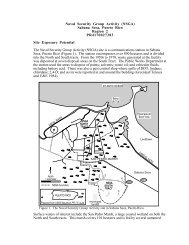
<strong>of</strong> more than 100 aircraft. AAFB occupies approximately 1,740 ha (4,300 acres) and is situated on a<br />
drainage divide that separates the watersheds <strong>of</strong> the Potomac and Patuxent Rivers (Figure 1).<br />
Under the U.S. <strong>Air</strong> <strong>Force</strong>’s Installation Restoration Program (IRP), more than 20 potential sources <strong>of</strong><br />
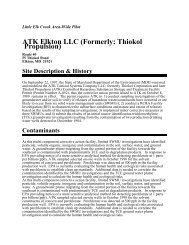
contamination have been identified on the main base <strong>of</strong> AAFB, as shown on Figure 2 (I.T. Corporation<br />
1998). Table 1 lists the types <strong>of</strong> waste present at the sources <strong>of</strong> concern.<br />
In determining the site’s hazard ranking score, the U.S. Environmental Protection Agency (USEPA)<br />
evaluated four <strong>of</strong> the potential sources <strong>of</strong> contamination identified under the IRP (LF05, LF07,<br />
FT02, and FT03), as well as an additional potential source, the Sludge Disposal Area (also shown<br />
on Figure 2) (USEPA 1998). For this waste site report, data were available only for the evaluation <strong>of</strong><br />
those five potential sources, as well as for potential source LF06. Although other potential sources<br />
are listed in Table 1, data were not available for their evaluation.<br />
On the basis <strong>of</strong> the types <strong>of</strong> activities conducted, the proximity to NOAA trust resources, and the<br />
availability <strong>of</strong> data, the primary sources <strong>of</strong> concern to NOAA are the three former landfills: LF05,<br />
LF06, and LF07. The landfills were used from the late 1950s to the late 1980s for the disposal <strong>of</strong><br />
spent solvents, chemical reagents, process wastes, waste oils, sewage sludge, general refuse, construction<br />
rubble, and medical wastes.
26 EPA Region 3<br />
P atuxent River<br />
kilometers<br />
miles<br />
N<br />
0 5<br />
0 3 6<br />
10<br />
50<br />
Branch<br />
Washington, DC<br />
Western<br />
Southwest<br />
Branch<br />
Turkey Branch<br />
4<br />
301<br />
Branch<br />
Cabin<br />
Branch<br />
k<br />
Ba c<br />
Tav ern<br />
Horse<br />
95<br />
<strong>Andrews</strong><br />
<strong>Air</strong> <strong>Force</strong><br />
<strong>Base</strong><br />
River<br />
n ch<br />
Bra<br />
Creek<br />
B ranch<br />
Charles<br />
Henson<br />
Creek<br />
382<br />
Potomac<br />
Southwest<br />
Branch<br />
Tink ers<br />
Creek<br />
Mataponi<br />
Creek<br />
Brandywine<br />
Housing Annex (ST15)<br />
Piscataway<br />
Timothy<br />
Branch<br />
5<br />
Brandywine<br />
DRMO (SS01)<br />
381<br />
Brandywine<br />
Receiver Site<br />
Figure 1. <strong>Andrews</strong> <strong>Air</strong> <strong>Force</strong> <strong>Base</strong>, Camp Springs, Maryland and associated base facilities.<br />
Ropers<br />
Branch<br />
Site boundaries<br />
Davidsonville<br />
Transmitter<br />
Site (SS11)<br />
Site locations<br />
4<br />
Chesapeake<br />
Bay<br />
NJ<br />
MD<br />
WV<br />
VA<br />
DE<br />
<strong>Andrews</strong><br />
<strong>Air</strong> <strong>Force</strong><br />
<strong>Base</strong><br />
Atlantic<br />
<strong>Ocean</strong><br />
Prepared from USGS 1978a; 1978b; 1979a; 1979b; 1979c; 1985; AAA 1989; DeLorme 1989.<br />
Mattawoman Creek
Dower House Rd.<br />
<strong>Andrews</strong> <strong>Air</strong> <strong>Force</strong> <strong>Base</strong> 27<br />
Henson Creek<br />
Branch<br />
Cabin<br />
Suitland Pkwy.<br />
Rd.<br />
North Perimeter<br />
Suitland Rd.<br />
kilometers<br />
miles<br />
95<br />
Menoher Drive<br />
ST19<br />
San Antonio Blvd.<br />
Figure 2. Detail <strong>of</strong> the <strong>Andrews</strong> <strong>Air</strong> <strong>Force</strong> <strong>Base</strong> site (only the main base sites are shown).<br />
FT02<br />
FT03<br />
AOC23<br />
LF06<br />
AOC27<br />
LF07<br />
FT04<br />
ST19<br />
ST14<br />
LF05<br />
SS12<br />
4<br />
Concord Ave.<br />
Virginia Ave.<br />
East Perimeter Rd.<br />
Brookley Ave.<br />
Arnold Ave.<br />
Arkansas<br />
Rd.<br />
5<br />
N<br />
0 0.5<br />
Patrick Ave.<br />
Capital Beltway<br />
0 0.25 0.5<br />
1<br />
Westover<br />
Drive<br />
Marlboro<br />
Auth Rd.<br />
ANDREWS<br />
AIR FORCE BASE<br />
Fechet Ave.<br />
Pike<br />
Branch<br />
Charles<br />
Pearl Harbor Dr.<br />
Dower House Rd.<br />
ST19<br />
AOC24<br />
ST17<br />
Rd.<br />
ST18<br />
SS21<br />
ST10<br />
IRP Site<br />
IRP Area <strong>of</strong><br />
Concern Site<br />
<strong>Andrews</strong> <strong>Air</strong> <strong>Force</strong><br />
<strong>Base</strong> Boundary<br />
Groundwater flow<br />
direction<br />
Perimeter<br />
Wisconsin<br />
West<br />
Rd.<br />
Branch<br />
Branch<br />
M eetinghouse<br />
Paynes<br />
Rd.<br />
Perimeter<br />
South<br />
Virginia Ave.<br />
Creek<br />
Tinkers<br />
Creek<br />
Piscataway<br />
<strong>Base</strong><br />
Lake<br />
Sludge<br />
Disposal<br />
Area<br />
ST22<br />
SS13<br />
ST08<br />
AOC25<br />
Woodyard Rd.<br />
Unnamed<br />
Tributary<br />
Ferry Rd.<br />
Alexander<br />
Prepared from U.S. <strong>Air</strong> <strong>Force</strong> 1993 and IT Corporation 1998
28 EPA Region 3<br />
Table 1. Description <strong>of</strong> potential sources <strong>of</strong> contamination at <strong>Andrews</strong> AFB (Radian Corporation<br />
1992; USEPA 1998).<br />
Site ID Site Name Description<br />
LF05<br />
D1 Landfill/Leroy’s<br />
Landfill<br />
Solvents, oils, dilute process wastes, fly ash, and sewage sludge were<br />
disposed; approximately 7,500 liters <strong>of</strong> shop wastes were dumped each<br />
week.<br />
LF06 D3 Landfill Construction debris, equipment, and unknown quantities <strong>of</strong> shop wastes<br />
were disposed.<br />
LF07 D4 Landfill Construction debris, hospital waste, chemical reagents, and general refuse<br />
were disposed.<br />
FT02 Fire Training Area No. 1 Fuels and waste oils were burned during training exercises.<br />
FT03 Fire Training Area No. 2 Waste oil, jet fuel, paint thinner and other liquid waste were poured on the<br />
ground and ignited.<br />
FT04 Fire Training Area No. 4 Jet fuel and motor oil were burned weekly; spent oil and remains flowed into<br />
an oil interceptor and then into a gravel-bottomed pond.<br />
SS13 POL Yard Petroleum, oils, and lubricants (POL) leaked from underground storage tanks<br />
(USTs) and aboveground storage tanks (ASTs).<br />
SS12 JP-4 Spill Approximately 3,800 liters <strong>of</strong> JP-4 (jet fuel) spilled from a puncture in a<br />
pressurized delivery line.<br />
SS21 NA NA<br />
ST08 MOGAS UST Leak Gasoline and solvents leaked from USTs at a military gas station.<br />
ST10 PD 680 Spill An estimated 19,000 liters <strong>of</strong> PD 680 solvent leaked from UST.<br />
ST14 East Side <strong>Service</strong> Station Petroleum products leaked from USTs. Trichloroethylene (TCE) from<br />
unknown sources was found in groundwater.<br />
ST17 AAFES Gas Station Petroleum products leaked from USTs.TCE from unknown sources was found<br />
in groundwater.<br />
ST18 2132 Richmond Drive Fuel oil leaked from a UST.<br />
ST19<br />
<strong>Base</strong>-Wide Heating Oil<br />
USTs<br />
ST22 NA NA<br />
AOC23 NA NA<br />
AOC24 NA NA<br />
AOC25 NA NA<br />
AOC27 NA NA<br />
Fuel oil leaked from USTs.<br />
NA Sludge Disposal Area Sludge from the Blue Plains Waste Treatment Plant and AAFB waste<br />
treatment plant was spread between the runways<br />
NA: Information was not available in the documents reviewed.<br />
The primary pathways for the migration <strong>of</strong> contaminants to NOAA trust resources are surface<br />
water run<strong>of</strong>f and groundwater transport. Potential sources LF06 and LF07 are adjacent to Piscataway<br />
Creek, which originates several hundred meters upstream <strong>of</strong> the landfills (Figure 2). Potential<br />
source LF05 is located approximately 500 m (0.3 mi) from an unnamed tributary that enters Piscataway<br />
Creek just downstream <strong>of</strong> the landfill (Figure 2).
<strong>Andrews</strong> <strong>Air</strong> <strong>Force</strong> <strong>Base</strong> 29<br />
Shallow groundwater beneath AAFB occurs within the Brandywine Formation and the underlying<br />
Calvert Formation, which forms a significant regional aquitard separating the shallow aquifer from<br />
deeper aquifers. Together these formations range from 20 to 45 m (65 to 150 ft) in thickness. The<br />
depth at which groundwater is encountered at the site ranges from approximately 1 to 9 m (3 to<br />
28 ft) below ground surface. Groundwater in the surficial aquifer flows horizontally at a velocity<br />
<strong>of</strong> approximately 1 to 14 m/yr (3 to 46 ft/yr) (Dames and Moore 1992a). In general, the direction <strong>of</strong><br />
groundwater flow at AAFB is toward Piscataway Creek.<br />
NOAA Trust Resources<br />
The NOAA trust habitat <strong>of</strong> concern is Piscataway Creek. Piscataway Creek originates on AAFB and<br />
flows for about 25 km (16 mi) before entering the Potomac River. The lower 10 km <strong>of</strong> the creek is<br />
considered low salinity estuarine habitat, with salinities generally ranging from 0.5 to 5 parts per<br />
thousand (USFWS 1980). NOAA trust resources found in Piscataway Creek include alewife, American<br />
eel, blueback herring, white perch, and yellow perch (Table 2) (Kazyak 2001; King 2001). American<br />
eel is the species likely to use habitat in the vicinity <strong>of</strong> AAFB; the other species have only been<br />
observed 15 km (9 mi) downstream from AAFB.<br />
Table 2. NOAA trust resources inhabiting Piscataway Creek (Kazyak 2001; King 2001).<br />
Common Name<br />
Species Habitat Use Fisheries<br />
Scientific Name<br />
Spawning<br />
Area<br />
Nursery<br />
Area<br />
Adult<br />
Forage<br />
Comm.<br />
Fishery<br />
Rec.<br />
Fishery<br />
ANADROMOUS/CATADOMOUS FISH<br />
Alewife Alosa pseudoharengus <br />
American eel Anguilla rostrata <br />
Blueback herring Alosa aestivalis <br />
White perch Morone americana <br />
Yellow perch Perca flavescens <br />
Blueback herring and alewife are small anadromous fish that spend their adult lives at sea and<br />
return to fresh water to spawn. They have been documented spawning in Piscataway Creek several<br />
kilometers upstream <strong>of</strong> its confluence with Tinkers Creek (Kazyak 2001). White perch are semianadromous<br />
fish that migrate to tidal fresh water and slightly brackish water each spring to spawn.<br />
The confluence with Tinkers Creek is the upstream limit <strong>of</strong> documented spawning for white perch<br />
in Piscataway Creek (Kazyak 2001). Yellow perch are generally freshwater fish, although they have<br />
adapted to estuarine waters in Maryland. Yellow perch have been observed spawning at the<br />
mouth <strong>of</strong> Piscataway Creek (Kazyak 2001). American eel are catadromous fish that spawn at sea<br />
and use freshwater habitats as adults.<br />
There are no commercial fisheries in Piscataway Creek. There is recreational fishing <strong>of</strong> blueback<br />
herring and white perch in Piscataway Creek (Borras 2001). The most popular fishing areas are<br />
near Piscataway Creek’s confluence with Tinkers Creek or downstream (Borras 2001). There are no<br />
fish consumption advisories currently in effect for Piscataway Creek.
30 EPA Region 3<br />
Site-Related Contamination<br />
A variety <strong>of</strong> investigations have been conducted at the three landfills <strong>of</strong> concern. For a groundwater<br />
contamination survey conducted in 1991, nine to 11 groundwater samples were collected from<br />
monitoring wells at each <strong>of</strong> the three landfills (Dames and Moore 1992a). For remedial investigations<br />
in 1992 and 1993, four to six soil samples and two to three surface water and sediment<br />
samples were collected at each <strong>of</strong> the three landfills (Dames and Moore 1992b; Dames and Moore<br />
1992c; Dames and Moore 1993). For an additional remedial investigation in 1995 at LF05, six surface<br />
soil samples, 43 subsurface soil samples, and four sediment samples were collected, as well as<br />
five groundwater samples from monitoring wells (EA Engineering 1996). In 1993, four paired sets<br />
<strong>of</strong> surface water and sediment samples were collected from Piscataway Creek to assess potential<br />
impacts on the creek from the landfills (USAF 1993).<br />
Table 3 summarizes maximum concentrations <strong>of</strong> contaminants detected in soil and groundwater<br />
from the landfills and in sediment and surface water from landfill locations or from Piscataway<br />
Creek in the vicinity <strong>of</strong> the landfills.<br />
The soil data indicate a source <strong>of</strong> trace element (metals) contamination when maximum detected<br />
concentrations are compared to soil screening guidelines. Arsenic, chromium, and copper<br />
exceeded the soil screening guidelines by less than an order <strong>of</strong> magnitude. Lead, mercury, nickel,<br />
and zinc exceeded by one order <strong>of</strong> magnitude. No soil screening guidelines are available for comparison<br />
to the maximum concentrations <strong>of</strong> cadmium and silver in soil. The presence <strong>of</strong> polynuclear<br />
aromatic hydrocarbons (PAHs), polychlorinated biphenyls (PCBs), and pesticides also indicate<br />
a source <strong>of</strong> contamination. There are no soil screening guidelines available for comparison to the<br />
maximum concentrations <strong>of</strong> those contaminants.<br />
Groundwater samples contained trace elements and several pesticides. Trace elements detected<br />
in groundwater at maximum concentrations that exceeded the applicable ambient water quality<br />
criteria (AWQC) by one order <strong>of</strong> magnitude were cadmium and silver. Lead, nickel, and zinc<br />
exceeded by less than an order <strong>of</strong> magnitude. Maximum concentrations <strong>of</strong> arsenic, chromium,<br />
copper, and mercury did not exceed their AWQCs. Four pesticides were detected in groundwater.<br />
Chlordane exceeded its AWQC by two orders <strong>of</strong> magnitude; endrin aldehyde by one order <strong>of</strong> magnitude;<br />
dieldrin by less than an order <strong>of</strong> magnitude; and the maximum concentration <strong>of</strong> DDD did<br />
not exceed the AWQC. PAHs and PCBs were not detected.<br />
In surface water from Piscataway Creek, concentrations <strong>of</strong> cadmium, copper, lead, and zinc<br />
exceeded their respective freshwater AWQCs by less than an order <strong>of</strong> magnitude. Maximum concentrations<br />
<strong>of</strong> arsenic, chromium, and nickel did not exceed their AWQCs. Mercury and silver were<br />
not detected. The only organic compound detected in surface water from Piscataway Creek was<br />
dieldrin, but its concentration did not exceed the AWQC.<br />
In sediment, arsenic, cadmium, lead, mercury, nickel, silver, and zinc were detected at maximum<br />
concentrations that exceeded their respective threshold effect levels (TELs) by less than an order<br />
<strong>of</strong> magnitude. Chromium and copper were also detected, but at concentrations less than their<br />
TELs. In addition, concentrations <strong>of</strong> PCBs, total PAHs, and three pesticides exceeded TELs by less<br />
than an order <strong>of</strong> magnitude. The highest concentration <strong>of</strong> PAHs in sediment was detected in a<br />
sample collected from Piscataway Creek between LF06 and LF07.
<strong>Andrews</strong> <strong>Air</strong> <strong>Force</strong> <strong>Base</strong> 31<br />
Table 3. Maximum concentrations <strong>of</strong> contaminants <strong>of</strong> concern detected in media collected from<br />
potential sources <strong>of</strong> contamination (LF05, LF06, and LF07) and Piscataway Creek during site investigations<br />
(Dames and Moore 1992a; 1992b; 1992c; 1993; USAF 1993; EA Engineering 1996).<br />
Contaminant<br />
Soil (mg/kg) Water (µg/L) Sediment (mg/kg)<br />
Soil Mean U.S. a water<br />
Ground-<br />
Surface<br />
water AWQC b Sediment TEL c<br />
TRACE ELEMENTS<br />
Arsenic 23 5.2 19 3.7 150 6.2 5.9<br />
Cadmium 12 NA 140 2.7 2.2 1.8 0.596<br />
Chromium 120 37 29 7.3 74 10 37.3<br />
Copper 160 17 7.8 11 9 29 35.7<br />
Lead 780 16 17 20 2.5 69 35<br />
Mercury 1.5 0.058 0.4 ND 0.77 0.19 0.174<br />
Nickel 190 13 61 27 52 21 18<br />
Silver 280 NA 3.1 ND 0.12 1.8 0.73 f<br />
Zinc 800 48 500 195 120 210 123.1<br />
SEMI-VOLATILE<br />
ORGANIC<br />
COMPOUNDS<br />
PCBs 3.7 NA ND ND 0.014 0.18 0.0341<br />
Total PAHs 130 NA ND ND NA 13.4 1.684 f<br />
PESTICIDES<br />
DDD 0.0088 NA 0.11 ND 0.6 d 0.0037 0.00354<br />
Dieldrin 0.066 NA 0.17 0.015 0.056 0.0052 0.00285<br />
Endrin Aldehyde ND NA 0.54 ND 0.036 e 0.0033 0.00267 e<br />
Chlordane 0.006 NA 0.78 ND 0.00215 ND 0.0045<br />
a: Shacklette and Boerngen (1984) except cadmium and silver, which represent average concentrations in the Earth’s<br />
crust from Lindsay (1979).<br />
b: Ambient water quality criteria for the protection <strong>of</strong> aquatic organisms (USEPA 1993; USEPA 1999). Freshwater<br />
chronic criteria presented. Criterion expressed as a function <strong>of</strong> total hardness with the exception <strong>of</strong> arsenic and<br />
silver; concentrations shown correspond to hardness <strong>of</strong> 100 mg/L.<br />
c: Threshold effects level (TEL) is the geometric mean <strong>of</strong> the 15th percentile <strong>of</strong> the effects data and the 50th percentile<br />
<strong>of</strong> the no-effects data. The TEL is intended to represent the concentration below which adverse biological<br />
effects rarely occurred (Smith et al. 1996).<br />
d: Freshwater acute lowest observable effect level.<br />
e: Endrin value used.<br />
f: Freshwater TEL not available, marine TEL used.<br />
ND: Not detected.<br />
NA: Value not available.
32 EPA Region 3<br />
References<br />
American Automobile Association (AAA). 1989. Road Atlas: United States, Canada, Mexico. AAA. Falls<br />
Church, VA.<br />
Borras, R. Natural resource technician, Maryland Department <strong>of</strong> Natural Resources, Cedarville Visitors<br />
Center. Cedarville, MD. Personal communication January 23, 2001.<br />
Dames and Moore. 1992a. Groundwater contamination survey, <strong>Andrews</strong> <strong>Air</strong> <strong>Force</strong> <strong>Base</strong>, Maryland.<br />
Oak Ridge, TN: Prepared for the Hazardous Waste Remedial Action Program. 223 pp.<br />
Dames and Moore. 1992b. Technical memorandum for the LF06 site, <strong>Andrews</strong> <strong>Air</strong> <strong>Force</strong> <strong>Base</strong>, Maryland.<br />
Oak Ridge, TN: Prepared for the Hazardous Waste Remedial Action Program. 82 pp.<br />
Dames and Moore. 1992c. Technical memorandum for the LF07 site, <strong>Andrews</strong> <strong>Air</strong> <strong>Force</strong> <strong>Base</strong>, Maryland.<br />
Oak Ridge, TN: Prepared for the Hazardous Waste Remedial Action Program. 72 pp.<br />
Dames and Moore. 1993. Draft remedial investigation, LF05, <strong>Andrews</strong> <strong>Air</strong> <strong>Force</strong> <strong>Base</strong>, Maryland. Oak<br />
Ridge, TN: Prepared for the Hazardous Waste Remedial Action Program. 82 pp.<br />
DeLorme Mapping Company (DeLorme). 1989. Virginia atlas and gazetteer. 1:150,000. DeLorme.<br />
Freeport, ME.<br />
E.A. Engineering Science and Technology (EA Engineering). 1996. Draft remedial investigation<br />
report, Leroy’s Lane Landfill, <strong>Andrews</strong> <strong>Air</strong> <strong>Force</strong> <strong>Base</strong>, Maryland. Sparks, MD: Prepared for the U.S.<br />
Army Corps <strong>of</strong> Engineers.<br />
I.T. Corporation. 1998. Installation-wide plans, <strong>Andrews</strong> <strong>Air</strong> <strong>Force</strong> <strong>Base</strong>, Maryland. Knoxville, TN: Prepared<br />
for the <strong>Air</strong> <strong>Force</strong> Center for Environmental Excellence, Brooks <strong>Air</strong> <strong>Force</strong> <strong>Base</strong>, TX.<br />
Kazyak, P. Maryland Stream Biological Survey head. Annapolis, Maryland. Personal communication<br />
January 2, 2001.<br />
King, H. Fisheries manager for the Fisheries, Policy, and Management Department <strong>of</strong> the Maryland<br />
Department <strong>of</strong> Natural Resources. Annapolis, Maryland. Personal communication January 2,<br />
2001.<br />
Lindsay, W.L. 1979. Chemical Equilibria in Soils. New York, NY: John Wiley & Sons. 449 pp.<br />
Radian Corporation. 1992. Management action plan, <strong>Andrews</strong> <strong>Air</strong> <strong>Force</strong> <strong>Base</strong>. Camp Springs, MD:<br />
Prepared for the United States <strong>Air</strong> <strong>Force</strong>, Scott <strong>Air</strong> <strong>Force</strong> <strong>Base</strong>, IL.<br />
Shacklette, H.T. and J.G. Boerngen. 1984. Element concentrations in soils and other surficial materials<br />
<strong>of</strong> the conterminous United States. USGS Pr<strong>of</strong>essional Paper 1720. Washington, DC: U.S.<br />
Geological Survey.<br />
Smith, S.L, D.D. MacDonald, K.A. Keenleyside, C.G. Ingersoll, and L.J. Field. 1996. A preliminary evaluation<br />
<strong>of</strong> sediment quality assessment values for freshwater ecosystems. J. Great Lakes Res 22(3):<br />
624-638.<br />
U.S. <strong>Air</strong> <strong>Force</strong> (USAF). 1993. Assessment <strong>of</strong> impacts <strong>of</strong> landfills LF06 and LF07 on Piscataway Creek<br />
and surrounding area. <strong>Andrews</strong> <strong>Air</strong> <strong>Force</strong> <strong>Base</strong>, MD: Prepared by the U.S. <strong>Air</strong> <strong>Force</strong> Installation<br />
Restoration Program.<br />
U.S. Environmental Protection Agency (USEPA). 1993. Water quality criteria. Washington, DC: <strong>Office</strong><br />
<strong>of</strong> Water, Health and Ecological Criteria Division. 294 pp.
<strong>Andrews</strong> <strong>Air</strong> <strong>Force</strong> <strong>Base</strong> 33<br />
References, cont.<br />
U.S. Environmental Protection Agency (USEPA). 1998. Hazard ranking score documentation record,<br />
<strong>Andrews</strong> <strong>Air</strong> <strong>Force</strong> <strong>Base</strong>. Philadelphia, PA: USEPA Region 3. 110 pp.<br />
U.S. Environmental Protection Agency (USEPA). 1999. National recommended water quality criteria—correction:<br />
U.S. Environmental Protection Agency, <strong>Office</strong> <strong>of</strong> Water.<br />
U.S. Fish and Wildlife <strong>Service</strong> (USFWS). 1980. Atlantic Coast ecological inventory map, Washing D.C.-<br />
MD-VA. 1:250,000. U.S. Geological Survey. Washington D.C.<br />
U.S. Geological Survey (USGS). 1978a. Topographic map, Bowie quadrangle, MD, 7.5 minutes series.<br />
1:24,000. USGS. Denver, CO.<br />
U.S. Geological Survey (USGS). 1978b. Topographic map, Upper Marlboro quadrangle, MD, 7.5<br />
minute series. 1:24,000. USGS. Denver, CO.<br />
U.S. Geological Survey (USGS). 1979a. Topographic map, Anacostia quadrangle, D.C.-MD, 7.5 minutes<br />
series. 1:24,000. USGS. Denver, CO.<br />
U.S. Geological Survey (USGS). 1979b. Topographic map, Brandywine quadrangle, MD, 7.5 minutes<br />
series. 1:24,000. USGS. Denver, CO.<br />
U.S. Geological Survey (USGS). 1979c. Topographic map, Lanham quadrangle, MD, 7.5 minute series.<br />
1:24,000. USGS. Denver, CO.<br />
U.S. Geological Survey (USGS). 1985. Topographic map, Piscataway quadrangle, MD, 7.5 minutes<br />
series. 1:24,000. USGS. Denver, CO.
34 EPA Region 3