- Page 1 and 2: Annual Report of ACS Group
- Page 3: Activity Report of ACS Group
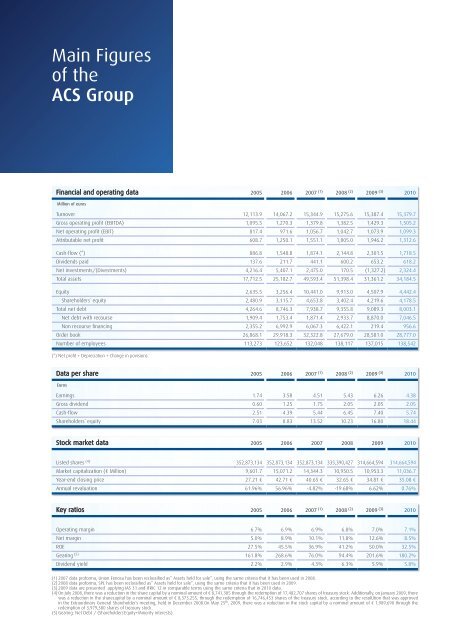
- Page 7 and 8: Earnings per share Dividends per sh
- Page 9 and 10: “Our business model is founded on
- Page 11 and 12: Dear Shareholder For another year I
- Page 13 and 14: Member of the Executive Committee M
- Page 15 and 16: CHAIRMAN Vice Chairman General Secr
- Page 17 and 18: ACS Services, Communications and En
- Page 19 and 20: Values Profitability Commitment Int
- Page 21 and 22: 2007 2003 2003 2006 In 2007, the AC
- Page 23 and 24: The infrastructure development is a
- Page 25 and 26: Evolution of investment by geograph
- Page 27 and 28: Primary energy consumption. USA and
- Page 29 and 30: Public-private partnership projects
- Page 31 and 32: United States and Canada North Amer
- Page 33 and 34: Characteristics, opportunities and
- Page 35 and 36: To tackle this great increase in en
- Page 37 and 38: 31 ACTIVITY REPORT CONSTRUCTION The
- Page 39 and 40: As a consequence of this clear comm
- Page 41 and 42: By type and technical characteristi
- Page 43 and 44: • Construction works for the wast
- Page 45 and 46: At 31 December 2010 the Group’s C
- Page 47 and 48: 2010 International Revenue per coun
- Page 49 and 50: It is also present in the bidding p
- Page 51 and 52: Organisational Structure 100% medio
- Page 53 and 54: Iridium Concesiones de Infraestruct
- Page 55 and 56:
Shown below is detail of the projec
- Page 57 and 58:
• On 28 October 2010, the concess
- Page 59 and 60:
new construction, hence it fi nds i
- Page 61 and 62:
The stations on Stretch II will go
- Page 63 and 64:
57 ACTIVITY REPORT ENVIRONMENT Urba
- Page 65 and 66:
To tackle these objectives and chal
- Page 67 and 68:
Revenue evolution International Rev
- Page 69 and 70:
Order Book evolution International
- Page 71 and 72:
2010 International Revenue per coun
- Page 73 and 74:
waste, offering a global solution t
- Page 75 and 76:
Organisational Structure Environmen
- Page 77 and 78:
71 ACTIVITY REPORT INDUSTRIAL SERVI
- Page 79 and 80:
sources (wind, solar, hydroelectric
- Page 81 and 82:
The ACS Group’s Industrial Servic
- Page 83 and 84:
- Signalling supply and maintenance
- Page 85 and 86:
Seven projects are also in the fi n
- Page 87 and 88:
Wind farms under Construction Locat
- Page 89 and 90:
Gross operating income grew 19.6% i
- Page 91 and 92:
een carried out in recent years in
- Page 93 and 94:
2010 International revenue per coun
- Page 95 and 96:
awarded in 2010, along with the wor
- Page 97 and 98:
Organisational Structure 100% Ancil
- Page 99 and 100:
93 ACTIVITY REPORT STRATEGIC INVEST
- Page 101 and 102:
Revenue 4% 1% % 7% EBITDA % 9% 3% 3
- Page 103 and 104:
Installed capacity 2010 Production
- Page 105 and 106:
Revenue breakdown by geographical a
- Page 107 and 108:
Mainly ACS Group presence Mainly Ho
- Page 109 and 110:
For the ACS Group 2010 has been a p
- Page 111 and 112:
Consolidated income statement of th
- Page 113 and 114:
Cash Flow Statement Cash Flow State
- Page 115 and 116:
The ACS Group’s Five Commitments
- Page 117 and 118:
Clients The commitment to clients i
- Page 119 and 120:
Commitment to Technological Develop
- Page 121 and 122:
Climate Change The ACS Group’s st
- Page 123 and 124:
Commitment to the Social Setting Th
- Page 125 and 126:
Social Action in the ACS Group The
- Page 127 and 128:
Ownership Structure The ACS Group
- Page 129 and 130:
their vote remotely is also express
- Page 131 and 132:
ACS, Servicios, Comunicaciones y En
- Page 133 and 134:
Economic and Financial Report of AC
- Page 135 and 136:
03 ECONOMIC AND FINANCIAL REPORT
- Page 137 and 138:
As far as the cash generation capac
- Page 139 and 140:
1.02.01. Net sales Sales amounted t
- Page 141 and 142:
1.02.04. Net fi nancial profi t/los
- Page 143 and 144:
1.03.01. Non-current assets Intangi
- Page 145 and 146:
The funds coming from the sale of 1
- Page 147 and 148:
The international backlog, which al
- Page 149 and 150:
1.05.04. Industrial Services Indust
- Page 151 and 152:
2. Securities Market performance 2.
- Page 153 and 154:
2.02. Treasury shares At 31 Decembe
- Page 155 and 156:
3) Growing and responsible investme
- Page 157 and 158:
In Environmental Services, the ACS
- Page 159 and 160:
The board members shall cease to ho
- Page 161 and 162:
closing prices of the Company share
- Page 163 and 164:
Likewise, the General Shareholders
- Page 165 and 166:
equest admission of the newly issue
- Page 167 and 168:
Equity and liabilities Thousands of
- Page 169 and 170:
Consolidated statement of comprehen
- Page 171 and 172:
Consolidated statement of cash flow
- Page 173 and 174:
6. The direction and execution of a
- Page 175 and 176:
24. Handling, packing and distribut
- Page 177 and 178:
• The assumptions used in the cal
- Page 179 and 180:
Thousands of euros 31/12/2009 appli
- Page 181 and 182:
Appendix I to these notes to the co
- Page 183 and 184:
In accordance with IAS 27, since al
- Page 185 and 186:
The detail of the allocation of the
- Page 187 and 188:
3.01. Goodwill Goodwill arising on
- Page 189 and 190:
3.02.04. Remaining intangible asset
- Page 191 and 192:
This heading also includes the amou
- Page 193 and 194:
Gains or losses arising from the re
- Page 195 and 196:
The fair value of investments activ
- Page 197 and 198:
Since the ACS Group continued to ha
- Page 199 and 200:
31/12/2010 SPL Renewable Energies T
- Page 201 and 202:
3.12.02. Trade and other payables T
- Page 203 and 204:
Provisions for termination benefi t
- Page 205 and 206:
3.16. Revenue recognition Revenue i
- Page 207 and 208:
The current income tax expense is c
- Page 209 and 210:
2010 2009 Thousands of euros Divide
- Page 211 and 212:
Transactions costs are expensed (pr
- Page 213 and 214:
The change in the scope of consolid
- Page 215 and 216:
In 2009 investments amounted to EUR
- Page 217 and 218:
The Group has mortgaged land and bu
- Page 219 and 220:
The changes in this heading in 2010
- Page 221 and 222:
7. Investment property The changes
- Page 223 and 224:
The detail, by company, of the Inve
- Page 225 and 226:
Additionally, ACS Actividades de Co
- Page 227 and 228:
market price of the share is less t
- Page 229 and 230:
Finally, and in order to complete t
- Page 231 and 232:
10.03. Other loans The detail of th
- Page 233 and 234:
12. Trade and other receivables The
- Page 235 and 236:
Change in the allowances for doubtf
- Page 237 and 238:
and in the event of incomplete subs
- Page 239 and 240:
Pursuant to Consolidated Companies
- Page 241 and 242:
The exchange differences on 1 Janua
- Page 243 and 244:
The composition of the balance at 3
- Page 245 and 246:
The balances of bank borrowings At
- Page 247 and 248:
It is the Group’s policy to lease
- Page 249 and 250:
from the shares acquired. The balan
- Page 251 and 252:
- On 30 April 2010, fi nancing was
- Page 253 and 254:
contingency or corresponding challe
- Page 255 and 256:
21. Financial risk management and c
- Page 257 and 258:
Liquidity risk This risk results fr
- Page 259 and 260:
22. Derivative financial instrument
- Page 261 and 262:
• The Concesionaria Santiago Bri
- Page 263 and 264:
24. Other current liabilities The b
- Page 265 and 266:
25.02.02. Income statement by busin
- Page 267 and 268:
25.02.04. Statement of fi nancial p
- Page 269 and 270:
The reconciliation of ordinary inco
- Page 271 and 272:
The Group’s other subsidiaries fi
- Page 273 and 274:
Charge/Credit to Equity Business co
- Page 275 and 276:
Under the heading of “Capitalised
- Page 277 and 278:
The share options under the 2004 Pl
- Page 279 and 280:
29. Impairment and gains or losses
- Page 281 and 282:
33.01. Transactions with associates
- Page 283 and 284:
At 31 December 2010, the pending ba
- Page 285 and 286:
The remuneration of the Directors,
- Page 287 and 288:
Additionally, and pursuant to the a
- Page 289 and 290:
Name Activity Performed Type of arr
- Page 291 and 292:
The main environmental measures tak
- Page 293 and 294:
Principal environmental management
- Page 295 and 296:
Company Registered Office Activity
- Page 297 and 298:
Company Registered Office Activity
- Page 299 and 300:
Company Registered Office Activity
- Page 301 and 302:
Company Registered Office Activity
- Page 303 and 304:
Company Registered Office Activity
- Page 305 and 306:
Company Registered Office Activity
- Page 307 and 308:
Company Registered Office Activity
- Page 309 and 310:
Company Registered Office Activity
- Page 311 and 312:
UTE/EIG Address Activity Auditor (*
- Page 313 and 314:
Data on the investee (100%) Company
- Page 315 and 316:
Data on the investee (100%) Company
- Page 317 and 318:
Data on the investee (100%) Company
- Page 319 and 320:
Companies with consolidation accoun
- Page 321 and 322:
189 ECONOMIC AND FINANCIAL REPORT A
- Page 323:
Consolidated balance sheet as of De
- Page 327 and 328:
Corporate Responsibility Report of
- Page 330 and 331:
Corporate Responsibility Milestones
- Page 332 and 333:
Concesiones Corporate Responsibilit
- Page 334 and 335:
Concesiones Letter from the Chairma
- Page 336 and 337:
The ACS Group Group’s Profile Cor
- Page 338 and 339:
The ACS Group ACS Group is present
- Page 340 and 341:
The ACS Group The ACS Group is a wo
- Page 342 and 343:
The ACS Group ACS’s Business Sust
- Page 344 and 345:
The ACS Group Corporate Governance
- Page 346 and 347:
The ACS Group Risk Control Systems
- Page 348 and 349:
Corporate Responsibility and the AC
- Page 350 and 351:
Commitment to the Creation of Value
- Page 352 and 353:
Commitment to the Creation of Value
- Page 354 and 355:
Commitment to the Creation of Value
- Page 356 and 357:
Commitment to the Creation of Value
- Page 358 and 359:
Commitment to the Creation of Value
- Page 360 and 361:
CICLOPE Project: minimising the imp
- Page 362 and 363:
Commitment to the Creation of Value
- Page 364 and 365:
Commitment to the Creation of Value
- Page 366 and 367:
Ethics, Integrity and Transparency
- Page 368 and 369:
Ethics, Integrity and Transparency
- Page 370 and 371:
Ethics, Integrity and Transparency
- Page 372 and 373:
Commitment to Technological Develop
- Page 374 and 375:
Commitment to Technological Develop
- Page 376 and 377:
Construction system for modular fa
- Page 378 and 379:
Commitment to Technological Develop
- Page 380 and 381:
Commitment to Technological Develop
- Page 382 and 383:
Commitment to Technological Develop
- Page 384 and 385:
Commitment to the Natural Environme
- Page 386 and 387:
Information system aligned with str
- Page 388 and 389:
Commitment to the Natural Environme
- Page 390 and 391:
Commitment to the Natural Environme
- Page 392 and 393:
Biodiversity: Study on the impact o
- Page 394 and 395:
Case Study Atlantic High-Speed Rail
- Page 396 and 397:
Case Study Atlantic High-Speed Rail
- Page 398 and 399:
Case Study Atlantic High-Speed Rail
- Page 400 and 401:
Case Study Atlantic High-Speed Rail
- Page 402 and 403:
Commitment to the Natural Environme
- Page 404 and 405:
Commitment to the Natural Environme
- Page 406 and 407:
Commitment to the Social Setting Th
- Page 408 and 409:
Commitment to the Social Setting Wo
- Page 410 and 411:
Commitment to the Social Setting Br
- Page 412 and 413:
Urbaser’s Performance Assessment
- Page 414 and 415:
Commitment to the Social Setting Sa
- Page 416 and 417:
Commitment to the Social Setting Ob
- Page 418 and 419:
Commitment to the Social Setting Mo
- Page 420 and 421:
Commitment to the Social Setting Pa
- Page 422 and 423:
Campaigns for risk prevention and s
- Page 424 and 425:
Commitment to the Social Setting He
- Page 426 and 427:
Dragados - finalist in the European
- Page 428 and 429:
Commitment to the Social Setting So
- Page 430 and 431:
Case Study San Lorenzo de El Escori
- Page 432 and 433:
Case Study San Lorenzo de El Escori
- Page 434 and 435:
Principles for the Preparation of t
- Page 436 and 437:
Principles for the Preparation of t
- Page 438 and 439:
Awards and Recognitions Forbes maga
- Page 440 and 441:
Verification Report Independent Ass
- Page 442 and 443:
Main Perfomance Indicators Profile
- Page 444 and 445:
Main Perfomance Indicators Standard
- Page 446 and 447:
Main Perfomance Indicators Biodiver
- Page 448 and 449:
Main Perfomance Indicators Cross-re
- Page 450 and 451:
www.grupoacs.com Cover photo: Storm
- Page 452 and 453:
Corporate Governance Report of ACS
- Page 454 and 455:
A. Ownership Structure A.1. Complet
- Page 456 and 457:
A. Ownership Structure Complete the
- Page 458 and 459:
B. A. Estructura Ownership de la Ad
- Page 460 and 461:
B. Structure of the Company Adminis
- Page 462 and 463:
B. Structure of the Company Adminis
- Page 464 and 465:
B. Structure of the Company Adminis
- Page 466 and 467:
B. Structure of the Company Adminis
- Page 468 and 469:
B. Structure of the Company Adminis
- Page 470 and 471:
B. Structure of the Company Adminis
- Page 472 and 473:
B. Structure of the Company Adminis
- Page 474 and 475:
B. Structure of the Company Adminis
- Page 476 and 477:
B. Structure of the Company Adminis
- Page 478 and 479:
B. Structure of the Company Adminis
- Page 480 and 481:
B. Structure of the Company Adminis
- Page 482 and 483:
B. Structure of the Company Adminis
- Page 484 and 485:
B. Structure of the Company Adminis
- Page 486 and 487:
C. Related-Party Transactions C.1 M
- Page 488 and 489:
C. Related-Party Transactions The M
- Page 490 and 491:
D. Risk Control Systems D.1 General
- Page 492 and 493:
D. Risk Control Systems • Risks a
- Page 494 and 495:
E. General Shareholders’ Meeting
- Page 496 and 497:
E. General Shareholders’ Meeting
- Page 498 and 499:
F. Degree of Compliance with the Co
- Page 500 and 501:
F. Degree of Compliance with the Co
- Page 502 and 503:
F. Degree of Compliance with the Co
- Page 504 and 505:
F. Degree of Compliance with the Co
- Page 506 and 507:
F. Degree of Compliance with the Co
- Page 508 and 509:
F. Degree of Compliance with the Co
- Page 510 and 511:
F. Degree of Compliance with the Co
- Page 512 and 513:
G. Other Information of Interest If
- Page 514 and 515:
G. Other Information of Interest F.
- Page 520:
Project Director and Editor ACS Gro