- Page 1 and 2: Annual Report of ACS Group
- Page 3 and 4: Activity Report of ACS Group
- Page 8 and 9: Concesiones Annual Report of ACS Gr
- Page 10 and 11: Letter from the Chairman 04 ANNUAL
- Page 12 and 13: Management Bodies Board of Director
- Page 14 and 15: Management Bodies Management Commit
- Page 16 and 17: Management Bodies Management Team A
- Page 18 and 19: Corporate Strategy Vision A worldwi
- Page 20 and 21: Corporate Strategy History 1999 199
- Page 22 and 23: Concesiones Prospects for the infra
- Page 24 and 25: Prospects for the infrastructure de
- Page 26 and 27: Prospects for the infrastructure de
- Page 28 and 29: Prospects for the infrastructure de
- Page 30 and 31: Prospects for the infrastructure de
- Page 32 and 33: Prospects for the infrastructure de
- Page 34 and 35: Prospects for the infrastructure de
- Page 36 and 37: Concesiones Construction Business s
- Page 38 and 39: Construction Business strategy Inte
- Page 40 and 41: Construction Activity description T
- Page 42 and 43: Construction In railways, in which
- Page 44 and 45: Construction Gross operating profi
- Page 46 and 47: Construction Countries where the AC
- Page 48 and 49: Construction North America The cont
- Page 50 and 51: Concesiones Construction Main contr
- Page 52 and 53: Concessions Business strategy 48 Re
- Page 54 and 55: Concessions Business strategy Iridi
- Page 56 and 57:
Concessions Relevant events Within
- Page 58 and 59:
Concessions International markets o
- Page 60 and 61:
Concessions • Concession for the
- Page 62 and 63:
Concesiones Environment Business st
- Page 64 and 65:
Environment Business strategy In th
- Page 66 and 67:
Environment During 2010, Urbaser ma
- Page 68 and 69:
Environment • Contracts for airpo
- Page 70 and 71:
Environment Countries where the ACS
- Page 72 and 73:
Environment France The development
- Page 74 and 75:
Concesiones Environment Main contra
- Page 76 and 77:
Concesiones Industrial Services Bus
- Page 78 and 79:
Industrial Services Business strate
- Page 80 and 81:
Industrial Services Activity descri
- Page 82 and 83:
Industrial Services • Within Spec
- Page 84 and 85:
Industrial Services In Renewable En
- Page 86 and 87:
Industrial Services Wind farms in O
- Page 88 and 89:
Industrial Services Thermal Solar E
- Page 90 and 91:
Industrial Services Internationalis
- Page 92 and 93:
Industrial Services Countries where
- Page 94 and 95:
Industrial Services Mexico Mexico i
- Page 96 and 97:
Concesiones Industrial Services Mai
- Page 98 and 99:
Strategic Investments Abertis 95 Ib
- Page 100 and 101:
Strategic Investments Through its s
- Page 102 and 103:
Strategic Investments The company
- Page 104 and 105:
Strategic Investments • Hochtief
- Page 106 and 107:
Strategic investments Countries whe
- Page 108 and 109:
Main Economic- Financial figures of
- Page 110 and 111:
Main Economic- Financial figures of
- Page 112 and 113:
Main Economic- Financial figures of
- Page 114 and 115:
The ACS Group´s Commitment to Sust
- Page 116 and 117:
The ACS Group´s Commitment to Sust
- Page 118 and 119:
The ACS Group´s Commitment to Sust
- Page 120 and 121:
The ACS Group´s Commitment to Sust
- Page 122 and 123:
The ACS Group´s Commitment to Sust
- Page 124 and 125:
The ACS Group´s Commitment to Sust
- Page 126 and 127:
Corporate Governance in the ACS Gro
- Page 128 and 129:
Corporate Governance in the ACS Gro
- Page 130 and 131:
Directory Head offi ces of the ACS
- Page 132 and 133:
www.grupoacs.com Cover photo: Atoch
- Page 134 and 135:
Economic and Financial Report of AC
- Page 136 and 137:
Directors’ report for the Consoli
- Page 138 and 139:
Directors’ report for the Consoli
- Page 140 and 141:
Directors’ report for the Consoli
- Page 142 and 143:
Directors’ report for the Consoli
- Page 144 and 145:
Directors’ report for the Consoli
- Page 146 and 147:
Directors’ report for the Consoli
- Page 148 and 149:
Directors’ report for the Consoli
- Page 150 and 151:
Directors’ report for the Consoli
- Page 152 and 153:
Directors’ report for the Consoli
- Page 154 and 155:
Directors’ report for the Consoli
- Page 156 and 157:
Directors’ report for the Consoli
- Page 158 and 159:
Directors’ report for the Consoli
- Page 160 and 161:
Directors’ report for the Consoli
- Page 162 and 163:
Directors’ report for the Consoli
- Page 164 and 165:
Directors’ report for the Consoli
- Page 166 and 167:
Consolidated Financial Statements C
- Page 168 and 169:
Consolidated Financial Statements C
- Page 170 and 171:
Consolidated Financial Statements C
- Page 172 and 173:
Consolidated Financial Statements N
- Page 174 and 175:
Consolidated Financial Statements 1
- Page 176 and 177:
Consolidated Financial Statements
- Page 178 and 179:
Consolidated Financial Statements A
- Page 180 and 181:
Consolidated Financial Statements A
- Page 182 and 183:
Consolidated Financial Statements T
- Page 184 and 185:
Consolidated Financial Statements A
- Page 186 and 187:
Consolidated Financial Statements T
- Page 188 and 189:
Consolidated Financial Statements 3
- Page 190 and 191:
Consolidated Financial Statements A
- Page 192 and 193:
Consolidated Financial Statements F
- Page 194 and 195:
Consolidated Financial Statements 3
- Page 196 and 197:
Consolidated Financial Statements T
- Page 198 and 199:
Consolidated Financial Statements T
- Page 200 and 201:
Consolidated Financial Statements 3
- Page 202 and 203:
Consolidated Financial Statements T
- Page 204 and 205:
Consolidated Financial Statements 3
- Page 206 and 207:
Consolidated Financial Statements M
- Page 208 and 209:
Consolidated Financial Statements A
- Page 210 and 211:
Consolidated Financial Statements F
- Page 212 and 213:
Consolidated Financial Statements I
- Page 214 and 215:
Consolidated Financial Statements 4
- Page 216 and 217:
Consolidated Financial Statements O
- Page 218 and 219:
Consolidated Financial Statements 2
- Page 220 and 221:
Consolidated Financial Statements 2
- Page 222 and 223:
Consolidated Financial Statements 8
- Page 224 and 225:
Consolidated Financial Statements A
- Page 226 and 227:
Consolidated Financial Statements 1
- Page 228 and 229:
Consolidated Financial Statements N
- Page 230 and 231:
Consolidated Financial Statements 1
- Page 232 and 233:
Consolidated Financial Statements 1
- Page 234 and 235:
Consolidated Financial Statements 2
- Page 236 and 237:
Consolidated Financial Statements I
- Page 238 and 239:
Consolidated Financial Statements 1
- Page 240 and 241:
Consolidated Financial Statements A
- Page 242 and 243:
Consolidated Financial Statements T
- Page 244 and 245:
Consolidated Financial Statements 1
- Page 246 and 247:
Consolidated Financial Statements T
- Page 248 and 249:
Consolidated Financial Statements T
- Page 250 and 251:
Consolidated Financial Statements T
- Page 252 and 253:
Consolidated Financial Statements 2
- Page 254 and 255:
Consolidated Financial Statements S
- Page 256 and 257:
Consolidated Financial Statements I
- Page 258 and 259:
Consolidated Financial Statements T
- Page 260 and 261:
Consolidated Financial Statements T
- Page 262 and 263:
Consolidated Financial Statements A
- Page 264 and 265:
Consolidated Financial Statements 2
- Page 266 and 267:
Consolidated Financial Statements 2
- Page 268 and 269:
Consolidated Financial Statements T
- Page 270 and 271:
Consolidated Financial Statements T
- Page 272 and 273:
Consolidated Financial Statements 2
- Page 274 and 275:
Consolidated Financial Statements 2
- Page 276 and 277:
Consolidated Financial Statements T
- Page 278 and 279:
Consolidated Financial Statements T
- Page 280 and 281:
Consolidated Financial Statements A
- Page 282 and 283:
Consolidated Financial Statements 2
- Page 284 and 285:
Consolidated Financial Statements a
- Page 286 and 287:
Consolidated Financial Statements 3
- Page 288 and 289:
Consolidated Financial Statements N
- Page 290 and 291:
Consolidated Financial Statements 3
- Page 292 and 293:
Consolidated Financial Statements T
- Page 294 and 295:
Consolidated Financial Statements A
- Page 296 and 297:
Consolidated Financial Statements C
- Page 298 and 299:
Consolidated Financial Statements C
- Page 300 and 301:
Consolidated Financial Statements C
- Page 302 and 303:
Consolidated Financial Statements C
- Page 304 and 305:
Consolidated Financial Statements C
- Page 306 and 307:
Consolidated Financial Statements C
- Page 308 and 309:
Consolidated Financial Statements C
- Page 310 and 311:
Consolidated Financial Statements A
- Page 312 and 313:
Consolidated Financial Statements A
- Page 314 and 315:
Consolidated Financial Statements D
- Page 316 and 317:
Consolidated Financial Statements D
- Page 318 and 319:
Consolidated Financial Statements A
- Page 320 and 321:
Auditors’ Report on Consolidated
- Page 322 and 323:
Historical Perfomance Consolidated
- Page 326 and 327:
www.grupoacs.com Cover photo: Viadu
- Page 328:
Corporate Responsibility Objectives
- Page 331 and 332:
R+D+i Environment People Safety Mem
- Page 333 and 334:
“ACS is a company that encourages
- Page 335 and 336:
We present our Annual Corporate Res
- Page 337 and 338:
Profitability and integrity, togeth
- Page 339 and 340:
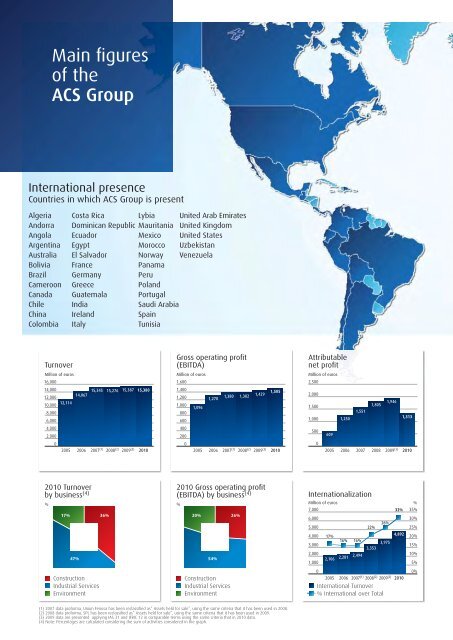
Sales per area of activity* Million
- Page 341 and 342:
projects. The Construction area had
- Page 343 and 344:
Each of the ACS Group’s companies
- Page 345 and 346:
As regards the function of the Boar
- Page 347 and 348:
characteristics and its profi tabil
- Page 349 and 350:
The ACS Group’s Five Commitments
- Page 351 and 352:
Shareholders At 31 December 2010, t
- Page 353 and 354:
Clients 2010 Milestones Challenges
- Page 355 and 356:
project and in line with the specif
- Page 357 and 358:
These quality systems are audited p
- Page 359 and 360:
and those of the suppliers to ident
- Page 361 and 362:
Practical example: Expansion of Mad
- Page 363 and 364:
In the fi rst case, in which the AC
- Page 365 and 366:
Additionally, clauses terminating t
- Page 367 and 368:
Due Diligence in Ethics and Integri
- Page 369 and 370:
www.grupoacs.com 2008 2009 2010 Dai
- Page 371 and 372:
Meetings with institutional investo
- Page 373 and 374:
Strategic decisions for the develop
- Page 375 and 376:
Construction The ACS Group’s cons
- Page 377 and 378:
INNODRAVAL: Innovation in environme
- Page 379 and 380:
Integrated system for electrical ur
- Page 381 and 382:
Remote management system for trolle
- Page 383 and 384:
CENIT VERDE project The objective o
- Page 385 and 386:
Strategic Priorities The ACS Group
- Page 387 and 388:
Climate Change The ACS Group shares
- Page 389 and 390:
To this effect, the ACS Group strat
- Page 391 and 392:
Biodiversity The ACS Group’s acti
- Page 393 and 394:
Construction The construction activ
- Page 395 and 396:
The space shelters the following ha
- Page 397 and 398:
Description of environmental action
- Page 399 and 400:
As such, aspects related to the fol
- Page 401 and 402:
Protection tion of socioeconomic hu
- Page 403 and 404:
Industrial Services The Industrial
- Page 405 and 406:
ROMULO Project. Electrical intercon
- Page 407 and 408:
Talent retention and professional d
- Page 409 and 410:
epresented on the boards of directo
- Page 411 and 412:
Labour Relations and Union Represen
- Page 413 and 414:
Training in the subject of Human Ri
- Page 415 and 416:
Safety: One of the ACS Group’s Pr
- Page 417 and 418:
For example, in the ETRA Group comp
- Page 419 and 420:
Health and safety indicators Freque
- Page 421 and 422:
Health and safety training No. of s
- Page 423 and 424:
Risk Prevention Culture in the Valu
- Page 425 and 426:
Occupational Health It is usually t
- Page 427 and 428:
Collaboration with Institutions and
- Page 429 and 430:
Impact and Monitoring of Social Act
- Page 431 and 432:
Improved accessibility for people w
- Page 433 and 434:
Tapestry Room and Museums From the
- Page 435 and 436:
complete opinion on the company’s
- Page 437 and 438:
The charts included in this report
- Page 439 and 440:
Global Reporting Initiative Report
- Page 441 and 442:
2 Verifying that the financial inf
- Page 443 and 444:
Cross-reference 3.13 Policy and cur
- Page 445 and 446:
Performance Indicators Economic Cro
- Page 447 and 448:
Social: Labor Practices and Decent
- Page 449 and 450:
Cross-reference Anti-competitive be
- Page 451 and 452:
Corporate Governance Report of ACS
- Page 453 and 454:
03 CORPORATE GOVERNANCE REPORT
- Page 455 and 456:
Indicate the most signifi cant chan
- Page 457 and 458:
Name or company name related Iberos
- Page 459 and 460:
Indicate whether there are any stat
- Page 461 and 462:
Proprietary & External Directors Na
- Page 463 and 464:
B.1.7. If applicable, identify the
- Page 465 and 466:
Other benefits Thousands of euros A
- Page 467 and 468:
B.1.13. Indicate on an aggregate ba
- Page 469 and 470:
B.1.17 Indicate the identity of any
- Page 471 and 472:
Description of amendments (continua
- Page 473 and 474:
Description of amendments (continua
- Page 475 and 476:
Article 24.- The Appointment and Re
- Page 477 and 478:
B.1.24 Indicate if the Chairman has
- Page 479 and 480:
B.1.34 Explain the procedures relat
- Page 481 and 482:
B.1.41 Indicate and detail, if appl
- Page 483 and 484:
B.2.3 Provide a description of the
- Page 485 and 486:
B.2.5 Indicate, if applicable, if t
- Page 487 and 488:
C.6 Mechanisms established to detec
- Page 489 and 490:
with the fi nancial marriage rules,
- Page 491 and 492:
system for each business area, and
- Page 493 and 494:
Related circumstances Those arising
- Page 495 and 496:
E.5 Indicate if the position of Cha
- Page 497 and 498:
E.9 Indicate whether there is a sta
- Page 499 and 500:
6. Companies shall allow split vote
- Page 501 and 502:
12. Among external Board Members, t
- Page 503 and 504:
20. Board Member absences will be k
- Page 505 and 506:
31. The Board of Directors may not
- Page 507 and 508:
38. In the case of remuneration lin
- Page 509 and 510:
Complies Explain X 46. All members
- Page 511 and 512:
54. The majority of the members of
- Page 513 and 514:
The Iberostar Group is listed due t
- Page 515:
Date and signature: This Annual Cor