E2 - King Fahd University of Petroleum and Minerals
E2 - King Fahd University of Petroleum and Minerals
E2 - King Fahd University of Petroleum and Minerals

You also want an ePaper? Increase the reach of your titles
YUMPU automatically turns print PDFs into web optimized ePapers that Google loves.
STAT 212 Business Statistics II – Term111<br />
6<br />
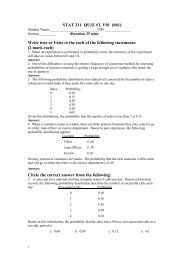
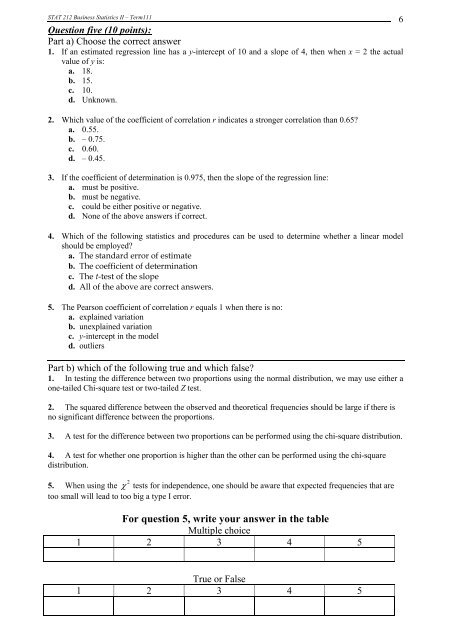
Question five (10 points):<br />
Part a) Choose the correct answer<br />
1. If an estimated regression line has a y-intercept <strong>of</strong> 10 <strong>and</strong> a slope <strong>of</strong> 4, then when x = 2 the actual<br />
value <strong>of</strong> y is:<br />
a. 18.<br />
b. 15.<br />
c. 10.<br />
d. Unknown.<br />
2. Which value <strong>of</strong> the coefficient <strong>of</strong> correlation r indicates a stronger correlation than 0.65<br />
a. 0.55.<br />
b. – 0.75.<br />
c. 0.60.<br />
d. – 0.45.<br />
3. If the coefficient <strong>of</strong> determination is 0.975, then the slope <strong>of</strong> the regression line:<br />
a. must be positive.<br />
b. must be negative.<br />
c. could be either positive or negative.<br />
d. None <strong>of</strong> the above answers if correct.<br />
4. Which <strong>of</strong> the following statistics <strong>and</strong> procedures can be used to determine whether a linear model<br />
should be employed<br />
a. The st<strong>and</strong>ard error <strong>of</strong> estimate<br />
b. The coefficient <strong>of</strong> determination<br />
c. The t-test <strong>of</strong> the slope<br />
d. All <strong>of</strong> the above are correct answers.<br />
5. The Pearson coefficient <strong>of</strong> correlation r equals 1 when there is no:<br />
a. explained variation<br />
b. unexplained variation<br />
c. y-intercept in the model<br />
d. outliers<br />
Part b) which <strong>of</strong> the following true <strong>and</strong> which false<br />
1. In testing the difference between two proportions using the normal distribution, we may use either a<br />
one-tailed Chi-square test or two-tailed Z test.<br />
2. The squared difference between the observed <strong>and</strong> theoretical frequencies should be large if there is<br />
no significant difference between the proportions.<br />
3. A test for the difference between two proportions can be performed using the chi-square distribution.<br />
4. A test for whether one proportion is higher than the other can be performed using the chi-square<br />
distribution.<br />
5. When using the 2 tests for independence, one should be aware that expected frequencies that are<br />
too small will lead to too big a type I error.<br />
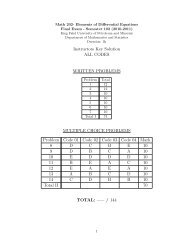
For question 5, write your answer in the table<br />
Multiple choice<br />
1 2 3 4 5<br />
True or False<br />
1 2 3 4 5