E2 - King Fahd University of Petroleum and Minerals
E2 - King Fahd University of Petroleum and Minerals
E2 - King Fahd University of Petroleum and Minerals

You also want an ePaper? Increase the reach of your titles
YUMPU automatically turns print PDFs into web optimized ePapers that Google loves.
STAT 212 Business Statistics II – Term111<br />
1<br />
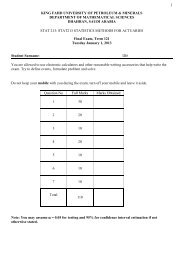
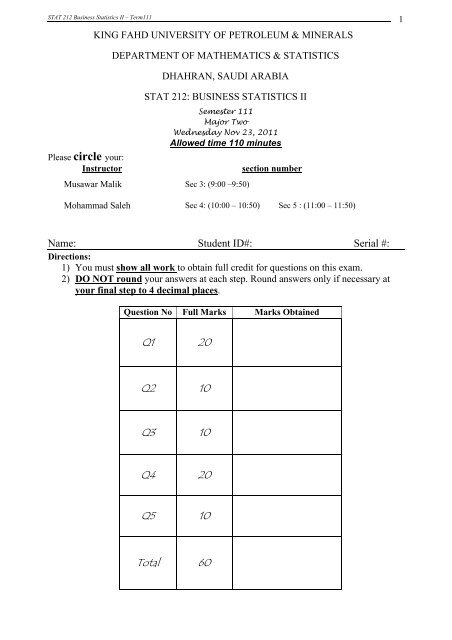
KING FAHD UNIVERSITY OF PETROLEUM & MINERALS<br />
DEPARTMENT OF MATHEMATICS & STATISTICS<br />
DHAHRAN, SAUDI ARABIA<br />
STAT 212: BUSINESS STATISTICS II<br />
Semester 111<br />
Major Two<br />
Wednesday Nov 23, 2011<br />
Allowed time 110 minutes<br />
Please circle your:<br />
Instructor<br />
section number<br />
Musawar Malik Sec 3: (9:00 –9:50)<br />
Mohammad Saleh Sec 4: (10:00 – 10:50) Sec 5 : (11:00 – 11:50)<br />
Name: Student ID#: Serial #:<br />
Directions:<br />
1) You must show all work to obtain full credit for questions on this exam.<br />
2) DO NOT round your answers at each step. Round answers only if necessary at<br />
your final step to 4 decimal places.<br />
Question No Full Marks Marks Obtained<br />
Q1 20<br />
Q2 10<br />
Q3 10<br />
Q4 20<br />
Q5 10<br />
Total 60
STAT 212 Business Statistics II – Term111<br />
2<br />
Question One (20 points)<br />
According to an article in Marketing News, fewer checks are being written at grocery store<br />
checkout st<strong>and</strong>s than in the past. To determine whether there is a difference in the proportion <strong>of</strong><br />
shoppers who pay by check among three consecutive years at a 0.05 level <strong>of</strong> significance, the<br />
results <strong>of</strong> a survey <strong>of</strong> 500 shoppers in three consecutive years are obtained <strong>and</strong> presented below.<br />
Year<br />
Check Written Year 1 Year 2 Year 3<br />
Yes 225 175 125<br />
No 275 325 375<br />
1. Is there evidence <strong>of</strong> a significant difference in the proportion <strong>of</strong> shoppers who pay by check<br />
among three consecutive years What is the correct conclusion<br />
2. What the assumptions needed to perform the test Are the assumptions satisfied<br />
3. If appropriate, use the Marascuilo procedure <strong>and</strong> = 0.05 to determine which proportions<br />
years are different. Discuss your results.
STAT 212 Business Statistics II – Term111<br />
3<br />
Question Two (10 points):<br />
The director <strong>of</strong> the MBA program <strong>of</strong> a state university wanted to know if a one week orientation<br />
would change the proportion among potential incoming students who would perceive the<br />
program as being good. Given below is the result from 215 students’ view <strong>of</strong> the program before<br />
<strong>and</strong> after the orientation.<br />
What should be the director’s conclusion<br />
After the Orientation<br />
Before the Orientation Good Not Good<br />
Good 93 37<br />
Not Good 71 14
STAT 212 Business Statistics II – Term111<br />
4<br />
Question Three (2 each = 10 points):<br />
A large national bank charges local companies for using their services. A bank <strong>of</strong>ficial reported<br />
the results <strong>of</strong> a regression analysis designed to predict the bank’s charges (Y) -- measured in<br />
dollars per month -- for services rendered to local companies. One independent variable used to<br />
predict service charge to a company is the company’s sales revenue (X) -- measured in millions<br />
<strong>of</strong> dollars. Data for 21 companies who use the bank’s services were used to fit the model:<br />
E(Y) 0<br />
1<br />
X<br />
The results <strong>of</strong> the simple linear regression are provided below.<br />
<br />
y 2,700 20 X , S 65, two-tailed p value 0.034 (for testing )<br />
1. Interpret the estimate <strong>of</strong> <br />
0<br />
, the Y-intercept <strong>of</strong> the line.<br />
<br />
<br />
2. Interpret the estimate <strong>of</strong> <br />
1<br />
, the Y-intercept <strong>of</strong> the line.<br />
3. Interpret the estimate <strong>of</strong> , the st<strong>and</strong>ard deviation <strong>of</strong> the r<strong>and</strong>om error term (st<strong>and</strong>ard error<br />
<strong>of</strong> the estimate) in the model.<br />
4. Interpret the p-value for testing whether <br />
1<br />
exceeds 0.<br />
5. A 95% confidence interval for <br />
1<br />
is (15, 30). Interpret the interval.
STAT 212 Business Statistics II – Term111<br />
5<br />
Question four (2+3+2+2+2+9=20 points):<br />
A c<strong>and</strong>y bar manufacturer is interested in trying to estimate how sales are influenced by the price<br />
<strong>of</strong> their product. To do this, the company r<strong>and</strong>omly chooses 6 small cities <strong>and</strong> <strong>of</strong>fers the c<strong>and</strong>y<br />
bar at different prices. Using c<strong>and</strong>y bar sales as the dependent variable, the company will<br />
conduct a simple linear regression on the data below:<br />
City River Falls Hudson Ellsworth Prescott Rock Elm Stillwater<br />
Price ($) 1.3 1.6 1.8 2 2.4 2.9<br />
Sales 100 90 90 40 38 32<br />
You may use the following information’s<br />
Σx = 12, Σy = 390, Σxy = 700, Σx 2 = 25.66, Σy 2 = 30268<br />
1. What is the estimated average change in the sales <strong>of</strong> the c<strong>and</strong>y bar if price goes up by $1.00<br />
2. If the price <strong>of</strong> the c<strong>and</strong>y bar is set at $2, then estimate the average sales.<br />
3. What percentage <strong>of</strong> the total variation in c<strong>and</strong>y bar sales is explained by prices<br />
4. What is the st<strong>and</strong>ard error <strong>of</strong> the estimate for the data<br />
5. What is the st<strong>and</strong>ard error <strong>of</strong> the regression slope estimate,<br />
S<br />
b 1<br />
<br />
6. Test whether a change in price will have any impact on average sales Use = 0.05.
STAT 212 Business Statistics II – Term111<br />
6<br />
Question five (10 points):<br />
Part a) Choose the correct answer<br />
1. If an estimated regression line has a y-intercept <strong>of</strong> 10 <strong>and</strong> a slope <strong>of</strong> 4, then when x = 2 the actual<br />
value <strong>of</strong> y is:<br />
a. 18.<br />
b. 15.<br />
c. 10.<br />
d. Unknown.<br />
2. Which value <strong>of</strong> the coefficient <strong>of</strong> correlation r indicates a stronger correlation than 0.65<br />
a. 0.55.<br />
b. – 0.75.<br />
c. 0.60.<br />
d. – 0.45.<br />
3. If the coefficient <strong>of</strong> determination is 0.975, then the slope <strong>of</strong> the regression line:<br />
a. must be positive.<br />
b. must be negative.<br />
c. could be either positive or negative.<br />
d. None <strong>of</strong> the above answers if correct.<br />
4. Which <strong>of</strong> the following statistics <strong>and</strong> procedures can be used to determine whether a linear model<br />
should be employed<br />
a. The st<strong>and</strong>ard error <strong>of</strong> estimate<br />
b. The coefficient <strong>of</strong> determination<br />
c. The t-test <strong>of</strong> the slope<br />
d. All <strong>of</strong> the above are correct answers.<br />
5. The Pearson coefficient <strong>of</strong> correlation r equals 1 when there is no:<br />
a. explained variation<br />
b. unexplained variation<br />
c. y-intercept in the model<br />
d. outliers<br />
Part b) which <strong>of</strong> the following true <strong>and</strong> which false<br />
1. In testing the difference between two proportions using the normal distribution, we may use either a<br />
one-tailed Chi-square test or two-tailed Z test.<br />
2. The squared difference between the observed <strong>and</strong> theoretical frequencies should be large if there is<br />
no significant difference between the proportions.<br />
3. A test for the difference between two proportions can be performed using the chi-square distribution.<br />
4. A test for whether one proportion is higher than the other can be performed using the chi-square<br />
distribution.<br />
5. When using the 2 tests for independence, one should be aware that expected frequencies that are<br />
too small will lead to too big a type I error.<br />
For question 5, write your answer in the table<br />
Multiple choice<br />
1 2 3 4 5<br />
True or False<br />
1 2 3 4 5