Exam topics for the oral examination - biostatistics (1st semester)
Exam topics for the oral examination - biostatistics (1st semester)
Exam topics for the oral examination - biostatistics (1st semester)

Create successful ePaper yourself
Turn your PDF publications into a flip-book with our unique Google optimized e-Paper software.
t<br />
Ed<br />
aV<br />
JS<br />
tD<br />
decr<br />
Equal variances assumed<br />
Equal variances not<br />
assumed<br />
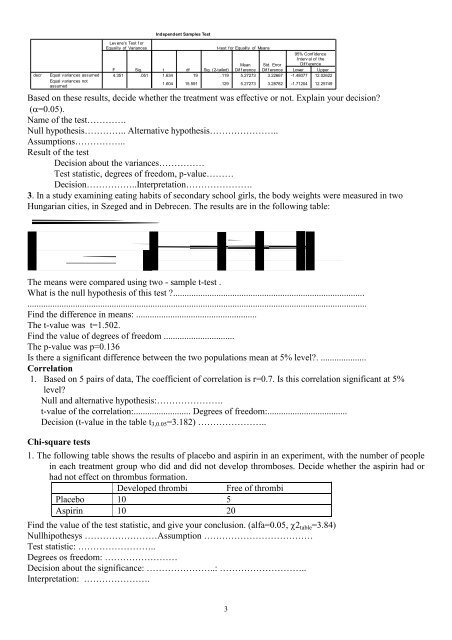
Independent Samples Test<br />
Levene's Test f or<br />
Equality of Variances<br />
t-test <strong>for</strong> Equality of Means<br />
95% Confidence<br />
Interv al of <strong>the</strong><br />
Mean Std. Error Dif f erence<br />
F Sig. t df Sig. (2-tailed) Dif f erence Dif f erence Lower Upper<br />
4.351 .051 1.634 19 .119 5.27273 3.22667 -1.48077 12.02622<br />
1.604 15.591 .129 5.27273 3.28782 -1.71204 12.25749<br />
Based on <strong>the</strong>se results, decide whe<strong>the</strong>r <strong>the</strong> treatment was effective or not. Explain your decision<br />
(=0.05).<br />
Name of <strong>the</strong> test………….<br />
Null hypo<strong>the</strong>sis………….. Alternative hypo<strong>the</strong>sis…………………..<br />
Assumptions……………..<br />
Result of <strong>the</strong> test<br />
Decision about <strong>the</strong> variances……………<br />
Test statistic, degrees of freedom, p-value………<br />
Decision……………..Interpretation………………….<br />
3. In a study examining eating habits of secondary school girls, <strong>the</strong> body weights were measured in two<br />
Hungarian cities, in Szeged and in Debrecen. The results are in <strong>the</strong> following table:<br />
The means were compared using two - sample t-test .<br />
What is <strong>the</strong> null hypo<strong>the</strong>sis of this test ....................................................................................<br />
.....................................................................................................................................................<br />
Find <strong>the</strong> difference in means: .....................................................<br />
The t-value was t=1.502.<br />
Find <strong>the</strong> value of degrees of freedom ...............................<br />
The p-value was p=0.136<br />
Is <strong>the</strong>re a significant difference between <strong>the</strong> two populations mean at 5% level. ....................<br />
Correlation<br />
1. Based on 5 pairs of data, The coefficient of correlation is r=0.7. Is this correlation significant at 5%<br />
level<br />
Null and alternative hypo<strong>the</strong>sis:………………….<br />
t-value of <strong>the</strong> correlation:......................... Degrees of freedom:...................................<br />
Decision (t-value in <strong>the</strong> table t 3,0.05 =3.182) …………………..<br />
Chi-square tests<br />
1. The following table shows <strong>the</strong> results of placebo and aspirin in an experiment, with <strong>the</strong> number of people<br />
in each treatment group who did and did not develop thromboses. Decide whe<strong>the</strong>r <strong>the</strong> aspirin had or<br />
had not effect on thrombus <strong>for</strong>mation.<br />
Developed thrombi Free of thrombi<br />
Placebo 10 5<br />
Aspirin 10 20<br />
Find <strong>the</strong> value of <strong>the</strong> test statistic, and give your conclusion. (alfa=0.05, 2 table =3.84)<br />
Nullhipo<strong>the</strong>sys ……………………Assumption ………………………………<br />
Test statistic: ……………………..<br />
Degrees os freedom: ……………………<br />
Decision about <strong>the</strong> significance: …………………..: ………………………..<br />
Interpretation: ………………….<br />
3