Untitled - Civic Exchange
Untitled - Civic Exchange
Untitled - Civic Exchange

Create successful ePaper yourself
Turn your PDF publications into a flip-book with our unique Google optimized e-Paper software.
SUSTAINABLE TRANSPORT IN HONG KONG: DIRECTIONS AND OPPORTUNITIES<br />
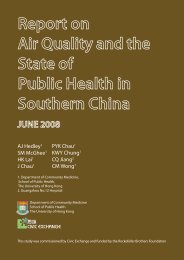
Figure 6.7 indicates that between 1995 and 2000, seaborne<br />
container traffic increased from 11.0 to 13.3 million TEUs, an<br />
increase of 3.9% per year. Review of the relevant data suggests<br />
that this was largely the result of increased containerization of<br />
cargo, particularly goods from mainland China being sent<br />
abroad through Hong Kong. The containerization rate of these<br />
goods increased progressively from 78% in 1995 to 93% in<br />
2000. The scope for further containerization seems limited.<br />
Nevertheless, a high rate of growth in container traffic is<br />
projected to 2020.<br />
Figure 6.7 shows even higher projected rates of increase and<br />
accelerated growth in traffic through Shenzhen's container<br />
ports, which are set to pass Hong Kong in terms of container<br />
traffic during the next two decades. For 2001, Shenzhen's<br />
container traffic met its projected trajectory, putting it among<br />
the world's ten busiest container ports for the first time. In the<br />
same year, Hong Kong's container traffic fell below projections;<br />
however, the port remained the world's busiest.<br />
Figure 6.7 Containerized seaborne<br />
cargo handled at Hong Kong and<br />
Shenzhen ports, actual and projected,<br />
1995-2001<br />
The projected increases in Hong Kong's port traffic seem unfounded, based on wishful thinking rather than<br />
realistic appraisals of trends and opportunities. The total amount of seaborne freight handled is a critical<br />
indicator of port traffic and has essentially remained constant in Hong Kong since 1995. Yet the Port and<br />
Maritime Board report suggests it will suddenly show large (4%) annual increases and sustain these<br />
increases for two decades. The amount of seaborne container freight, possibly a more important indicator,<br />
has been almost as flat. The increase in container freight is largely due to increased containerization rather<br />
than increased throughput. And yet this measure is expected to show even larger increases.<br />
Moreover, the Port and Maritime Board's forecast document itself notes that profound challenges are ahead<br />
for Hong Kong's port. Most of the port activity involves goods originating in or destined for Guangdong<br />
Province. Hong Kong has higher handling charges than the Shenzhen ports and the cost of moving goods<br />
between Guangdong and Hong Kong is high. Rationalization of customs procedures and tariffs following<br />
WTO accession will encourage use of Shenzhen ports. At the same time, the progressive liberalization of<br />
trade between mainland China and Taiwan, possibly imminent, will favor use of northern ports.<br />
The hope for Hong Kong, according to the document, lies in provision of services, chiefly logistics and<br />
banking, that may be less available in Shenzhen. This matter will be discussed in section 6.3.<br />
Projections of the volume of airfreight handled at Chek Lap Kok Airport (Hong Kong International Airport)<br />
speak to increases of 6% a year in regular cargo and 12% a year in express cargo. 209 Using the 2000 total<br />
of 2.24 million tonnes as a base, and assuming that express cargo is presently 5% of total air cargo, the<br />
projected total volume in 2020 is close to 7.9 million tonnes. This would represent an overall increase over<br />
the 2000 level of 250%, or about 6.5% annually.<br />
This increase is even higher than that projected for ocean cargo. It is, however, more in accordance with<br />
recent trends. Airfreight volume handled at Hong Kong airports increased by just under 9% annually over<br />
the period from 1995 to 2000 (see Figure 6.4). Moreover, the airport was designed to incorporate additional<br />
facilities that would ultimately permit the handling of nine million tonnes of cargo annually.<br />
Ocean cargo (millions of TEUs)<br />
60<br />
50<br />
40<br />
30<br />
20<br />
10<br />
0<br />
Hong Kong<br />
Shenzhen<br />
1995 2000 2005 2010 2015 2020<br />
209<br />
Airport Authority Hong Kong (2001), Hong Kong International Airport Master Plan 2020, Hong Kong.<br />
62