EACC Bolivia
EACC Bolivia
EACC Bolivia

Create successful ePaper yourself
Turn your PDF publications into a flip-book with our unique Google optimized e-Paper software.
d E v E l o p m E n t A n d c l i m A t E c h A n g E d i s c U s s i o n pA p E R s<br />
31<br />
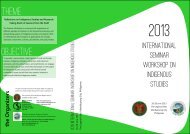
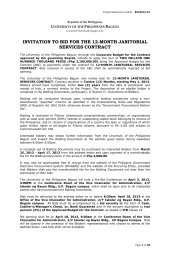
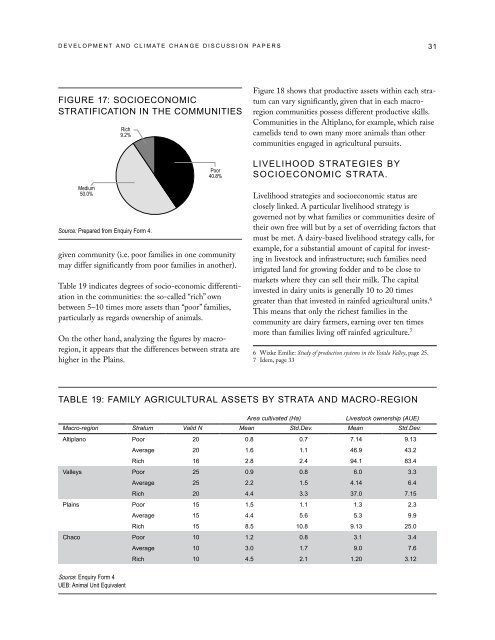
figURE 17: socioEconomic<br />
stRAtificAtion in thE commUnitiEs<br />
Medium<br />
50.0%<br />
Rich<br />
9.2%<br />
Source: Prepared from Enquiry Form 4.<br />
Poor<br />
40.8%<br />
given community (i.e. poor families in one community<br />
may differ significantly from poor families in another).<br />
Table 19 indicates degrees of socio-economic differentiation<br />
in the communities: the so-called “rich” own<br />
between 5–10 times more assets than “poor” families,<br />
particularly as regards ownership of animals.<br />
On the other hand, analyzing the figures by macroregion,<br />
it appears that the differences between strata are<br />
higher in the Plains.<br />
Figure 18 shows that productive assets within each stratum<br />
can vary significantly, given that in each macroregion<br />
communities possess different productive skills.<br />
Communities in the Altiplano, for example, which raise<br />
camelids tend to own many more animals than other<br />
communities engaged in agricultural pursuits.<br />
livElihood stRAtEgiEs By<br />
socioEconomic stRAtA.<br />
Livelihood strategies and socioeconomic status are<br />
closely linked. A particular livelihood strategy is<br />
governed not by what families or communities desire of<br />
their own free will but by a set of overriding factors that<br />
must be met. A dairy-based livelihood strategy calls, for<br />
example, for a substantial amount of capital for investing<br />
in livestock and infrastructure; such families need<br />
irrigated land for growing fodder and to be close to<br />
markets where they can sell their milk. The capital<br />
invested in dairy units is generally 10 to 20 times<br />
greater than that invested in rainfed agricultural units. 6<br />
This means that only the richest families in the<br />
community are dairy farmers, earning over ten times<br />
more than families living off rainfed agriculture. 7<br />
6 Wizke Emilie: Study of production systems in the Yotala Valley, page 25.<br />
7 Idem, page 33<br />
tABlE 19: fAmily AgRicUltURAl AssEts By stRAtA And mAcRo-REgion<br />
Area cultivated (Ha)<br />
Livestock ownership (AUE)<br />
Macro-region Stratum Valid N Mean Std.Dev. Mean Std.Dev.<br />
Altiplano poor 20 0.8 0.7 7.14 9.13<br />
Average 20 1.6 1.1 46.9 43.2<br />
Rich 16 2.8 2.4 94.1 83.4<br />
valleys poor 25 0.9 0.8 6.0 3.3<br />
Average 25 2.2 1.5 4.14 6.4<br />
Rich 20 4.4 3.3 37.0 7.15<br />
plains poor 15 1.5 1.1 1.3 2.3<br />
Average 15 4.4 5.6 5.3 9.9<br />
Rich 15 8.5 10.8 9.13 25.0<br />
chaco poor 10 1.2 0.8 3.1 3.4<br />
Average 10 3.0 1.7 9.0 7.6<br />
Rich 10 4.5 2.1 1.20 3.12<br />
Source: Enquiry Form 4<br />
UEB: Animal Unit Equivalent